Parameters in Oracle Analytics Cloud workbooks are variables that can hold one or more values from a range of predefined possible values. They help workbook authors build interactive dashboards for end users. Authors can bind these parameters to filters and visualization properties, giving end users more control over what they see in dashboards. How you bind a parameter determines how its value affects visualizations in the dashboard.
Parameter binding to different filter types
The dashboard shown below has a date/time (Order Date), a measure (Sales), and two attributes (Product Category and City) used as filter controls in a dashboard filter across two canvases: Sales and Shipping. We’ll use these fields to show how you can bind parameters to different filter types.
List filter selection
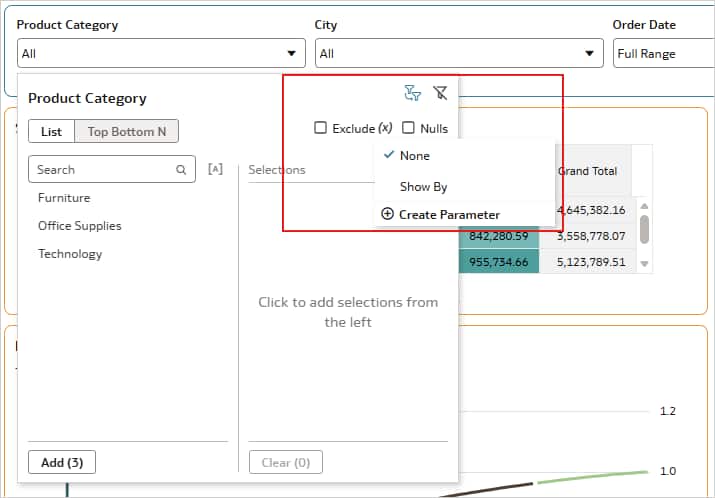
Authors can bind list filter selections to a parameter so that the values selected in the list filter are stored in the parameter. In the image shown below, the Product Category parameter is created and bound to the Product Category filter selections in the dashboard filter on the Sales canvas.
Similarly, a parameter can also be bound to exclude control of the list filters.
Method and Count attributes of a Top/Bottom N filter
Attributes of Top/Bottom N filters can be bound to parameters to hold their values. A parameter with possible values of Top and Bottom can be bound to the Method attribute, whereas a parameter with possible positive integer values can be bound to the Count attribute.
Start Date and End Date attributes of a Date Range filter
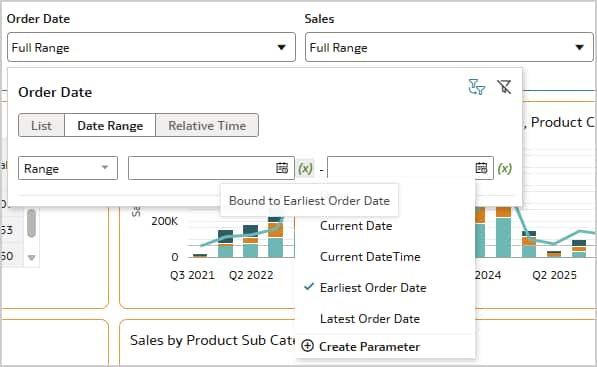
A parameter with possible date/time values, can be bound to the Earliest and Latest attributes of a range filter on a date/time field. In the image shown below, the Earliest Order Date parameter is bound to the Earliest attribute of the Range filter on the Order Date field.
Attributes of a Relative Time filter
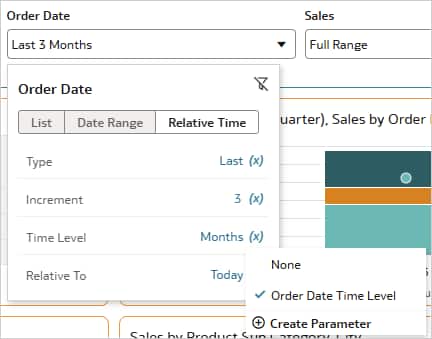
As with the other filter types described above, you can bind parameters to Type, Increment, Time Level and Relative To attributes of Relative Time filter on date/time fields. This lets you precisely control the relative time filters across the canvases. The image below shows a parameter bound to the Time Level attribute of a Relative Time filter on Order Date.
Start and End attributes of a Range filter
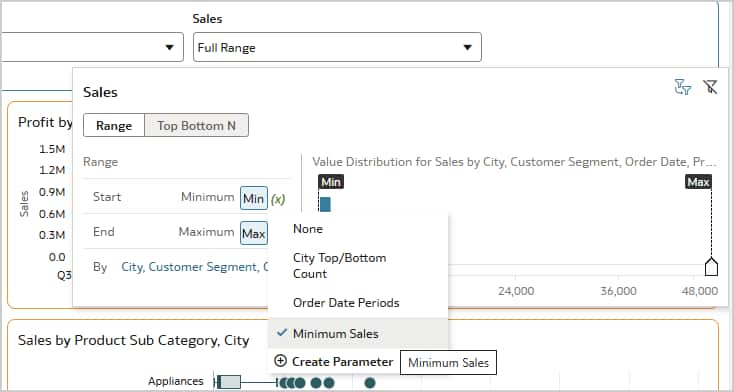
When you apply a Range filter to a measure, you can bind Start and End attributes to parameters with double or integer values. In the image shown below, the Minimum Sales parameter is bound to the Start attribute of the Range filter on the Sales measure.
Parameter binding to reference line values
You can plot reference lines in charts based on parameter values. You can bind the Value property of reference line to a parameter that holds values of corresponding attribute. In the image shown below, the Product Sub Category parameter is bound to the Value property of a reference line on a horizontal box plot. The chart then plots the reference line for the selected product subcategory.
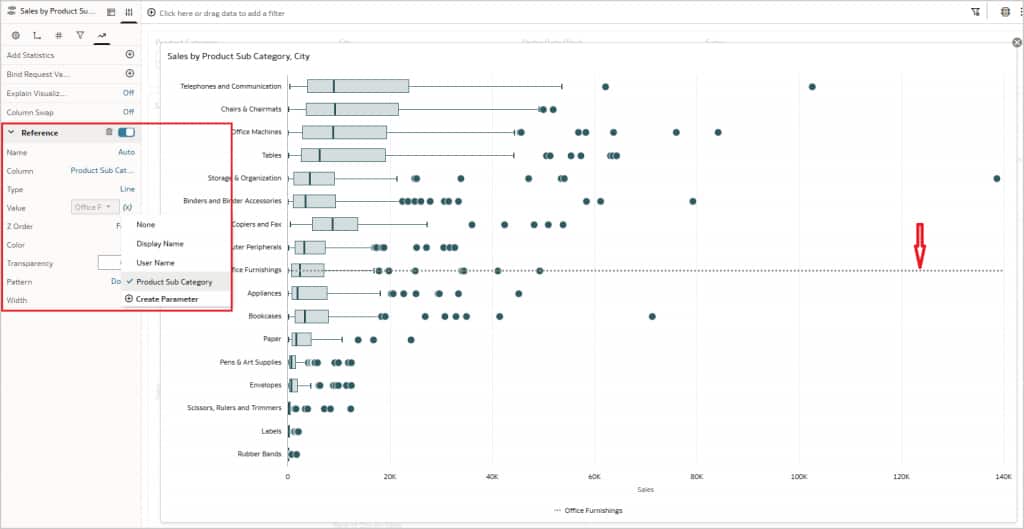
This feature is very useful when you want to dynamically plot the reference lines on category axis of a chart. For example, you might want to compare a product subcategory’s sales with other categories, or baseline a quarter’s sales against other quarters. When you expose the bound parameter to the end users, they can benchmark subcategories, quarters, and other data points by selecting parameter values.
Parameter binding to the Visibility property in visualizations
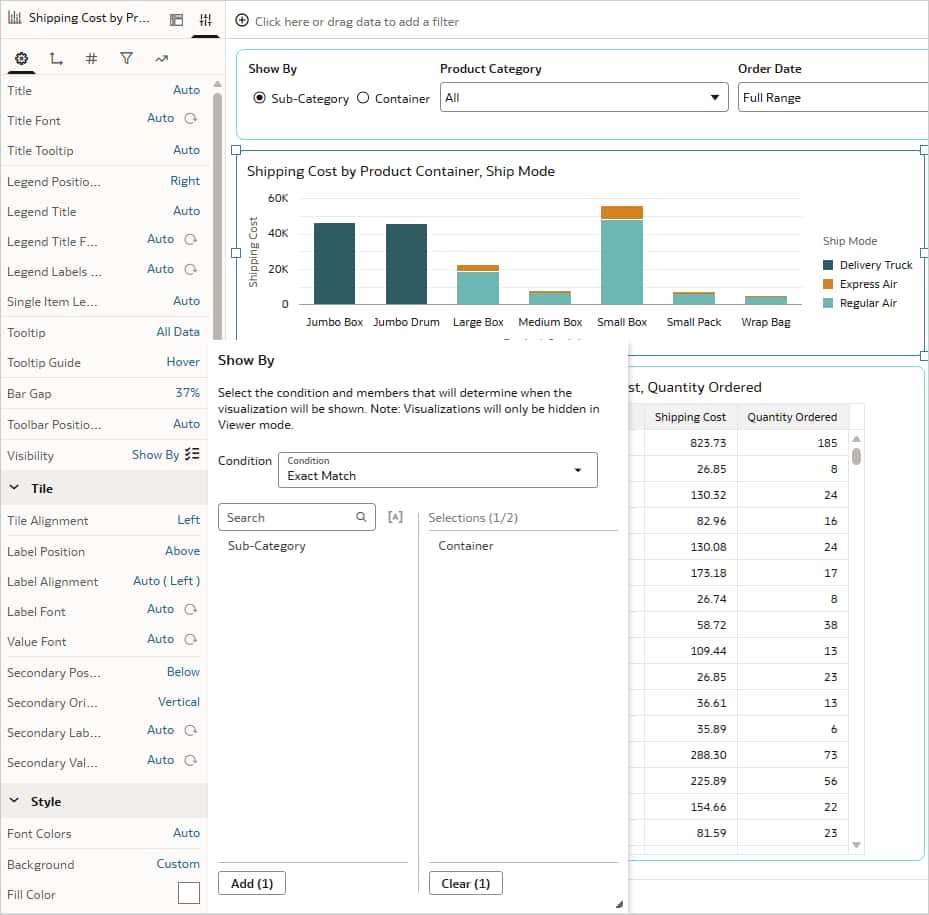
You can bind parameters to the Visibility property of visualizations in Oracle Analytics Cloud dashboards to conditionally show or hide a visualization based on the parameter value. For example, you can overlay multiple visualizations in same area on a dashboard and display a specific visualization based on the end user’s selection. In the image shown below, the user changes the Show By parameter to display the visualization they want.
The scatter chart and the bar chart are overlaid at same position on an Oracle Analytics Cloud canvas in freeform layout. The Show By parameter is defined with Sub-Category and Container as possible values. The workbook author binds the Show By parameter to the Visibility attribute for both charts and specifies which parameter value displays each chart. For the bar chart, Container is selected. For the scatter chart, Sub-Category is selected.
For a detailed demo of parameter binding to the Visibility property, see this video.
Let end users modify bound parameter values
A workbook author can put the bound parameter itself as the filter control so end users can modify the parameter directly. In some cases, end users want an easy way to adjust an attribute of a parameter-bound filter – for example, the Time Level attribute of a relative time filter – so they can quickly view metrics at different time levels.
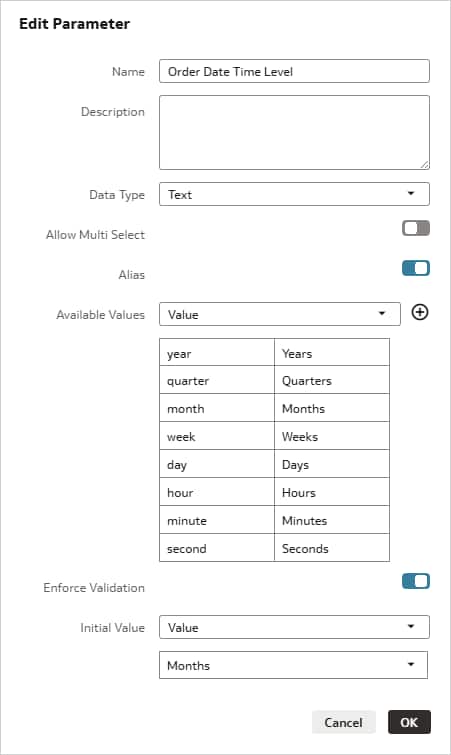
The below image shows the Order Date Time Level parameter exposed as a filter option for end users. When an end user changes the parameter value from Months to Quarters, the Relative Time filter updates from Last 6 Months to Last 6 Quarters.
Consistent data filter across all canvases
A common use of parameter binding in Oracle Analytics Cloud dashboards is to help end users apply the same filter values across multiple canvases. For example, a workbook author can bind the City Top/Bottom Method and City Top/Bottom Count parameters to the Method and Count attributes in the City filter control on both the Sales and Shipping canvases. Then, when an end user changes the city count on one canvas, the count updates on the other canvas as well.
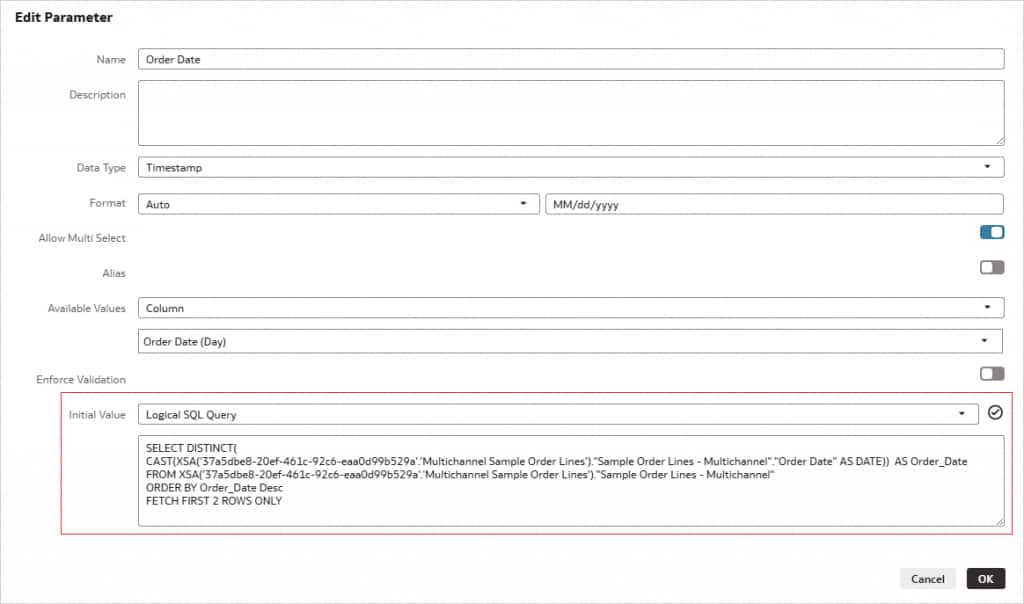
Set initial filter values using parameter initial value
When you define an initial value for a parameter, those values are selected in the bound filters when the workbook opens. This becomes more powerful when you set the initial value by using a Logical SQL query to return dynamic values. For example, you can show data for the most recent N days by using Logical SQL to set the initial value of a date filter parameter to the latest N days.
Call To Action
Beyond binding to filters and visualization properties, Oracle Analytics Cloud workbook parameters support additional capabilities that can improve the end user dashboard experience.
See the user assistance documentation for this Oracle Analytics Cloud feature here.
To learn more about the fundamentals of the parameters, see the Leverage Parameters for dynamic data manipulations blog article.
Visit the Oracle Analytics community to ask questions and share ideas.