When you’re trying to pitch a great idea based on data points, the last thing you want is to bombard your audience with columns and rows. It’s the stories that your data points tell that humanizes them – stories of growth, decline, challenges met, and smashing victory. At Oracle, we know that the quickest, most efficient way to share the stories of your data is through graphic visualizations. That’s why Oracle Analytics Cloud (OAC) provides numerous ways to visualize your data, right out of the box. It’s also why Oracle has made it possible to extend your OAC data visualizations into your Oracle Visual Builder applications to facilitate easier sharing without compromising security. And in this blog entry, I am going to show you how to do just that.
Extending the power of data visualizations
Any time you can visualize your data, you make it instantly easier for the end user to process and put into a context that can be quickly understood and acted upon.
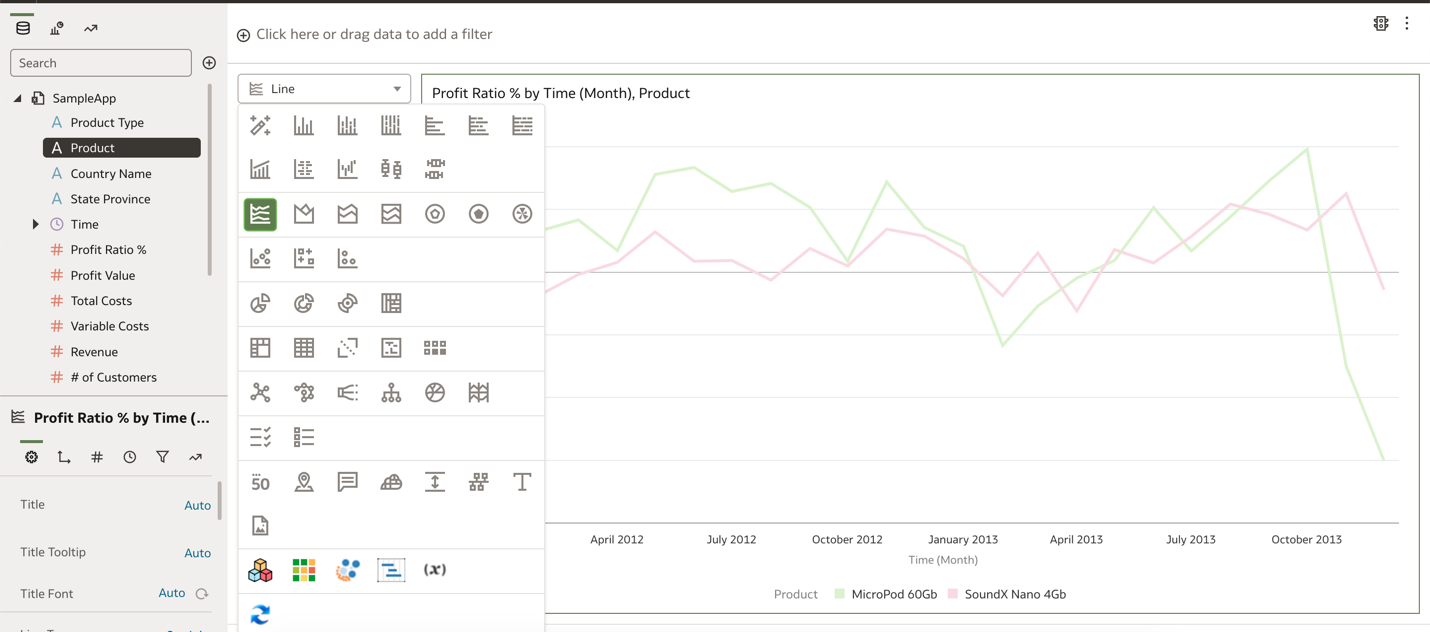

Figure1: OAC DV Types
OAC workbooks can comprise multiple visualizations created using the self-service capabilities of OAC on one or more canvases. OAC simplifies visual data creation by enabling you to connect to multiple data sources across your network. Data pulled into OAC can then be blended with other datasets for data modeling and scrubbing or used as is for creating different visualizations. Then, you can govern your workbooks by restricting or providing access to specific users
OAC and Visual Builder — Better together
Oracle Visual Builder is both a Platform as a Service (PaaS) and a hosted environment for application development. Visual Builder enables you to develop both web and mobile applications with easy-to-use drag-and-drop features, both simplifying and speeding up the development process. Together, these enable you to quickly build powerful reports that can be shared broadly and securely with your teammates.
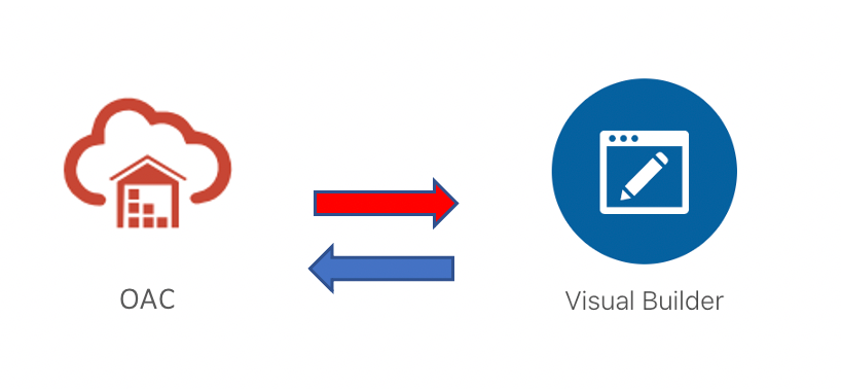
Figure 2: OAC and VB, Better Together
Oracle Cloud Infrastructure (OCI) makes it easy to mix and match technologies based on your specific needs. You can quickly create a Visual Builder application and an OAC Workbook and integrate the two to take advantage of both platforms. Once the Visual Builder app and OAC workbook are up and running, they will need to be registered in your “Safe Domains” (in OAC) and in “Allowed Origins” (in Visual Builder) to permit communication with external Services.
How to embed your OAC data visualizations in your Visual Builder applications
Follow these simple steps to embed your OAC data visualizations into your Visual Builder applications:
In OAC, “Safe Domains” can be accessed under “Console.” Add your new domain by clicking “add domain,” entering the host URL, and checking the “Embedding” column for your new entry.
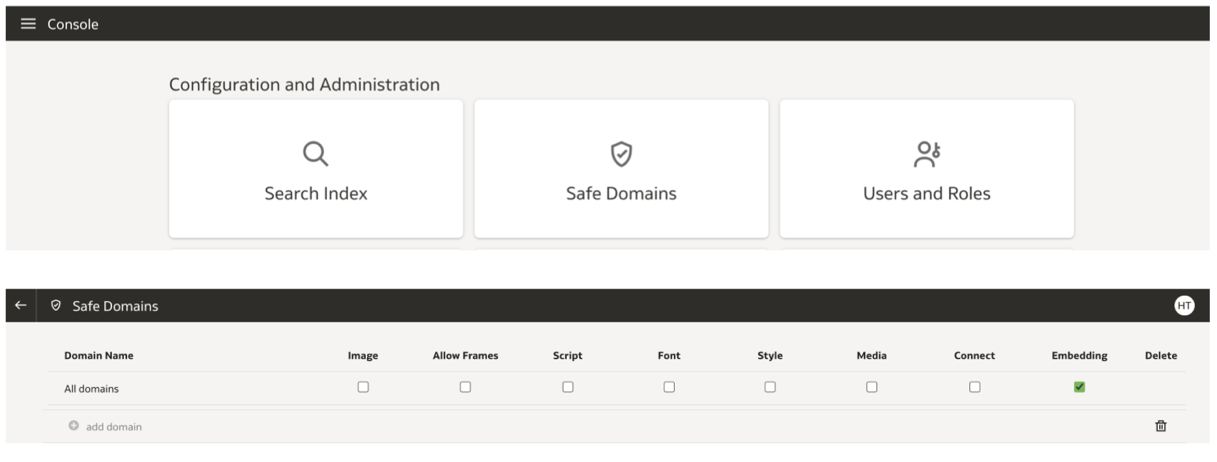
Figure 3: OAC – Safe Domain
Learn more about Safe Domains here: Register Safe Domains – Analytics Cloud
In Visual Builder, under settings, click on “+New Origin” and add the host URL under Origin Address.
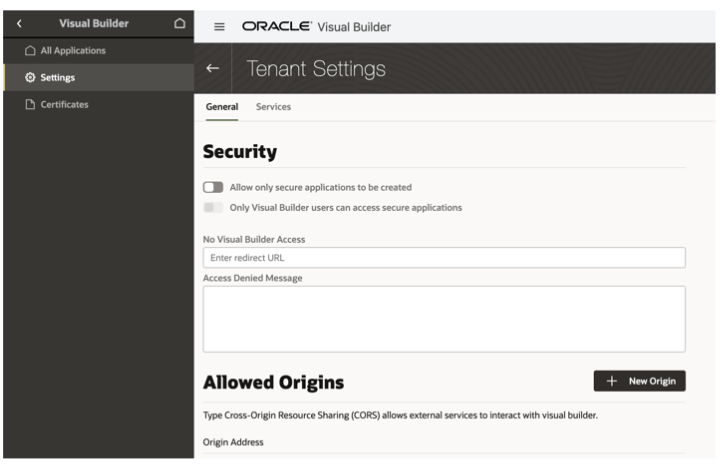
Figure 4: VB Allowed Origins
Once these settings are configured, OAC and Visual Builder are ready to share the content between them.
Learn more about Configuring Oracle Visual Builder here: Administrative Tasks – Visual Builder
OAC Configuration
- Create an OAC workbook with Oracle Data Visualization content that you want to embed.
- Go to the “Developer” option.
- Click on “Embed” — be sure to make note of the source URL, as you are going to use this information as the host in your Visual Builder app.
- Go to “Canvas” under “Embed” and make a note of the project-path “/@Catalog to <end of path name>” (there should be no need to edit this, even if there are spaces in the path name).
- Make a note of the “tab-id”
- Save the workbook under an OAC shared folder.
Visual Builder Configuration
- To add OAC content in your Visual Builder applications, look for “Oracle Analytics Project” under components and install it.
- Create a web application.
- Add a Flex Container, and then drag and drop OAC from the feature list.
- Provide your host, project path, and tab information (from 2a, 2b, and 2c of the OAC Configuration process).
- Add the OAC host entry in “Allowed origins” (from 2a of the OAC configuration process) under “Settings” on the left-side hamburger menu.
- Make sure to register the Safe Domain using the host details of the Visual Builder application created above, in OAC.
- You’re all set!
Adding security
Now that communication between OAC and Visual Builder has been established, you should revisit your security settings to customize access for your intended workgroup. Oracle Cloud Infrastructure employs a “security first” approach. This strengthens the security posture of your web applications and reduces risk by providing built-in security controls, automating security to reduce complexity and prevent human error, and providing automated patching, always-on encryption, and continuous monitoring through Cloud Access Security Broker (CASB) technology.
Using groups and policies assigned to different services can restrict unwanted users from gaining access to your applications. By providing appropriate access, you can give your team members and external users access to embedded OAC workbooks for safer collaboration.
Further readings-
- Embedding Oracle Analytics — What are the Options? | by Mike Durran
- Visual Builder Office Hours — Building Analytic Applications Webcast – Oracle Developers – Medium
- Visual Builder Component for Embedding Oracle Analytics — Part 1
- Oracle Analytics Cloud (OAC) Embedding— Public User Access — Part 1 | by Mike Durran | Medium
Schedule a meeting today to talk to the Oracle Analytics product team and learn more about how you can provide powerful data visualizations to your team using Oracle Analytics Cloud.