This blog is part of a series of “best practice” blogs for Oracle Analytics.
Query Logging is powerful diagnostic information available to the Admin users to analyze and troubleshoot issues related to query performance, error scenario and wrong results. On an Analytics instance when query logging is enabled – the information about parsing, optimization, execution plans, physical query, summary stats etc., are written into the query log by the Analytics Server. Log is written serially in the same order of execution of queries across the system. Each session and request is identified by a unique id. Query log can be retrieved from Administration/Manage Sessions in Answers or from Console/Session within DV.
Another optional feature “Developer tool” is available for logging of visualizations in a DV. This has been explained under section “Getting logs for DV queries”
Query Log Level
- Detail and amount of log generated depends on the LOGLEVEL set at system, session or report level
- Log level can be defined in the RPD globally under Tools/Option/Repository/System logging level OR by using session variable in the RPD.
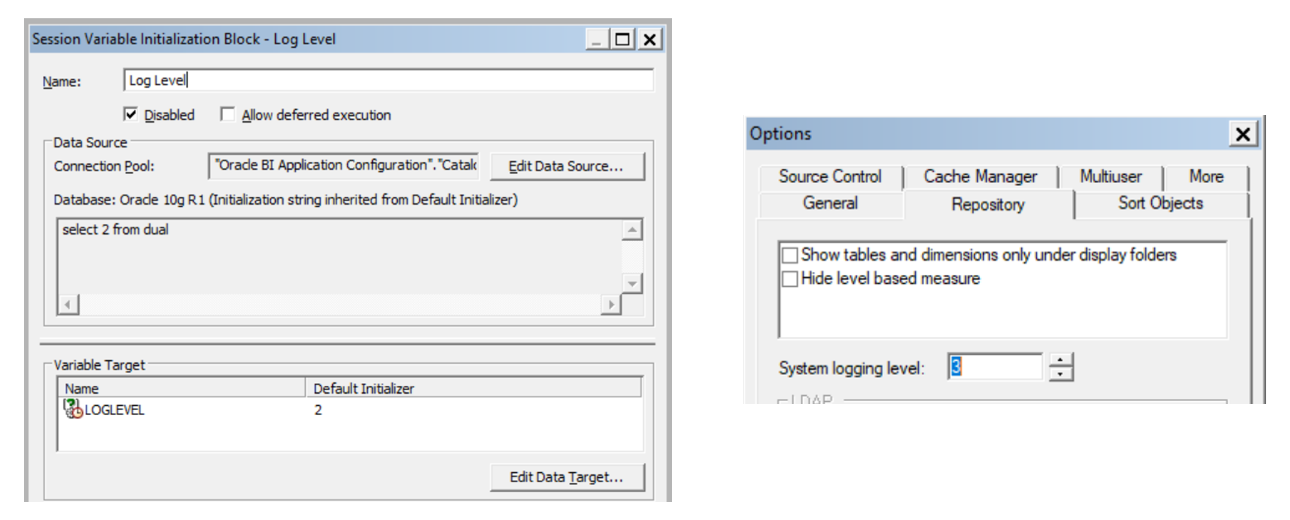
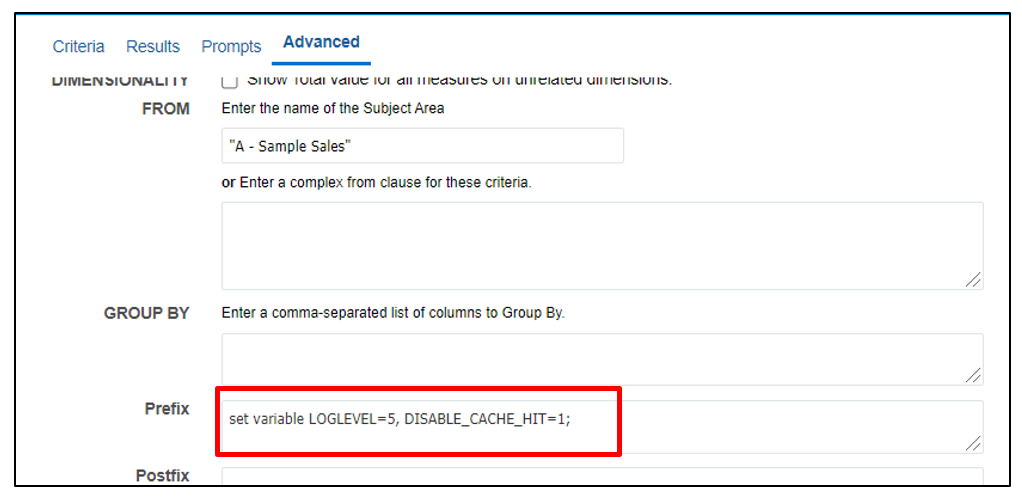
- This can also be overridden at report level by adding the LOGLEVEL variable in prefix section of the “Advanced” tab in reports
- You may need to use variable DISABLE_CACHE_HIT=1 along with LOGLEVEL to make sure you get complete logs by avoiding cache hit
LOGLEVEL value ranges between 0-7. 0 values means logging disabled and LOGLEVEL 7 is the highest level which is mainly for use by the Oracle development team. LOGLEVEL 2 is enough for performance tunic and basic understanding. LOGLEVEL 3 must be used to troubleshoot row-level data security filters.
Based on the log level selected the query logs contain information on the execution of query including the logical request, navigation and execution plan, physical query generated, execution time, rows/bytes retrieved at different execution nodes and also the caching related information.
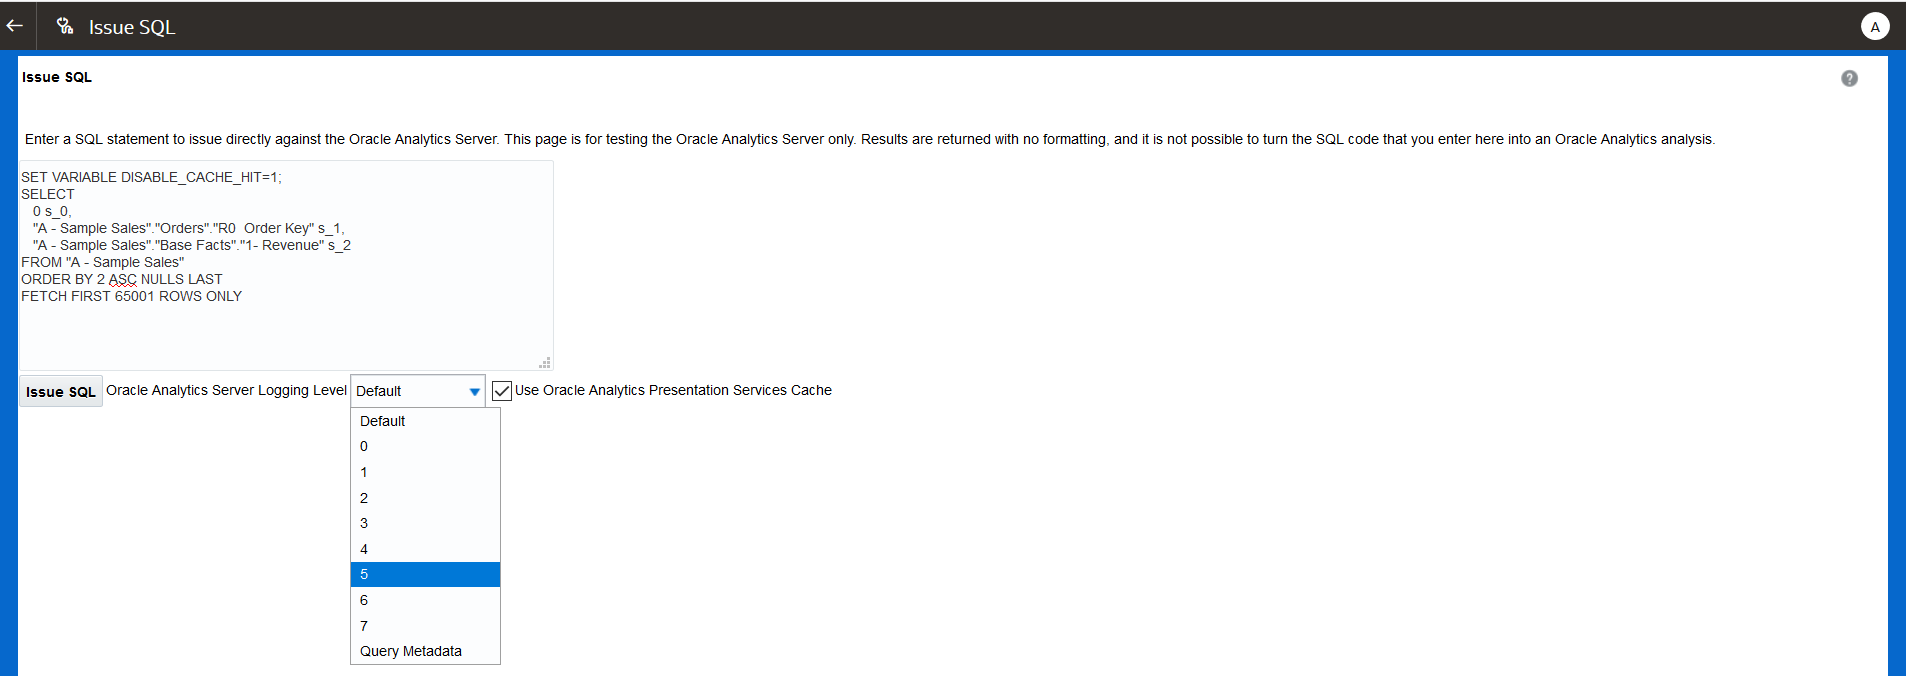
Admin users can also extract the logs from Console->Issue SQL by running the needed query with appropriate LOGLEVEL and variables settings.
Reading Query Log
Manage Sessions contains list of all the queries and sessions that are currently active. You can get to this page either thru Answers->Administration->Manage Sessions OR Console->Sessions in DV.
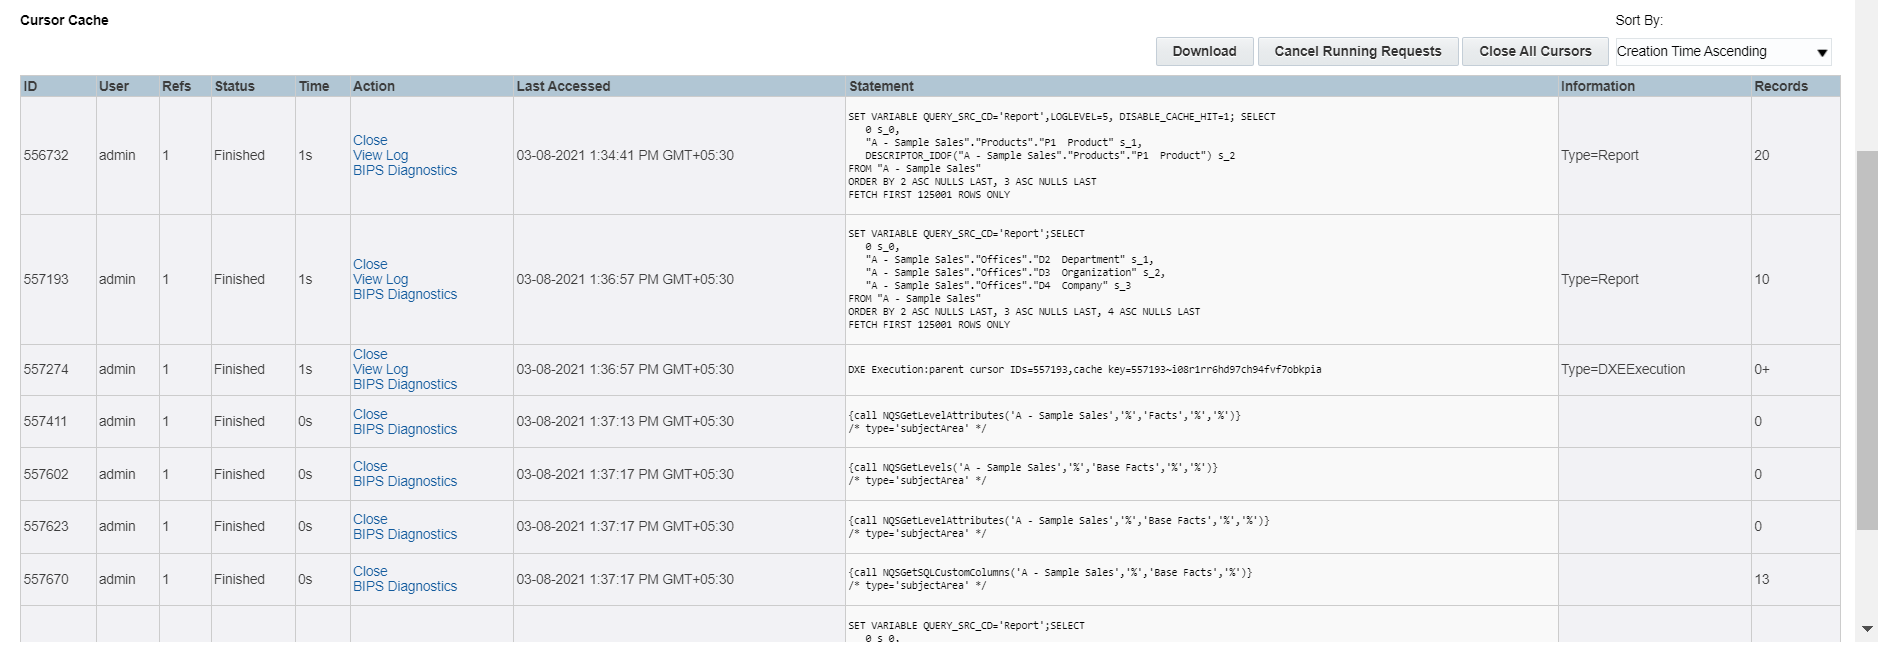
Each individual entry above would have complete logs related to one particular query as per the level set at RPD/session/report level.
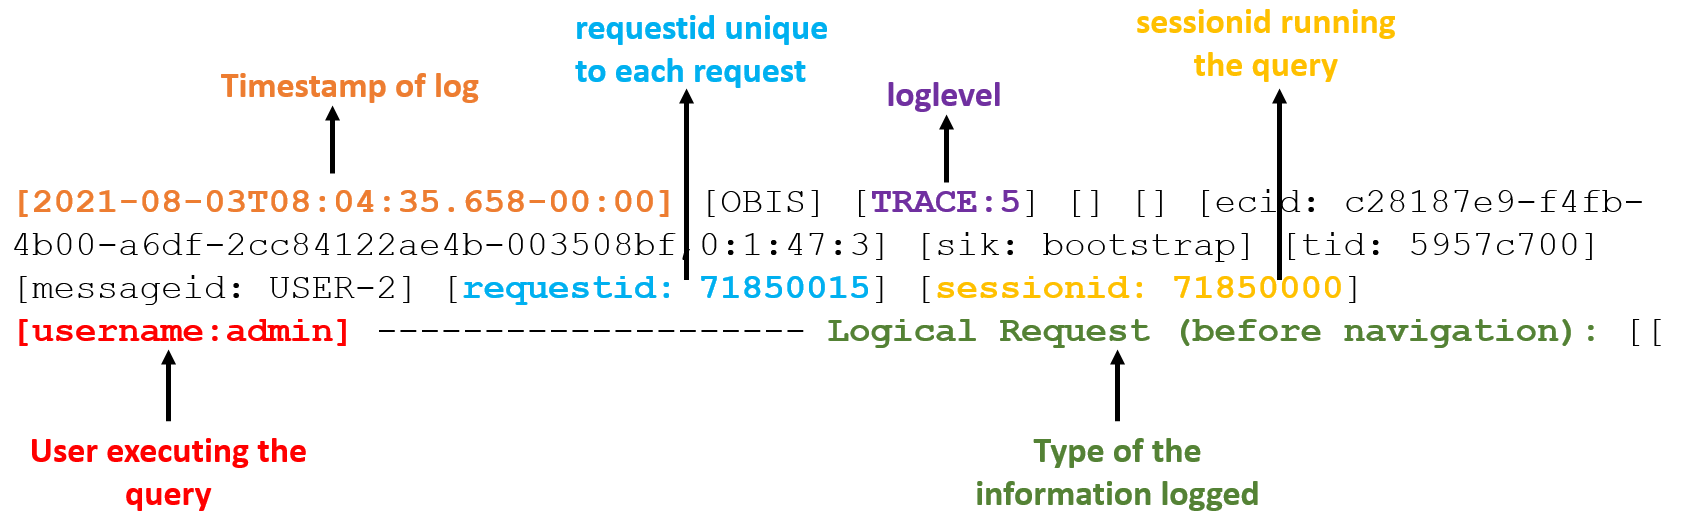
Every request is identified by a unique requestid across the Analytics Server
Logical SQL Query
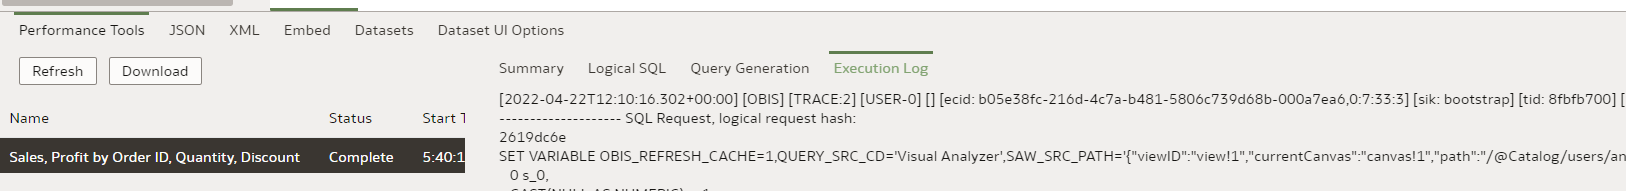
Here is a sample query that is sent to the BI Engine for execution.
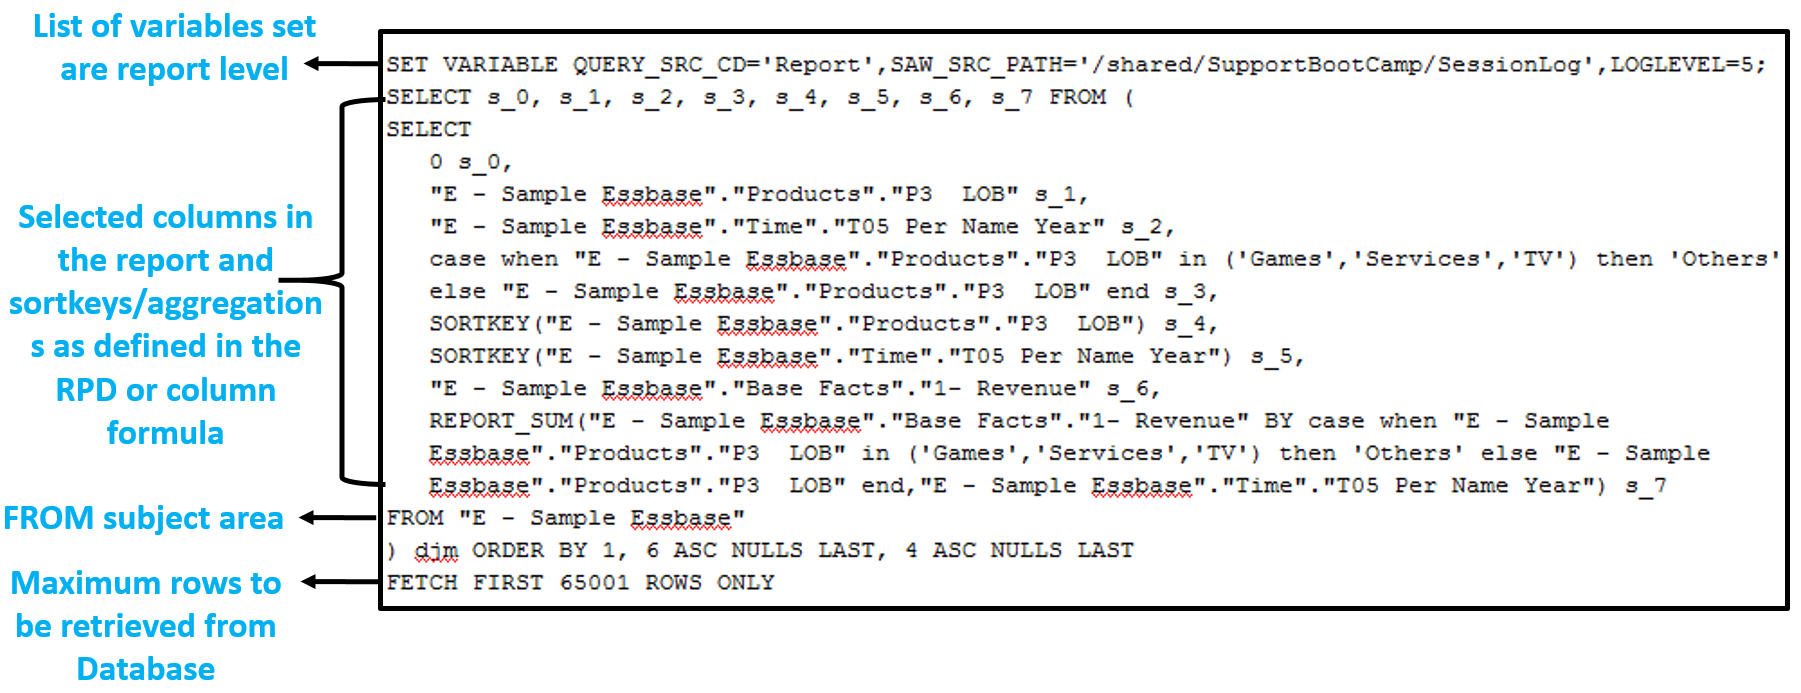
Some common variable we come across in a logical request are:
-
- QUERY_SRC_CD: query’s origin, Prompt, Report, DV, Issue SQL…
- SAW_SRC_PATH: the catalog path to the query if it is saved
- SAW_DASHBOARD: the catalog path to the dashboard that has included this query
- SAW_DASHBOARD_PG: Name of the dashboard page
Logical Request
Logical Request is translation of query from Presentation layer to the Business Model and Mapping (BMM) layer mapping after adding security filters if any.
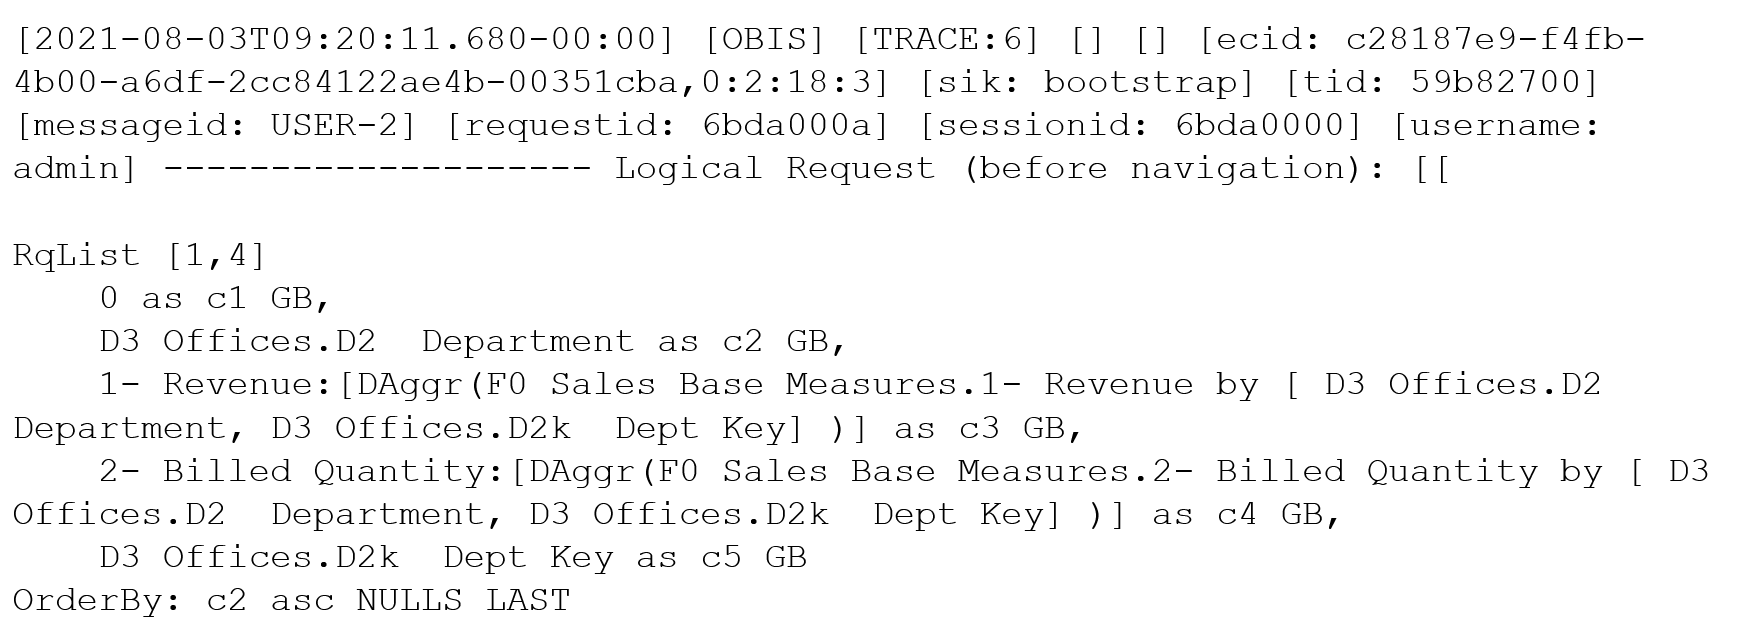
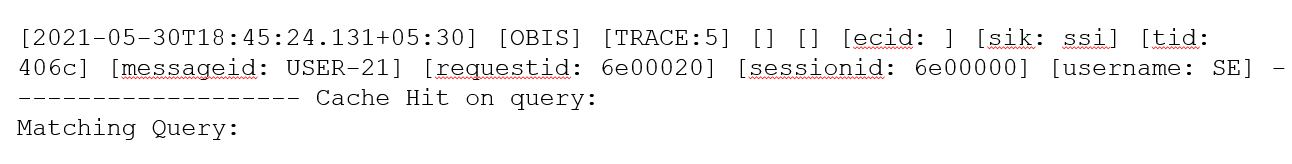
Based on the logical request generated OBIS decides whether the plan hits an existing cache or needs retrieval from the database. The below log indicates the same.
Execution Plan
Execution plan is the transformation of actual logical request into optimized plan for execution. This indicates shipping plan for each operation whether it is performed at db level OR at OBIS level “database 0.0.0” indicates execution by OBIS.
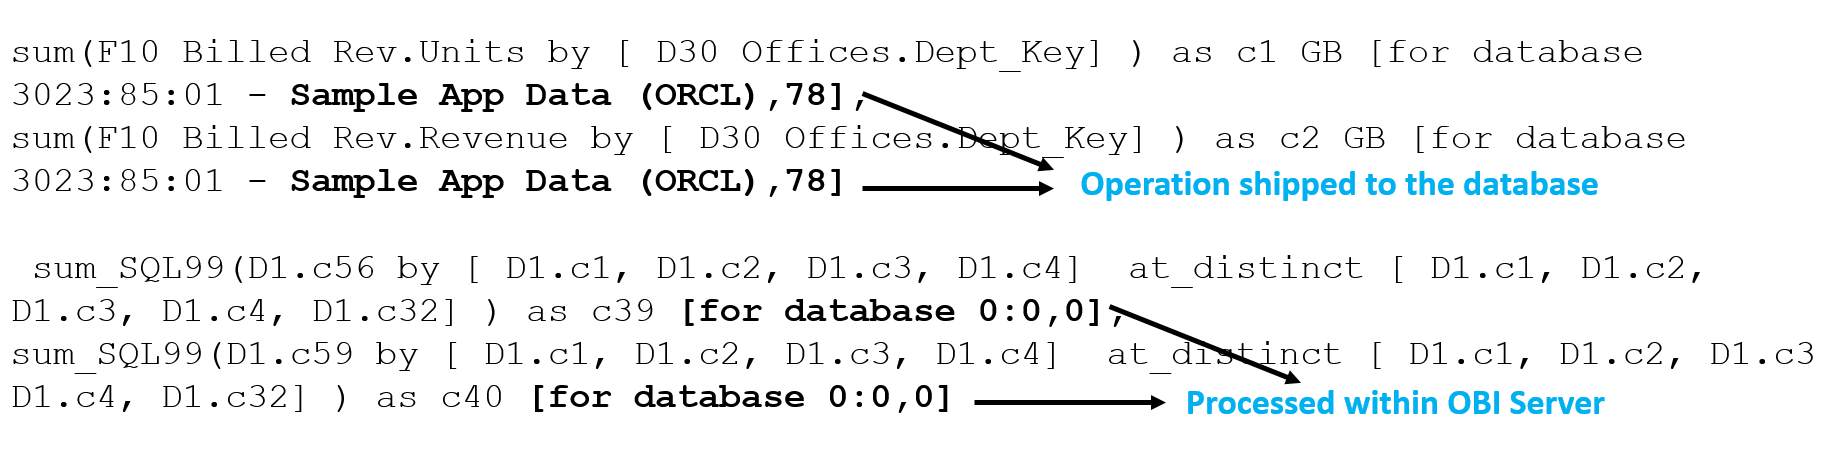
During execution of query the OBI server exactly traverse thru this tree. When log is detailed, we get the information on rows processed at every node of the execution tree.
Physical or Database Requests
Based on the execution OBIS generates physical SQLS to be executed on the specified database. There could be one or more requests sent to one or more databases.
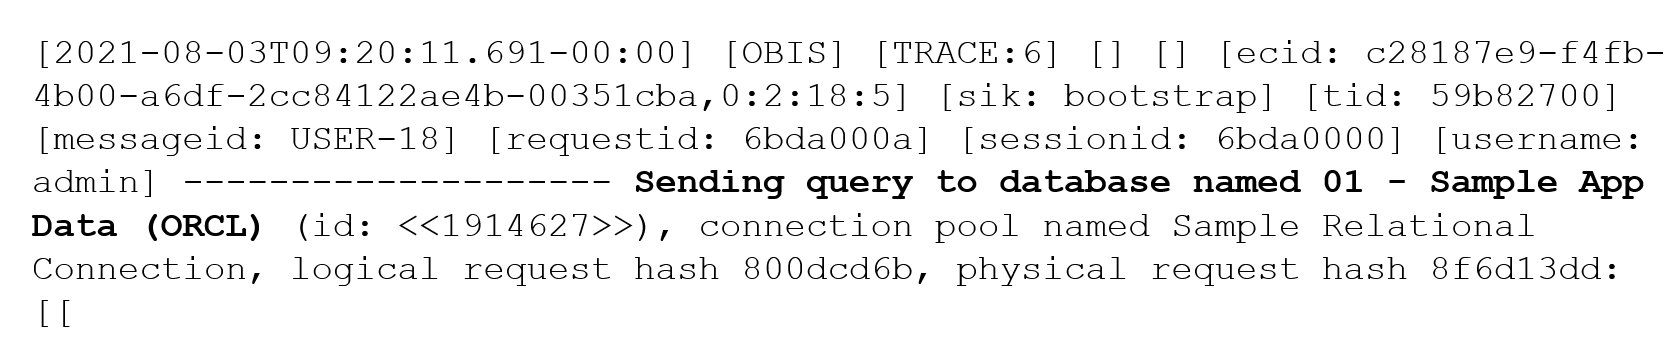
For every physical request sent to the database there is a log of number of rows and bytes retrieve

When there are multiple queries use the “Query id <<1914627>>” here to match the exact query in “Sending query to the database” log. With this we can map query vs rows retrieved when there are multiple db requests.
One report could send multiple queries to one or more databases depending on the report structure and the RPD definition. The below log shows 3 queries were sent to the database:

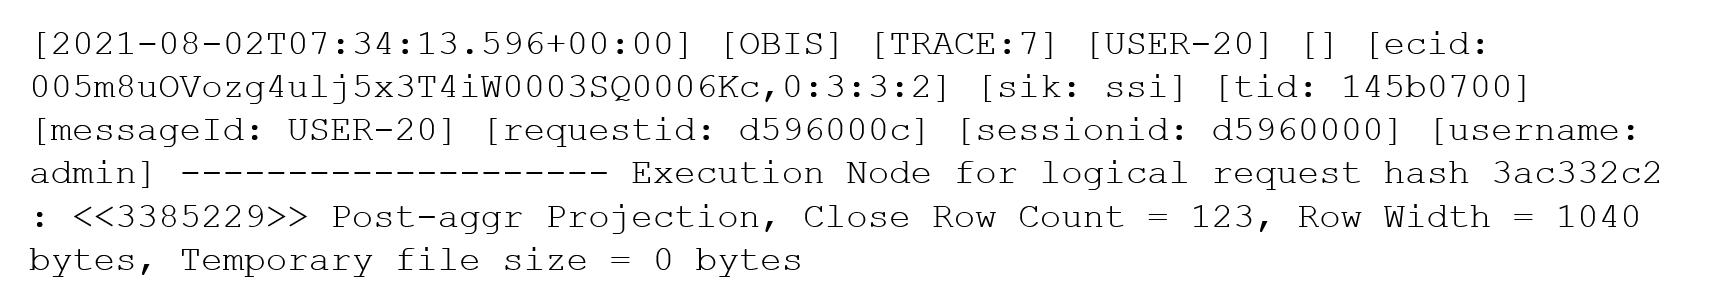
We would have similar rows processed information for all the relevant nodes in execution plan. Finally, the rows sent to the client is logged as:

Below is the final summary of statistics that will include the complete execution time information. We can correlate the time here to analyze and investigate performance issues.

Summary Stats
Meaning of different execution timings that is represented by query summary stats
- Elapsed time – measures the total elapsed time from when the logical query is received until the client closes the cursor. If the client allows the user to scroll through the result as OBIPS does, then the cursor may stay open for a long time until the user either navigates to another page or logs out.
- Compilation time – includes the time that the BI Server uses to generate the execution plan and physical queries from the logical SQL query.
- Total time in BI Server – measures the total amount of time that the client is waiting for the BI Server for a response. It includes physical query execution time, wait time during fetching, and time spent in the BI Server for internal execution.
- Execution time – measures the time from when the logical query is received by the BI Server until the logical query execution completes. But it does not include any time spent after the logical query execution is complete when the client is fetching results.
- Response time – measures the time from when the logical query is received by the BI Server until the first row is returned to the client.
Cautions about the Query Log
- Single threaded activity. Under adverse circumstances, can be a performance bottle neck at levels >2.
- Times listed/computed are when entries are written to the log, which is almost always when they occur. See above. Or there are other bottlenecks impacting logging.
- Query logging is diagnostic, not intended for collecting usage information. Use the Usage Tracking feature for that purpose.
Getting logs for DV queries
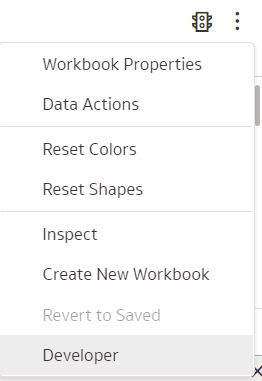
Earlier only the users with Administration privilege could access logs either thru Manage Sessions or Console->Session Logs. Now, getting logs from Data Visualization has been made very convenient with the introduction of “Developer Tool” for troubleshooting query performance in DV. This is an optional feature which could be enabled OR disabled in the DV User’s profile . If you do not find the “Developer” option in the Workbook menu, make sure to enable the “Developer Options” in your profile under the “Advanced” tab, as shown below.

Once enabled, Developer tool is accessible from the workbook menu.
With this utility the users can get and analyze various logs on the fly for any visualization on a canvas. When you open the developer tool a separate frame appears below the canvas that has different tabs for each type of information. The logs are not populated by default and also not refreshed by default when the visualization is run.
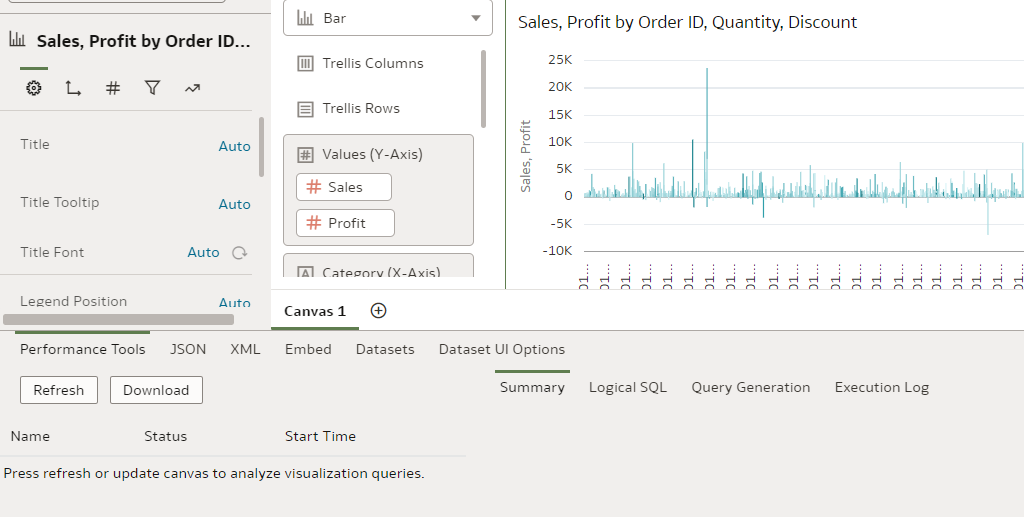
You need to highlight or select the visualization you want to analyze and click on the “Refresh” option to generate the logs. Once refreshed various information related to the visualization are populated. Note here that we can analyze the logs for only one specific visualization. If you need to analyze multile visualizations you need to refresh them individually and analyze one after the other.
There are various perspects you could analyze like Performance logs, JSON, XML and also the Dataset related information. Thus giving individual users ability to analyze the logs locally without the need to have access to Session logs. Note, this tool is an explicit feature available in Data Visualization – Classic Reports still have to go thru the conventional Manage Sessions route to get the logs.