Business Case
A popular question from Oracle Fusion Data Intelligence (FDI) customers is “How do I analyze incremental data loaded via pipelines?”. This article presents a potential solution that customers can use for analytics use cases such as Top N / Bottom N warehouse house tables by data load, warehouse sizing, data volume growth analytics, and many more.
The Approach
 This article reuses many of the steps from the article, FDI: Generating ADW heatmaps, to enable users to benefit from information on multiple utilities with minimal development. The table you create for a heatmap is further processed to compute the incremental record counts by comparing current and previous snapshots of each table.
1. Create a table
Create a table where the heatmap related data resides. The structure can be based on the script provided:
CREATE TABLE daily_load_heatmap_dtls (
    table_name        VARCHAR2(2000),
    total_row_count   INTEGER,
    incremental_count INTEGER,
    insert_date       DATE,
    update_date DATE
);
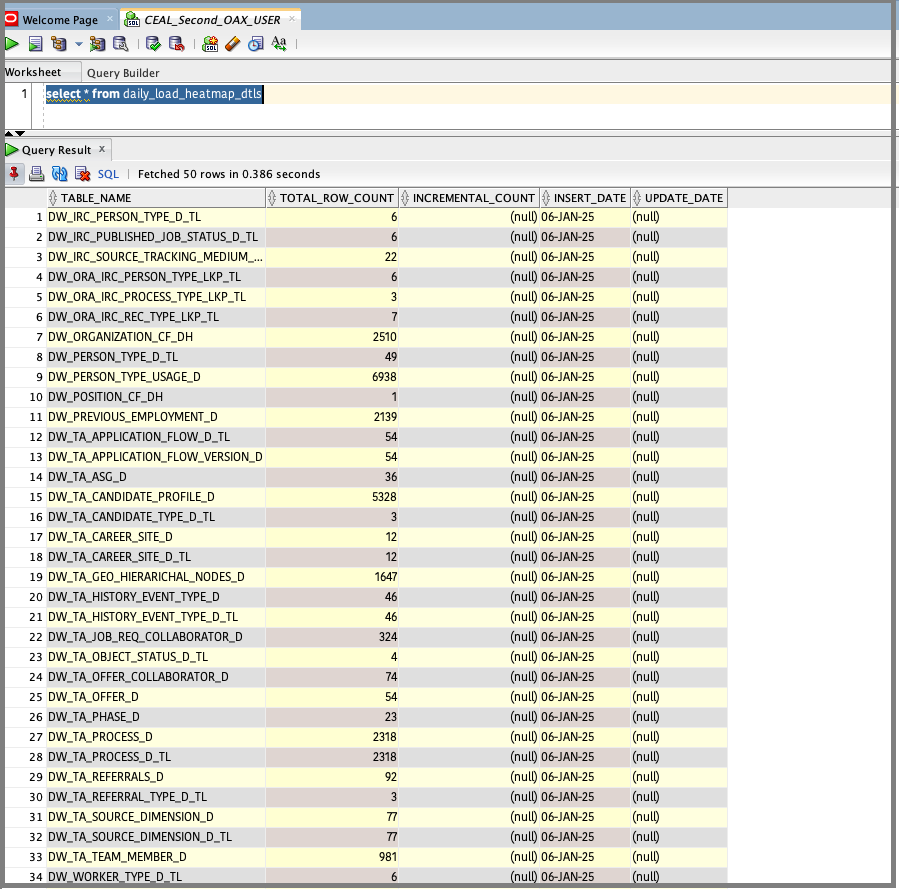
Execute the script in SQL Developer.
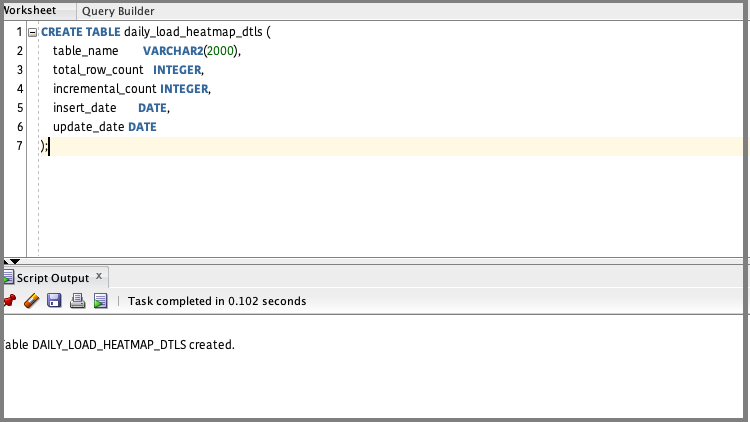
The table will contain total row count, as well incrementals.
2. Create a record count function and a procedure to generate the heatmap
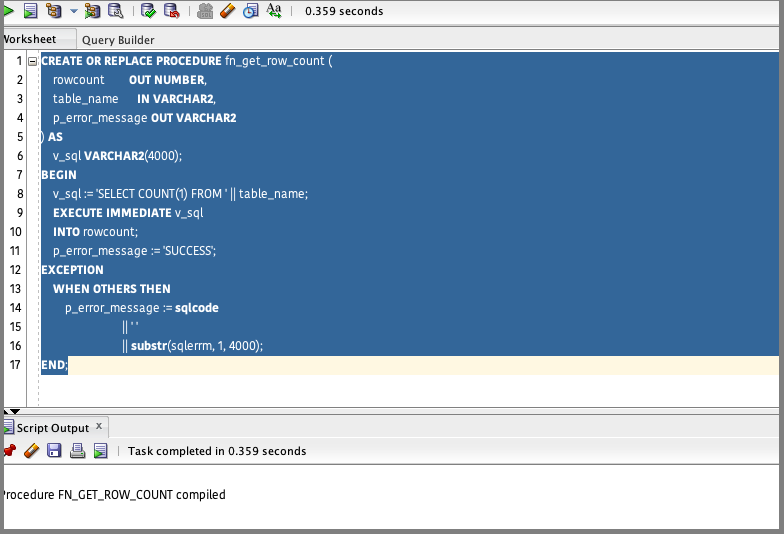
The following script uses the table name as the input and provides record count as output. Since this procedure is automated, ensure that the basic exception handling is incorporated.
CREATE OR REPLACE PROCEDURE fn_get_row_count (
    rowcount        OUT NUMBER,
    table_name      IN VARCHAR2,
    p_error_message OUT VARCHAR2
) AS
    v_sql VARCHAR2(4000);
BEGIN
    v_sql := 'SELECT COUNT(1) FROM ' || table_name;
    EXECUTE IMMEDIATE v_sql
    INTO rowcount;
    p_error_message := 'SUCCESS';
EXCEPTION
    WHEN OTHERS THEN
        p_error_message := sqlcode
                           || ' '
                           || substr(sqlerrm, 1, 4000);
END;
Compile the procedure in OAX_USER or a database user with equivalent access.
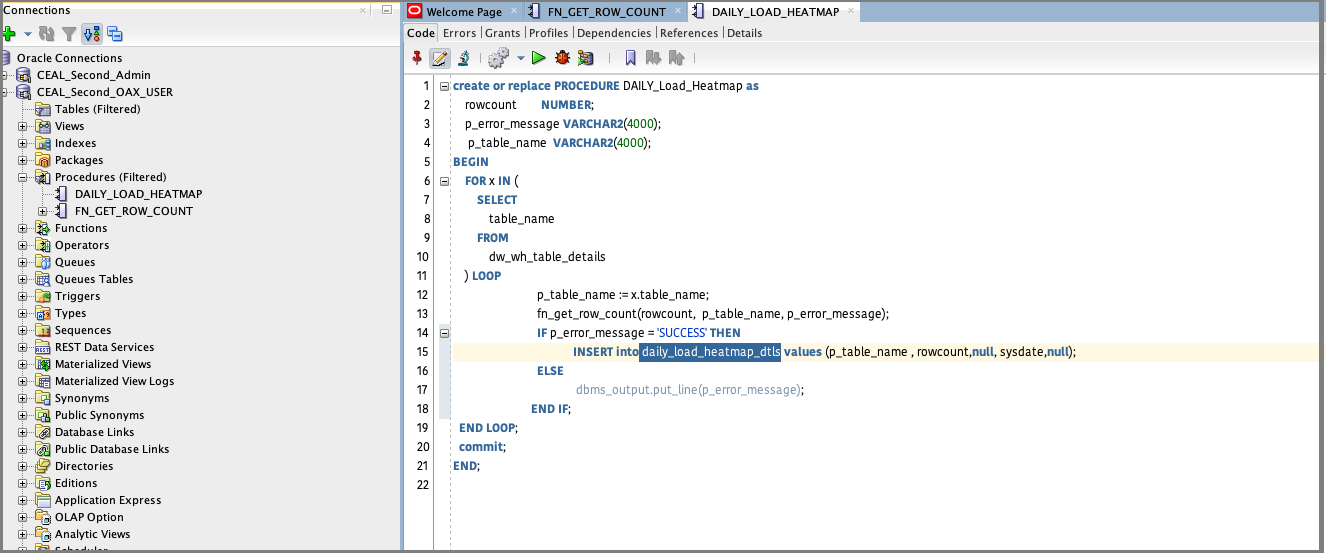
Create another procedure that populates the heatmap table with data from a procedure call for the record counts per table. Use this sample code:
Create or replace PROCEDURE DAILY_Load_Heatmap as
    rowcount        NUMBER;
    p_error_message VARCHAR2(4000);
     p_table_name  VARCHAR2(4000);
BEGIN
    FOR x IN (
        SELECT
            table_name
        FROM
            dw_wh_table_details
    ) LOOP
                            p_table_name := x.table_name;
                            fn_get_row_count(rowcount,  p_table_name, p_error_message);
                            IF p_error_message = 'SUCCESS' THEN
                                        INSERT into daily_load_heatmap_dtls values (p_table_name , rowcount,null, sysdate,null);
                            ELSE
                                         dbms_output.put_line(p_table_name||' '||p_error_message);
                          END IF;
  END LOOP;
  commit;
END;
Compile the procedure in OAX_USER or database user with equivalent access.
3. Populate the heatmap table
Execute the procedure that you just created.
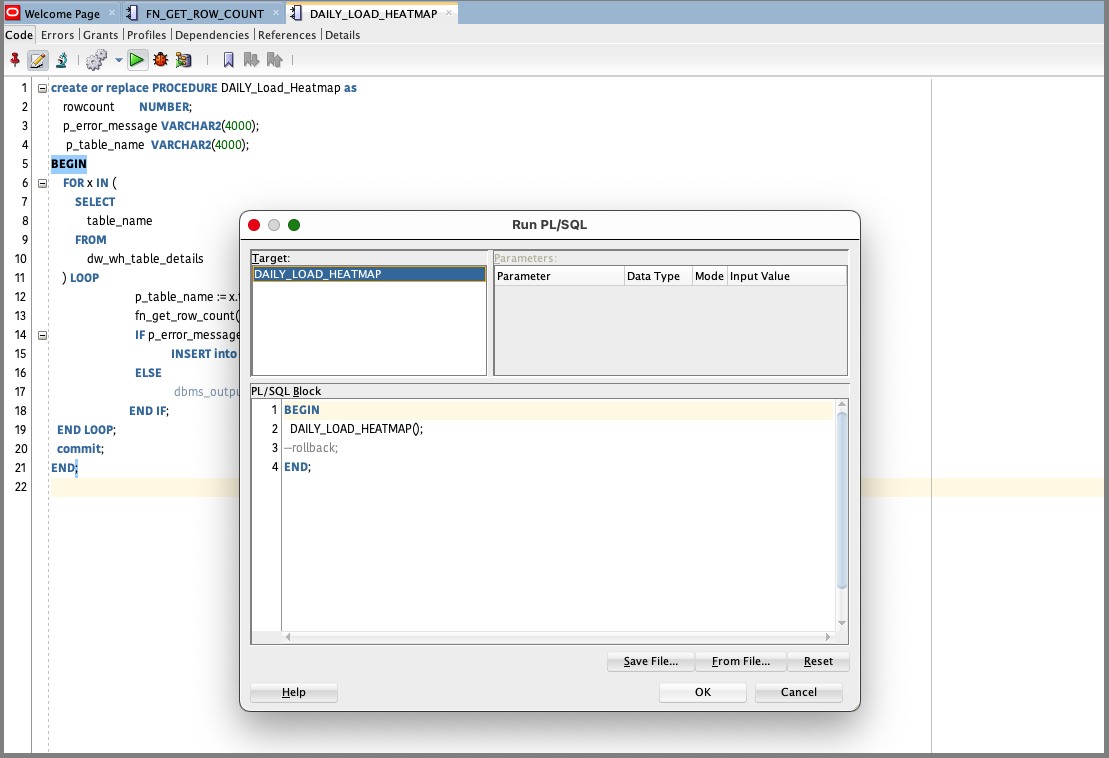
Validate the data loaded in the heatmap table.
4. Computing the incremental counts
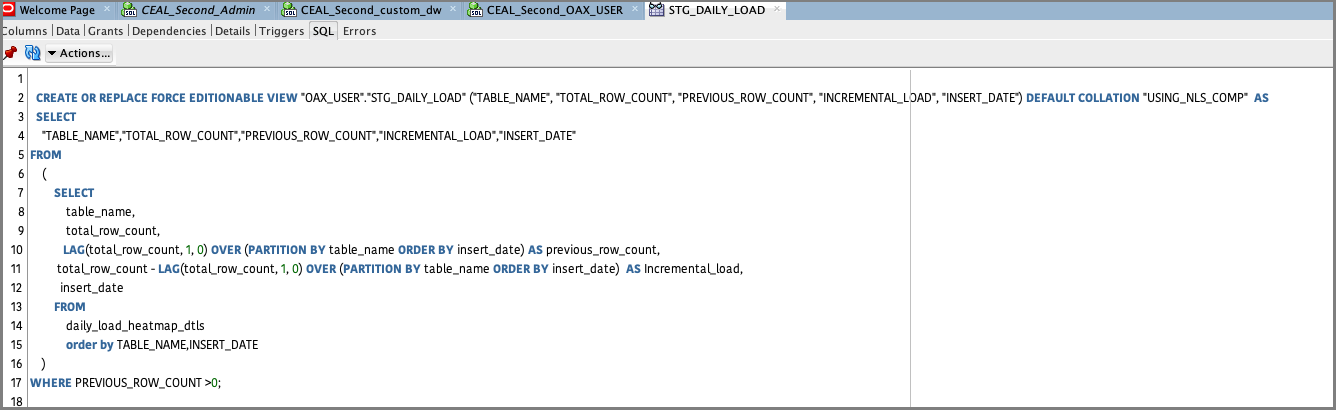
The query below compares previous and current snaphots (identified by Insert_date) for each table and computes incremental counts by the difference of the row counts.The end result is populated in the INCREMENTAL_LOAD attribute. If there is no incremental data, the attribute value poplulated is null.
SELECT
    "TABLE_NAME","TOTAL_ROW_COUNT","PREVIOUS_ROW_COUNT","INCREMENTAL_LOAD","INSERT_DATE"
FROM
    (
        SELECT
            table_name,
            total_row_count,
           LAG(total_row_count, 1, 0) OVER (PARTITION BY table_name ORDER BY insert_date) AS previous_row_count,
         total_row_count - LAG(total_row_count, 1, 0) OVER (PARTITION BY table_name ORDER BY insert_date)  AS Incremental_load,
          insert_date
        FROM
            daily_load_heatmap_dtls
            order by TABLE_NAME,INSERT_DATE
    )
WHERE PREVIOUS_ROW_COUNT >0;
You can create a view using the above query so that this is automatically scheduled at run time. If there are a large number of tables, for performance considerations, the view could be converted to a materialized view.
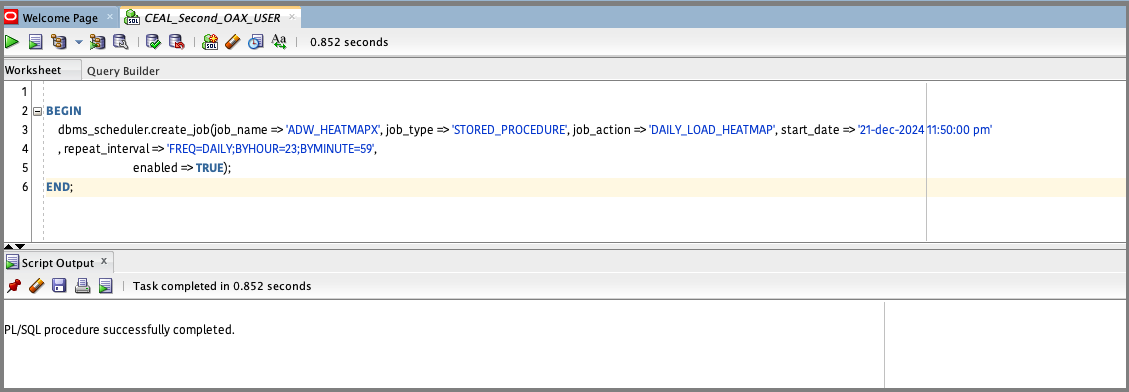
5. Schedule the job.
You can schedule the stored procedure that was created using the following scipt. In this case, the job is named ADW_INCREMENTAL and scheduled from 01-Feb-2025 to run daily at 23:50.
BEGIN
    dbms_scheduler.create_job(job_name => 'ADW_INCREMENTAL', job_type => 'STORED_PROCEDURE', job_action => 'ADW_INCREMENTAL', start_date => '01-feb-2025 11:50:00 pm'
    , repeat_interval => 'FREQ=DAILY;BYHOUR=23;BYMINUTE=59',
                             enabled => TRUE);
END;
Run the same stored procedure in SQL Developer.
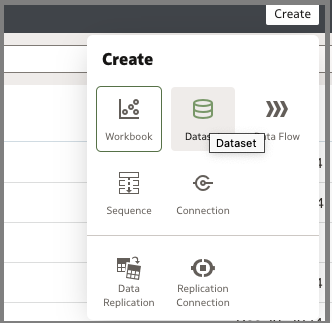
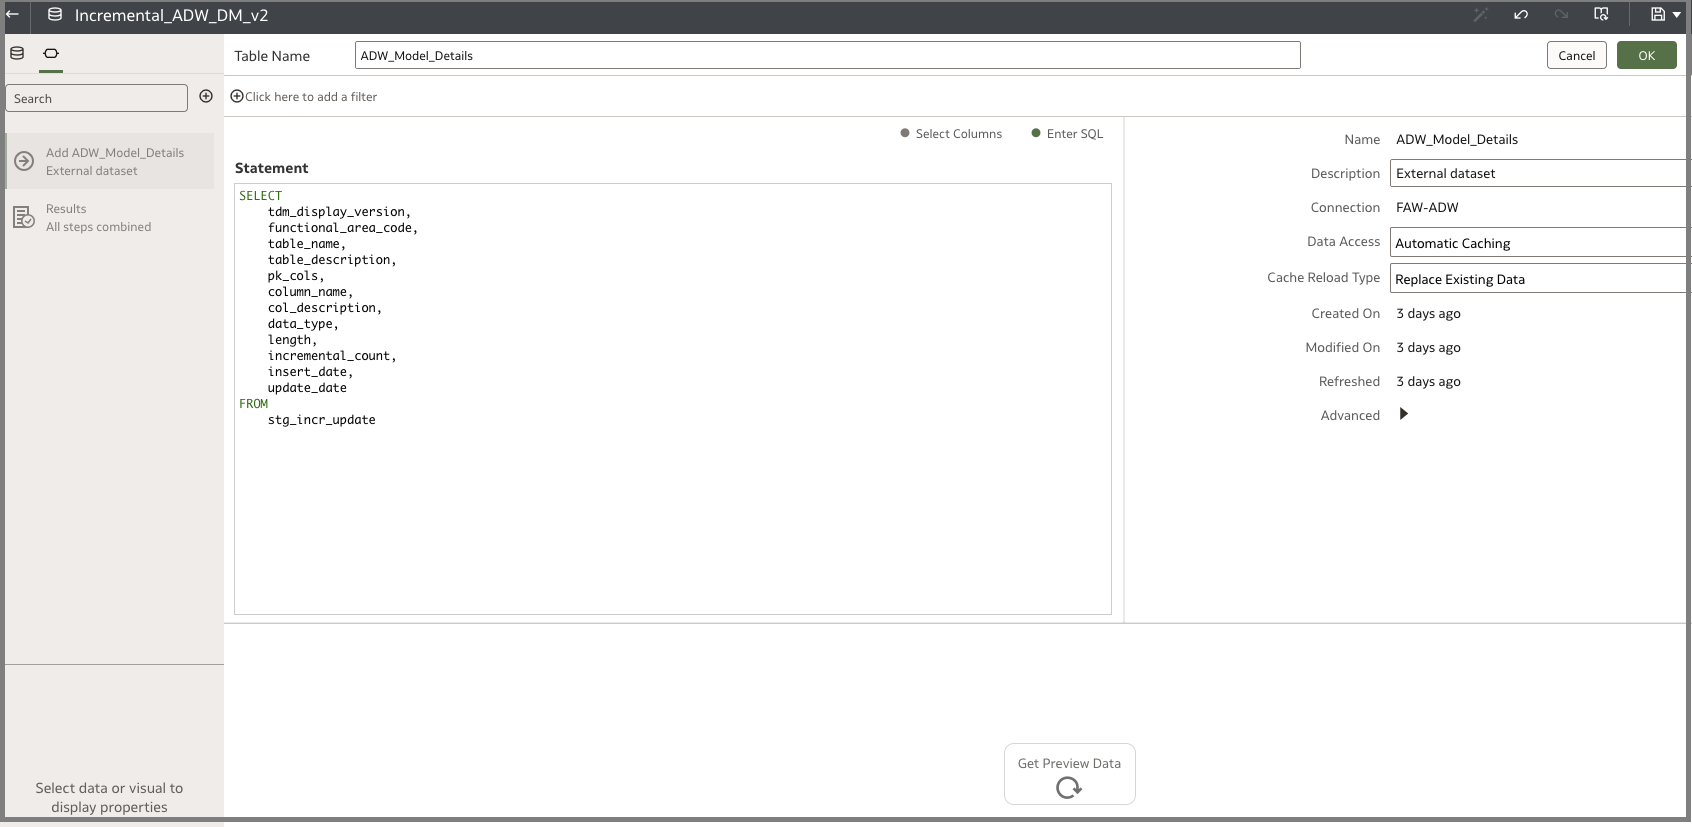
5. Create the dataset
Create an ADW OAC connection. After setting up the connection details, click Create, and then click Dataset.
The following is an indicative query and you can customize it as needed:
SELECT
    tdm_display_version,
    functional_area_code,
    table_name,
    table_description,
    pk_cols,
    column_name,
    col_description,
    data_type,
    length,
    incremental_count,
    insert_date,
    update_date
FROM
    stg_incr_update
Copy the following query to a new dataset:
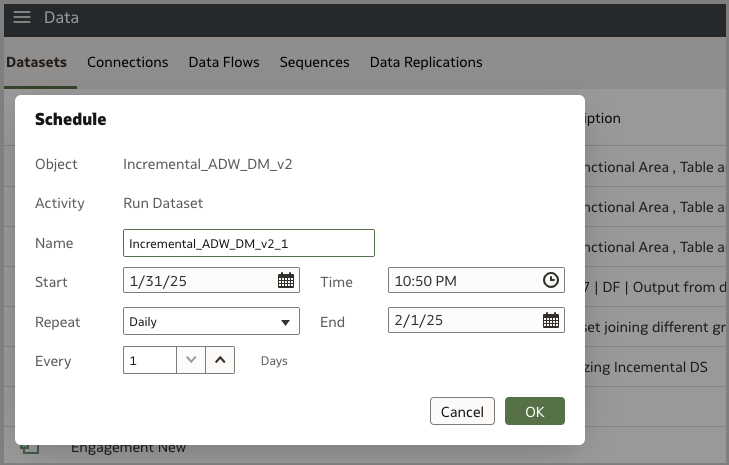
6. Schedule the dataset
In this example, the dataset is scheduled to start at a specific time and you must create this per the FDI load cycle. Monitor your daily incremental load timings and identify a time which is safely outside the zone of the load window for the schedule.
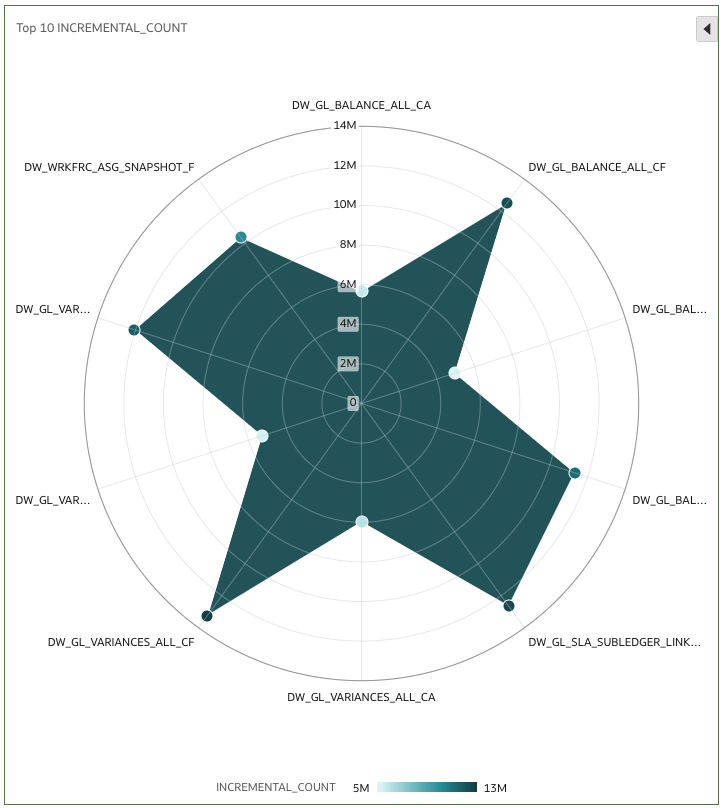
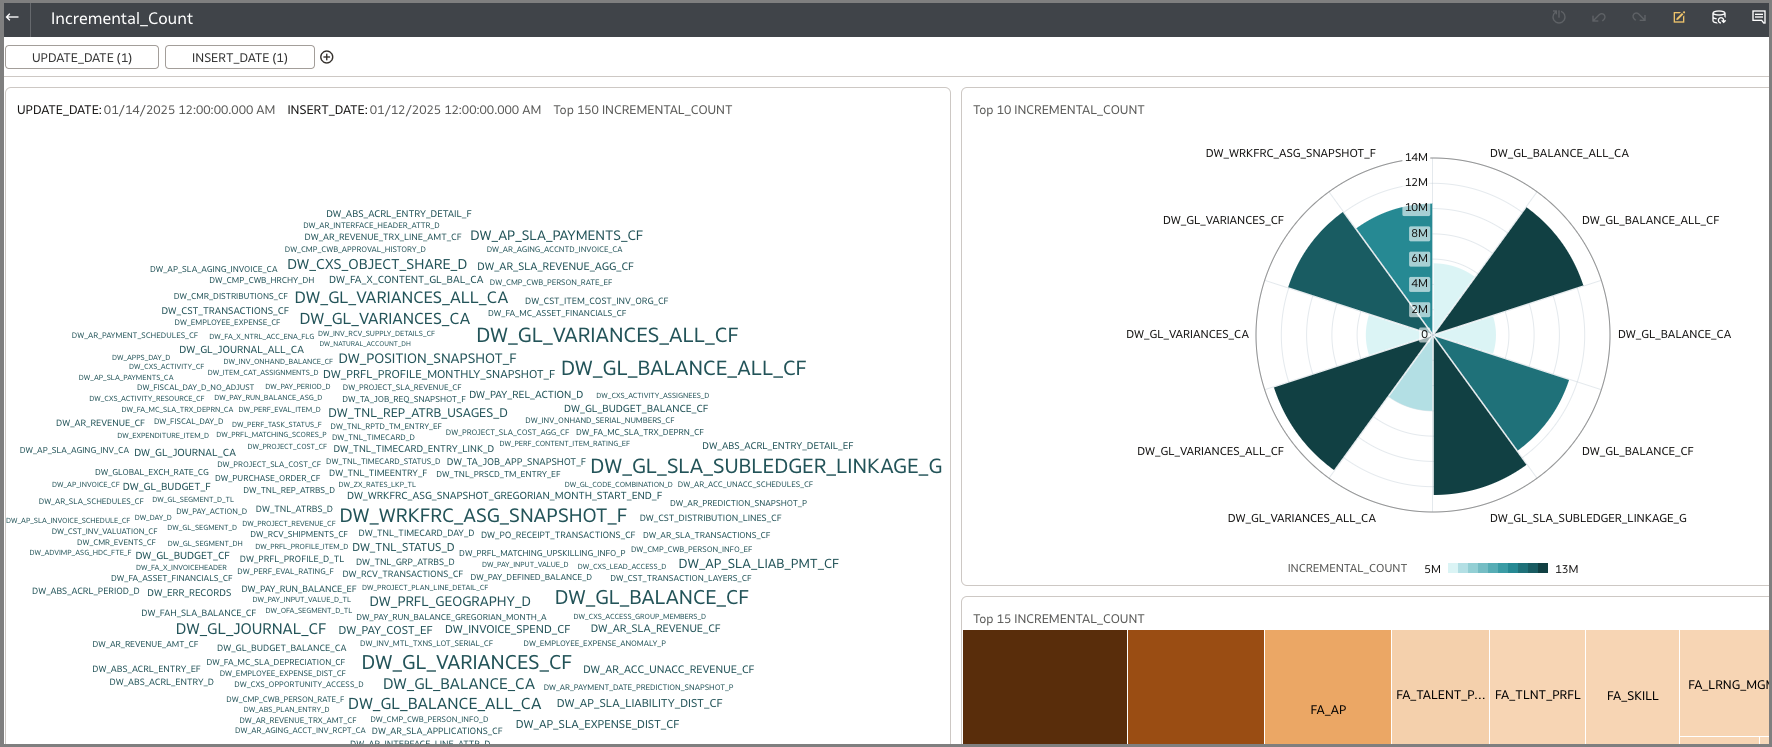
7. Create the canvas workbooks
You can create various workbooks as shown in these examples:
Call to Action
This article presents the steps to analyze incremental rowcounts on ADW tables residing in FDI. To learn more, view the product documentation, view additional Oracle Analytics articles at blogs.oracle.com/analytics, and follow us on Twitter@OracleAnalytics.