In today’s data-driven world, the ability to explore, visualize, and understand information is paramount. Oracle Analytics Cloud (OAC) offers a comprehensive platform for businesses to unlock the potential of their data. But what if you want to experience the power of OAC firsthand, without immediate commitments or complex setups? That’s where www.oracle.com/oacpublic comes into play – your gateway to a publicly accessible demonstration environment brimming with insightful dashboards and engaging visualizations.
Think of OAC Public as a playground where you can explore pre-built analytics projects highlighting the diverse capabilities of OAC. A great resource for anyone curious about data exploration, whether you’re a business user looking for inspiration, a data enthusiast wanting to see cutting-edge visualizations in action, or an IT professional evaluating analytics platforms.
What Can You Discover on Oracle Analytics Public?
Navigating to www.oracle.com/oacpublic opens a world of pre-configured analytics content across various industries and use cases. While the specific dashboards and datasets might evolve over time, you can generally expect to find a wide range of examples.
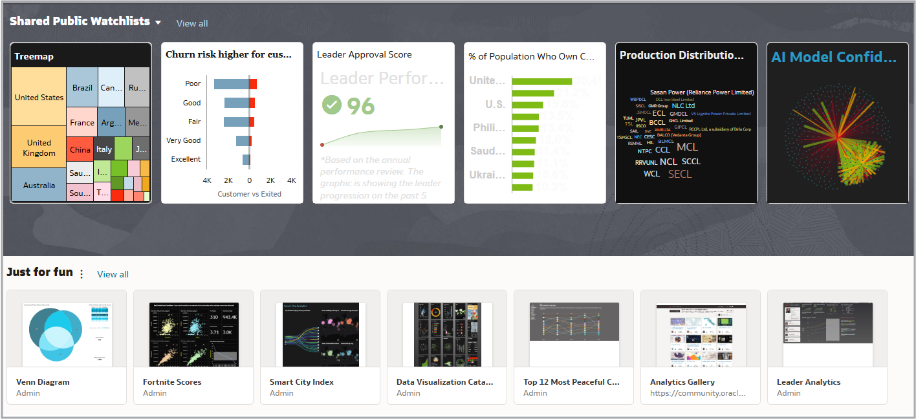
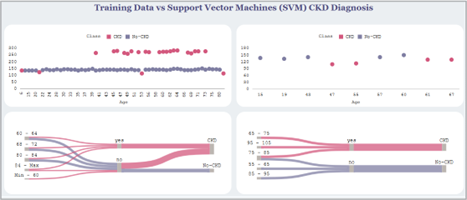
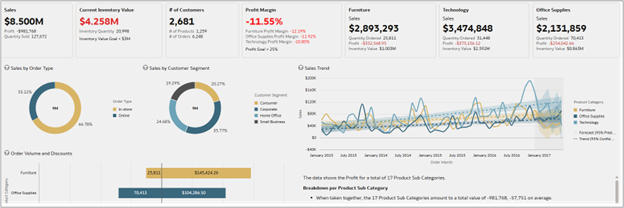
- Interactive Dashboards: Explore dynamic visualizations that allow you to drill down into data, filter information, and gain different perspectives with just a few clicks. See how interactive elements can empower users to answer their own questions.
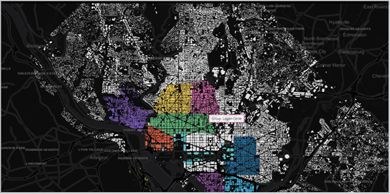
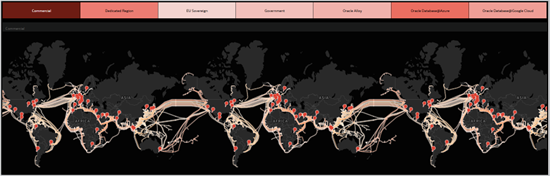
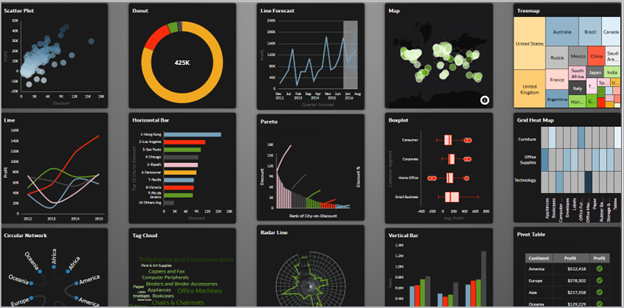
- Compelling Visualizations: Witness the power of diverse chart types, from classic bar and line charts to more advanced visualizations like treemaps, scatter plots, and geographical maps. Understand how the right visual can tell a story with your data.
- Storytelling with Data: See how dashboards can be organized into narratives, guiding users through a logical flow of insights and highlighting key findings. Discover how data can be presented in a clear and engaging manner.
- Industry-Specific Examples: Often, the public environment showcases dashboards tailored to different industries like retail, finance, or healthcare. This allows you to see how OAC can be applied to real-world business challenges within specific contexts.
- Key OAC Features in Action: Get a glimpse of features like natural language query (asking questions in plain English), mobile responsiveness (viewing dashboards on different devices), and the overall user-friendly interface of Oracle Analytics Cloud.
Why Explore OAC Public?
Visiting www.oracle.com/oacpublic offers multiple benefits:
- Hands-on Experience: It’s the easiest way to get a feel for the look and feel of Oracle Analytics Cloud without needing to provision an instance or upload your own data. You can start exploring immediately.
- Inspiration and Ideas: See how others are visualizing and analyzing data. The pre-built workbooks can spark ideas for your own analytics projects and showcase best practices in data presentation.
- Understanding OAC Capabilities: For those evaluating analytics platforms, OAC Public provides a tangible demonstration of what Oracle Analytics Cloud can do. It allows you to see the features in action and assess if it meets your needs.
- Learning and Skill Development: Even if you’re already familiar with analytics, exploring different dashboards and visualizations can broaden your understanding of data exploration techniques and the potential of modern BI tools.
- No Cost, No Commitment: It’s a free resource accessible to anyone with an internet connection. You can explore at your own pace without any obligation
Check out what OAC Public has to offer in 90 seconds:
In Conclusion
www.oracle.com/oacpublic is more than just a website; it’s a dynamic experience into the world of modern data analytics powered by OAC. It’s an invaluable resource for anyone seeking to understand the power of data visualization, gain inspiration for their own analytics endeavors, or simply experience the user-friendly interface of the leading BI platform.