Oracle Autonomous Database includes the spatial function SDO_GCDR.ELOC_ROUTE_GEOM, which enables users to calculate routes between two locations and return the result as an SDO_GEOMETRY object. This function supports both address-based and coordinate-based inputs, and is ideal for creating map-based routing visualizations within Oracle Analytics.
What Is ELOC_ROUTE_GEOM?
This function computes the driving route between two locations and returns the route geometry in native Oracle spatial format. It can handle both single-line formatted addresses and latitude/longitude coordinates.
Key Parameters
- route_preference: Preferred route (for example, shortest, fastest, or traffic).
- start_address / end_address: Full addresses for the starting and ending points.
- country: 2-character ISO country code (for example, US).
- start_longitude / start_latitude / end_longitude / end_latitude: Alternative to using an address (input using coordinates)
- vehicle_type: Type of vehicle (for example, auto or truck)
Note: This function is available only in Oracle Autonomous Database and requires the appropriate access permissions using SDO_GCDR.ELOC_GRANT_ACCESS.
Example: Static Routing
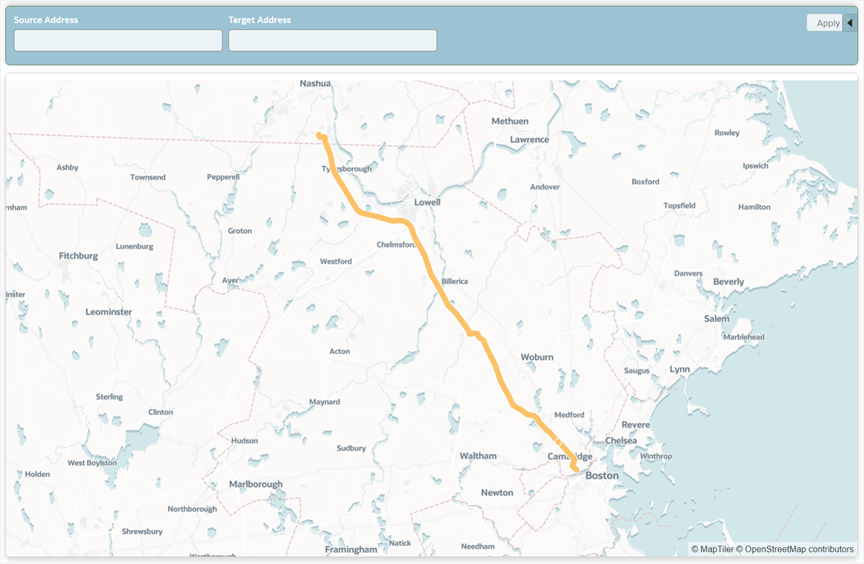
This example shows how to compute the shortest driving route from “1 Oracle Dr, Nashua, NH” to “77 Massachusetts Ave, Cambridge, MA”:
SDO_GCDR.ELOC_ROUTE_GEOM(‘shortest’, ‘1 Oracle Dr, Nashua, NH’, ’77 Massachusetts Ave, Cambridge, MA’, ‘US’, ‘auto’) AS ROUTE_GEOMETRY
FROM
DUAL;
The result is a spatial object representing the full route, which can be visualized on a map in Oracle Analytics.
To build interactive dashboards, the routing query can be made dynamic using session variables in Oracle Analytics.
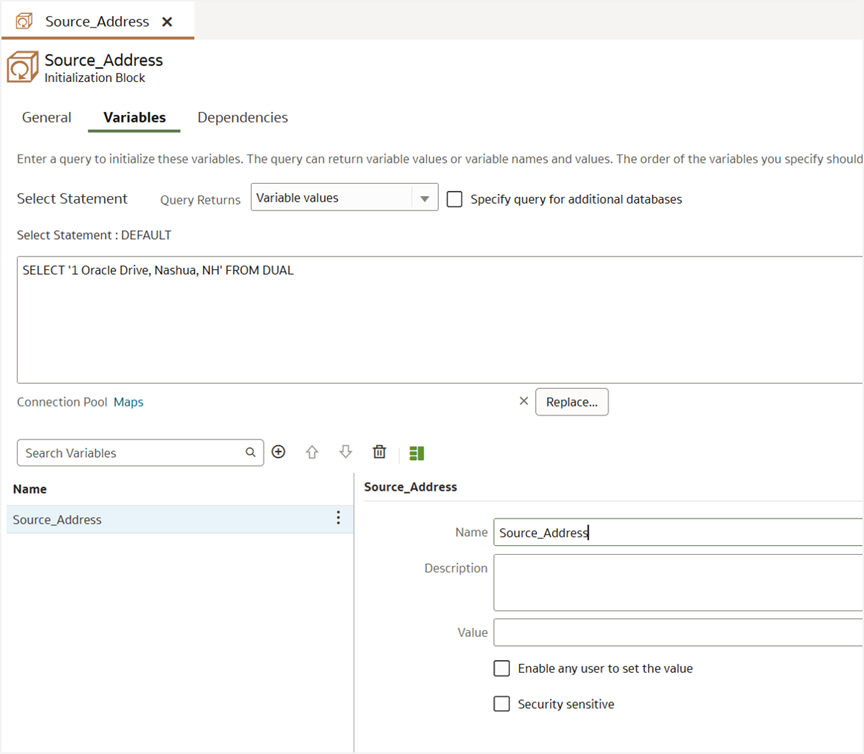
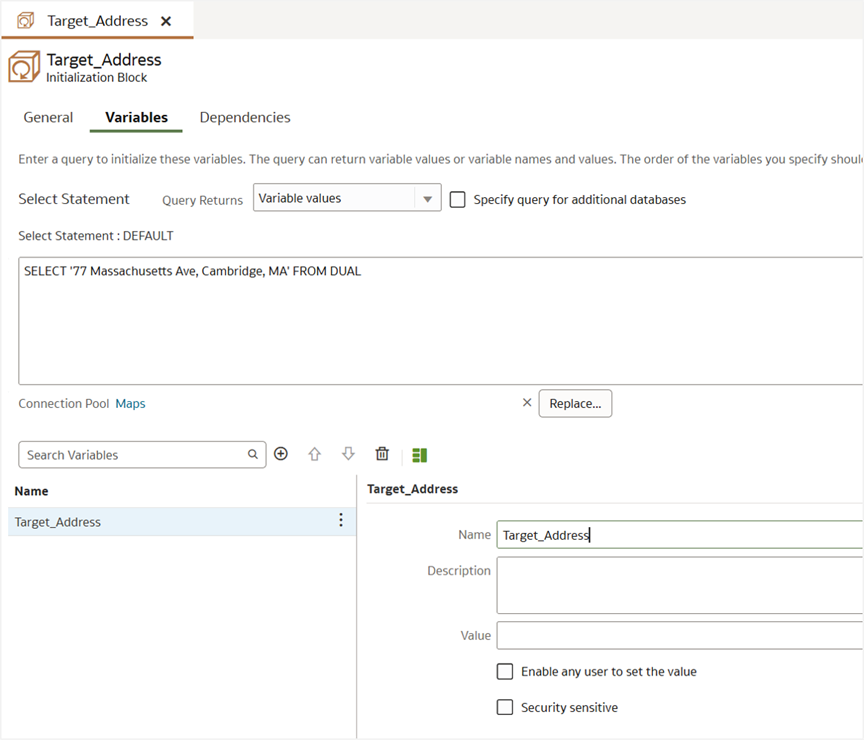
Step 1: Create Session Variables to Use in the SQL Query
Before you can reference a session variable in your SQL, you must define it in the semantic model:
- Define the following session variables:
- Source_Address
- Target_Address
- Assign default values for testing.
- Deploy the semantic model.
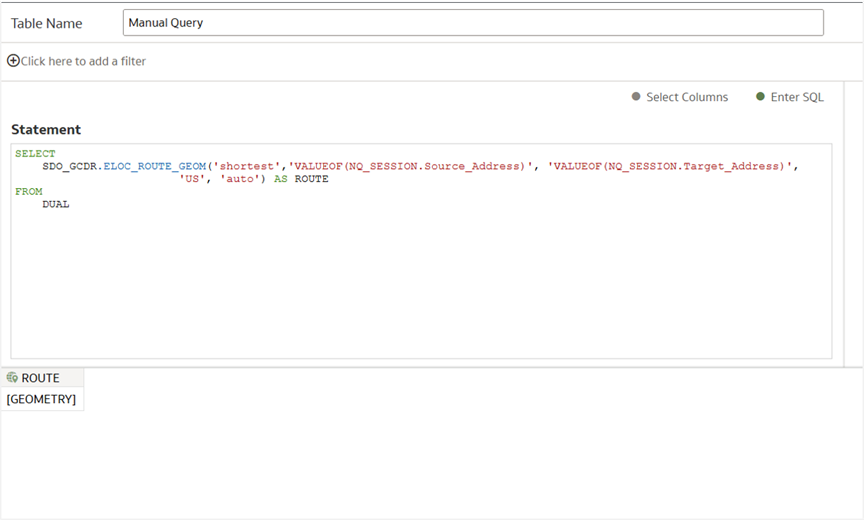
- Then, use the following SQL query to create a data set using Manual SQL Query mode:
SDO_GCDR.ELOC_ROUTE_GEOM(‘shortest’, ‘VALUEOF(NQ_SESSION.Source_Address)’, ‘VALUEOF(NQ_SESSION.Target_Address)’, ‘US’, ‘auto’) AS ROUTE
FROM
DUAL;
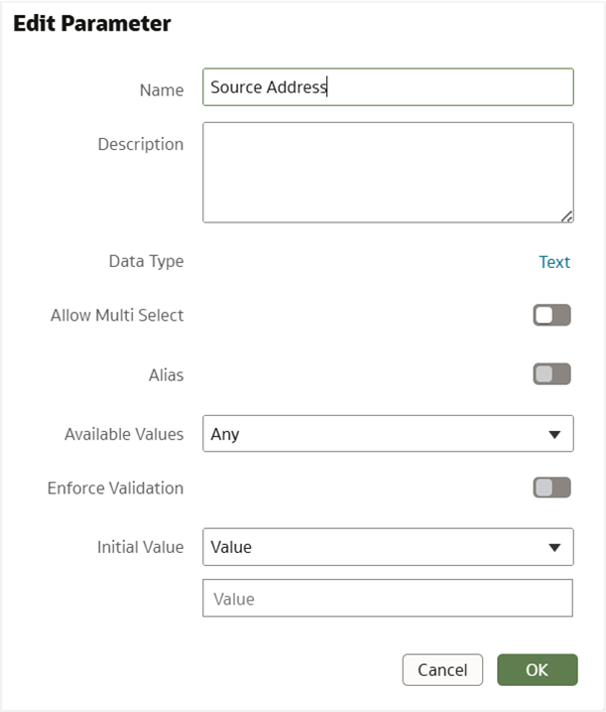
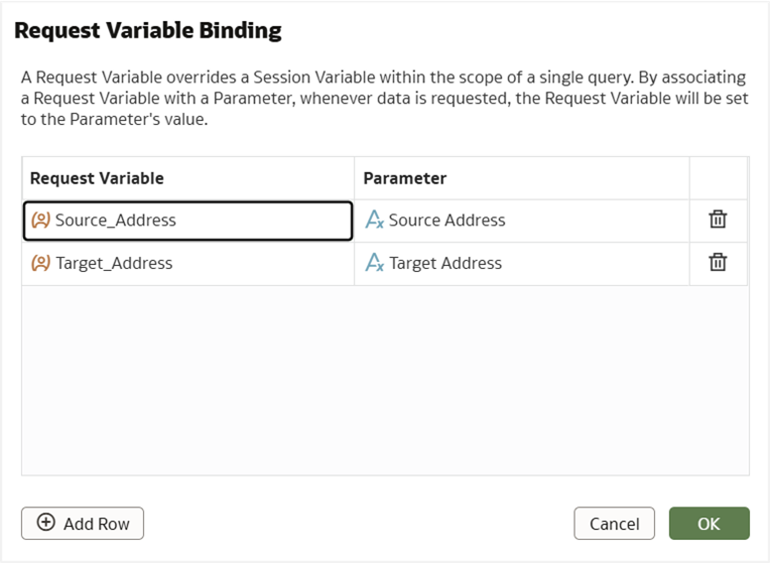
Step 2: Create Workbook Parameters and Bind Them to the Session Variables
Once the SQL is saved as a dataset in Oracle Analytics, you can:
- Create parameters in your workbook matching the session variable names and expose them as dashboard filter controls on your canvas. For example, parameters called Source Address and Target Address will make sense to users as dashboard filter controls on the canvas.
- Use parameter binding to connect the user-entered values to the session variables.
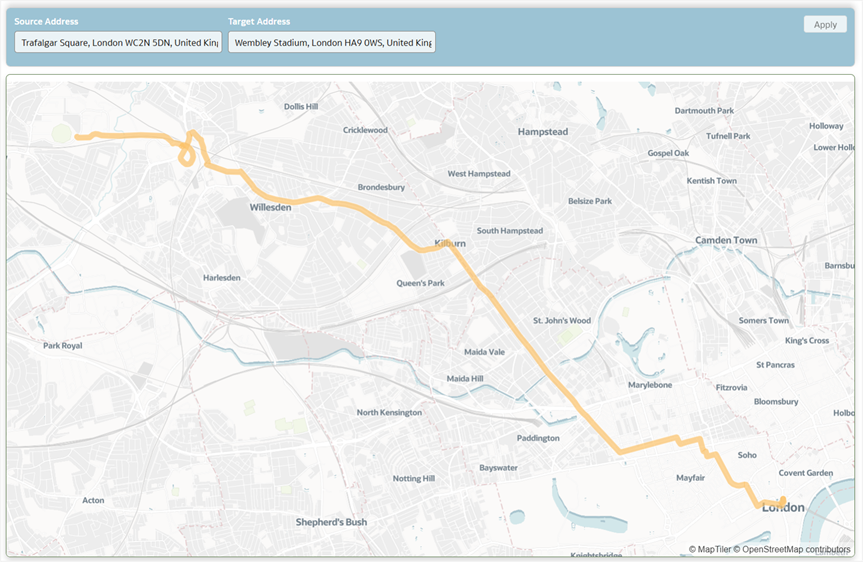
Later, you can expose the parameters to your users through a dashboard filter with the filter type as Text Box. Users use these text boxes to select an address.
This setup allows users to enter any source and destination address, and the spatial SQL will return the preferred route between them, which can be immediately visualized on a map.
Once the SQL with session variables is saved as a dataset, the resulting SDO_GEOMETRY can be rendered dynamically using a map visualization in Oracle Analytics based on the user input. This is useful for building route planning dashboards, delivery estimations, and location-based services.
With the SDO_GCDR.ELOC_ROUTE_GEOM function in Oracle Autonomous Database and the session variable support in Oracle Analytics, you can provide dynamic and interactive routing experiences directly in workbooks. This enhances location intelligence by helping users visualize the best route between any two points with just a few inputs.
Stay Tuned
In the next part of this series, we’ll explore a real-world use case using Spatial SQLs and Oracle Analytics.
Reference
Geometry Data Type technical paper
Call to Action
Now that you’ve read this article, try it yourself and let us know your results in the Oracle Analytics Community, where you can also ask questions and post ideas. Be sure to explore the Community Gallery as well, where users share their most creative dashboards and map visualizations for inspiration.