Geospatial data is an integral part of modern business intelligence and helps organizations analyze location-based insights for better decision-making. Oracle Analytics makes map-based analytics easy by directly leveraging the Geometry data type in maps and spatial calculations. This article explores how the Geometry data type enhances spatial intelligence in Oracle Analytics.
Why the Geometry Data Type Matters
Oracle Analytics natively supports Geometry data type columns, enabling users to effortlessly visualize spatial datasets simply by dragging these columns to a visualization. This allows users to analyze geospatial data in a dynamic and interactive manner.
Accelerates map design and visualization
- Drag-and-drop capability: Spatial data is instantly visualized on maps by dragging geometry columns to visualizations on the canvas.
- Automatic rendering: Geometry data is automatically rendered without the need for manual map layer configuration by administrators.
- Enhanced visual performance: Smooth and responsive map-based analytics is in place for a better user experience.
Optimizes map layer maintenance
- Real-time updates: Maps are automatically updated when geometry data changes, ensuring real-time accuracy.
- Reduced maintenance: Manual adjustments or preconfigured map layers aren’t required.
- Simplified data management: The overhead required for maintaining separate geographic datasets is reduced.
Supports spatial calculations
- Distance, area, and length calculations: Precise spatial analysis with functions to calculate distances, areas, and lengths is enabled.
- Advanced geospatial functions: GeometryRelate, GeometryWithinDistance, and GeometryAsText functions are supported for advanced analytics.
Get Started with the Geometry Data Type
1. Enable the Geometry data type
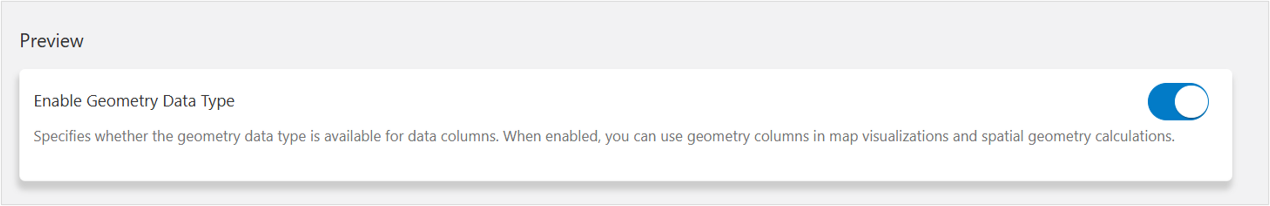
The Geometry datatype capability isn’t enabled by default on Oracle Analytics Cloud (OAC) environments. To enable it, an administrator needs to follow these one-time steps:
- From the Home page, click Navigator, Console, and then System Settings.
- Under Preview, toggle the Enable Geometry Data Type property to on.
- Click Apply to save the changes.
Note: The Geometry data type is in Preview mode only for OAC. It’s available as a standard feature and enabled by default with Oracle Analytics Server (OAS).
2. Identify Geometry data
Oracle Analytics recognizes geometry columns from two primary sources:
- Database geometries: For example, in Oracle, using SDO.Geometry format.
- CSV files: With Well-Known Text (WKT) format.
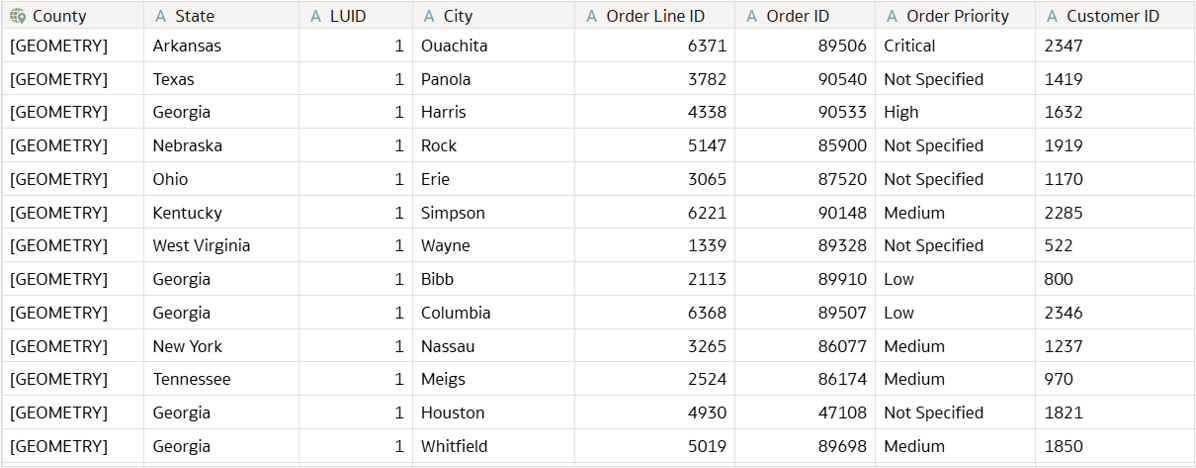
Once imported, the dataset displays geometry columns as [GEOMETRY], and is ready for use in map visualizations and spatial calculations.
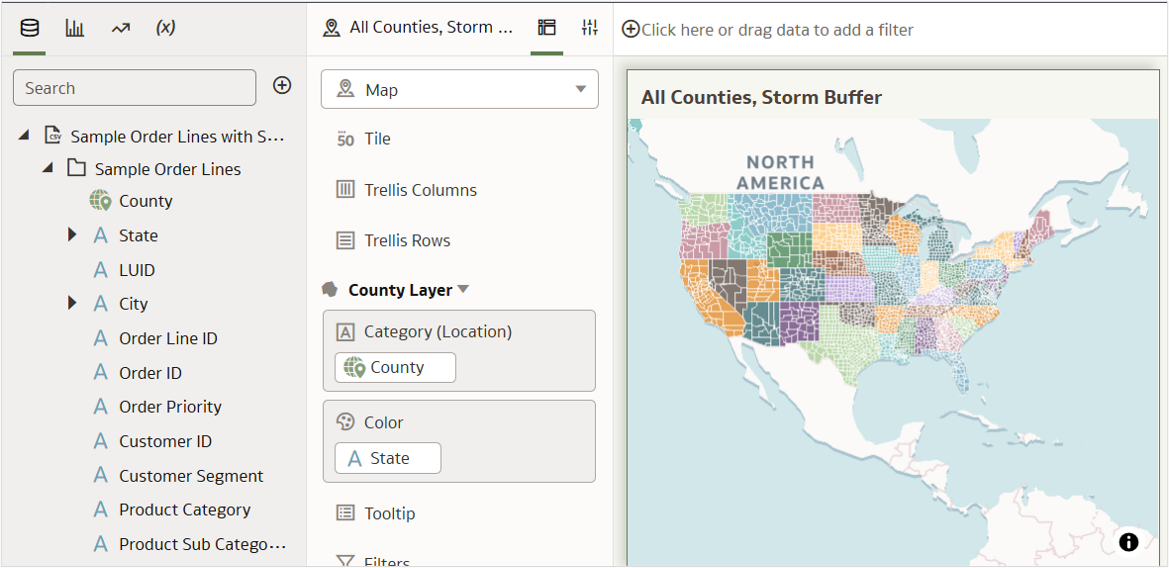
3. Visualize Geometry columns
- Create a workbook in Oracle Analytics.
- Add a dataset containing geometry columns
- Drag the geometry column to the visualization.
- Choose from various map styling options such as background layers, color encoding, and legend toggles.
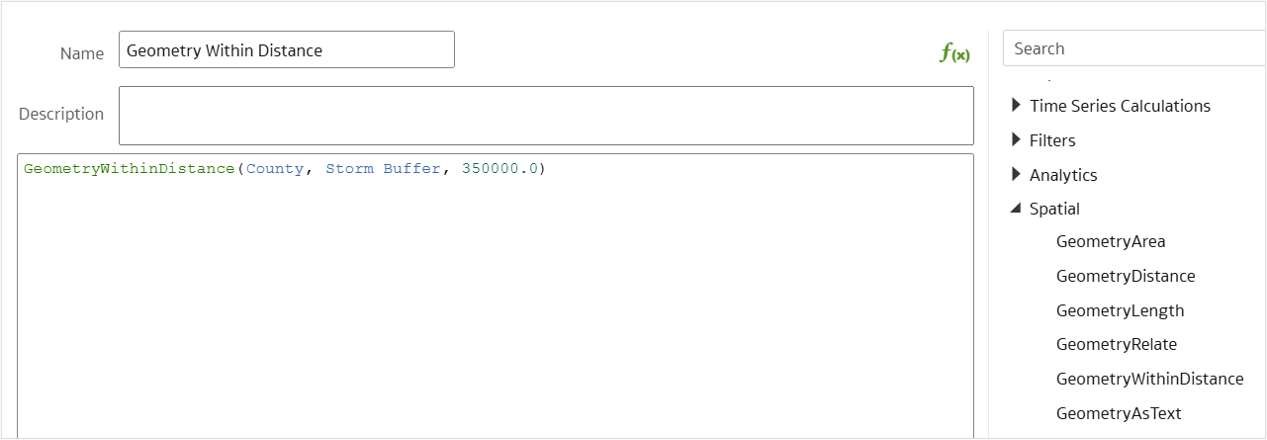
4. Perform spatial calculations
Oracle Analytics provides built-in functions for spatial analysis:
- GeometryArea(geometry_column) – Calculates the area of a shape.
- GeometryLength(geometry_column) – Computes the perimeter or length
- GeometryDistance(geometry_column1, geometry_column2) – Measures the distance between two locations.
- GeometryRelate(geometry_column1, geometry_column2) – Determines spatial relationships (e.g., inside, touching).
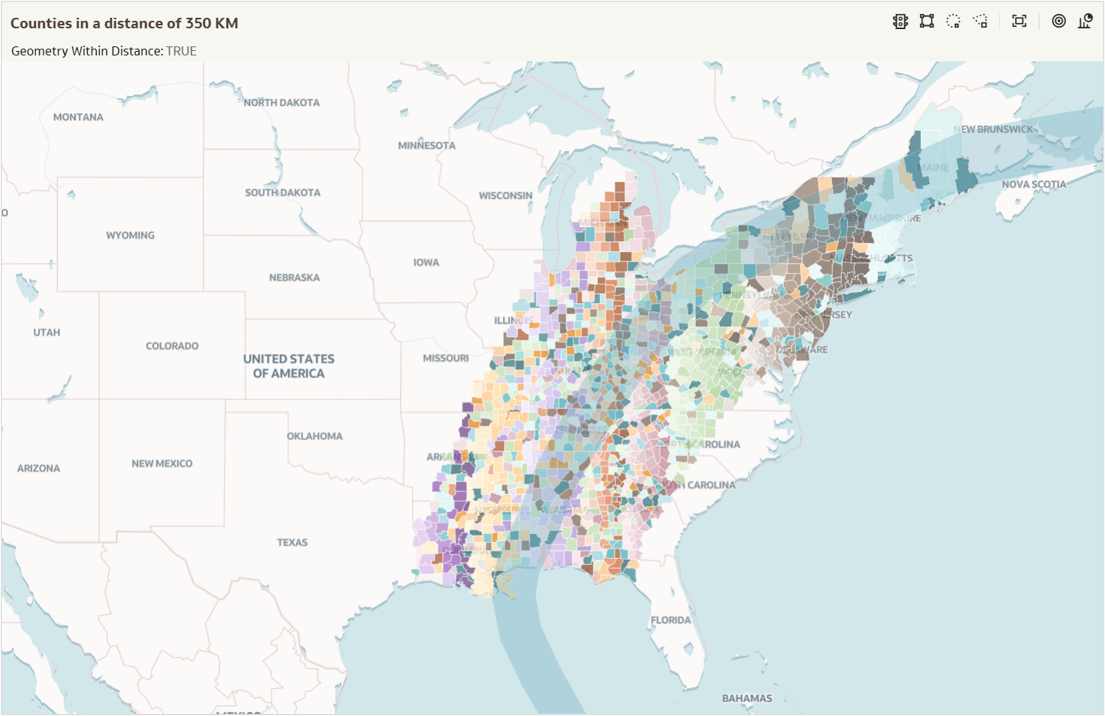
- GeometryWithinDistance(geometry_column1, geometry_column2, distance_m) – Checks if 2 locations are within a given range.
Where geometry_column, geometry_column1 and geometry_column2 are part of the datasets used.
Limitations to Consider
While the Geometry data type offers significant advantages, users should be aware of certain limitations:
- Geometry columns can’t be used as workbook filters or drill-down elements.
- No default spatial join is supported; users need to manually model a Cartesian join for spatial calculations that require it.
- Maps using geometry columns don’t render on mobile devices.
- Large geometries above 128 KB in size might not display on maps.
For more details, see the Geometry data type technical paper.
Stay Tuned
This initial article introduces the various entries that help users explore capabilities of the Geometry data type in Oracle Analytics. Stay tuned for upcoming articles in this blog series!
Call to Action
Now that you’ve read this article, try it yourself and let us know your results in the Oracle Analytics Community, where you can also ask questions and post ideas. Be sure to explore the Community Gallery as well, where users share their most creative dashboards and map visualizations for inspiration.