The Oracle Analytics Cloud (OAC) development team has shipped the March 2024 update. As with past updates, this delivery is packed with new functionality intended to help business users better visualize and understand their data. This blog provides an overview of the most important functional items, that you can also see short demos in the Youtube playlist. Oracle documentation links are also provided where appropriate.
There are many new items or enhanced features in several product areas including connectivity and data preparation. There are also new features added within in data modelling, data visualization, as well in the area of augmented analytics, machine learning (ML) and embedding/integration.
Let’s start with augmented analytics, ML and integration/embedding which have been enhanced to be more flexible:
- Users consuming Auto-Insights results can already customize their Auto-Insights settings to orient the underlying AI according to what they need to focus on in their analyses. With this update, these customizations will remain saved on a per user per dataset basis. That way, the next time a user returns to their dataset or workbook, their Auto-Insights customizations will be preserved.
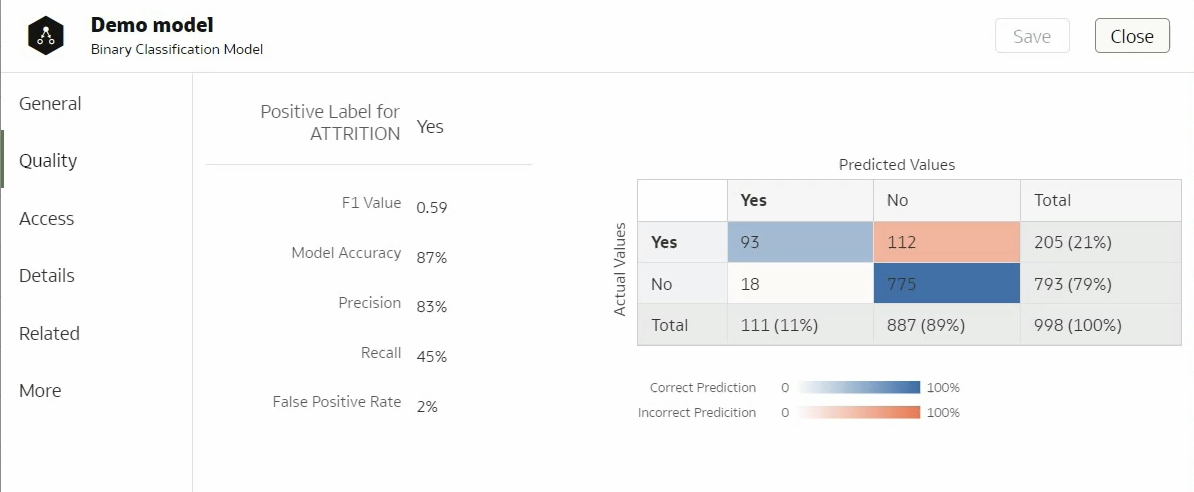
See video here and documentation entry Reset Auto Insights Settings. - The Auto ML capability that initiates Oracle Database Machine Learning processes now automatically retrieves and visualizes model quality information. Users can train best in class ML models on a column with a single click, and have access to quality metrics about their generated model from within the inspect menu experience.
See video here and documentation entry Assess a Predictive Model’s Quality. - Users can set locale and language preferences directly in their user profiles to override their browser settings. The user interface displays in the specified language, and time, date, and currency data display based on the specified locale.
See video here and documentation entry Localize the User Interface for Data Visualization. - Updated integration has enhanced the ability to embed workbooks into other applications and web pages. It enables the ability to embed full workbook displays in presentation mode with all related interactivity as opposed to the design mode.
See video here and documentation entry Prepare the HTML Page for Embedding.
Second, in the area of data modeling and data visualization many new features have been added:
- The ability to add Reference Lines in a visualization on any dimension on the attribute axis. This capability allows users to show marker-lines directly on their visualizations regardless of whether on the metrics or attributes axes.
Watch the video and documentation entry Add Reference Lines to Visualizations. - These Reference Lines can also directly be bound to Oracle Analytics parameter values, allowing reference lines values to be dynamic for end users.
Watch the video and documentation entry Bind a Reference Line or Band to a Parameter. - Generally Oracle Analytics parameters can now be bound to different types of canvas filters like relative time filters or Top/Bottom N filters. This capability allows users to dynamically update filters across visualizations by simply changing a parameter value.
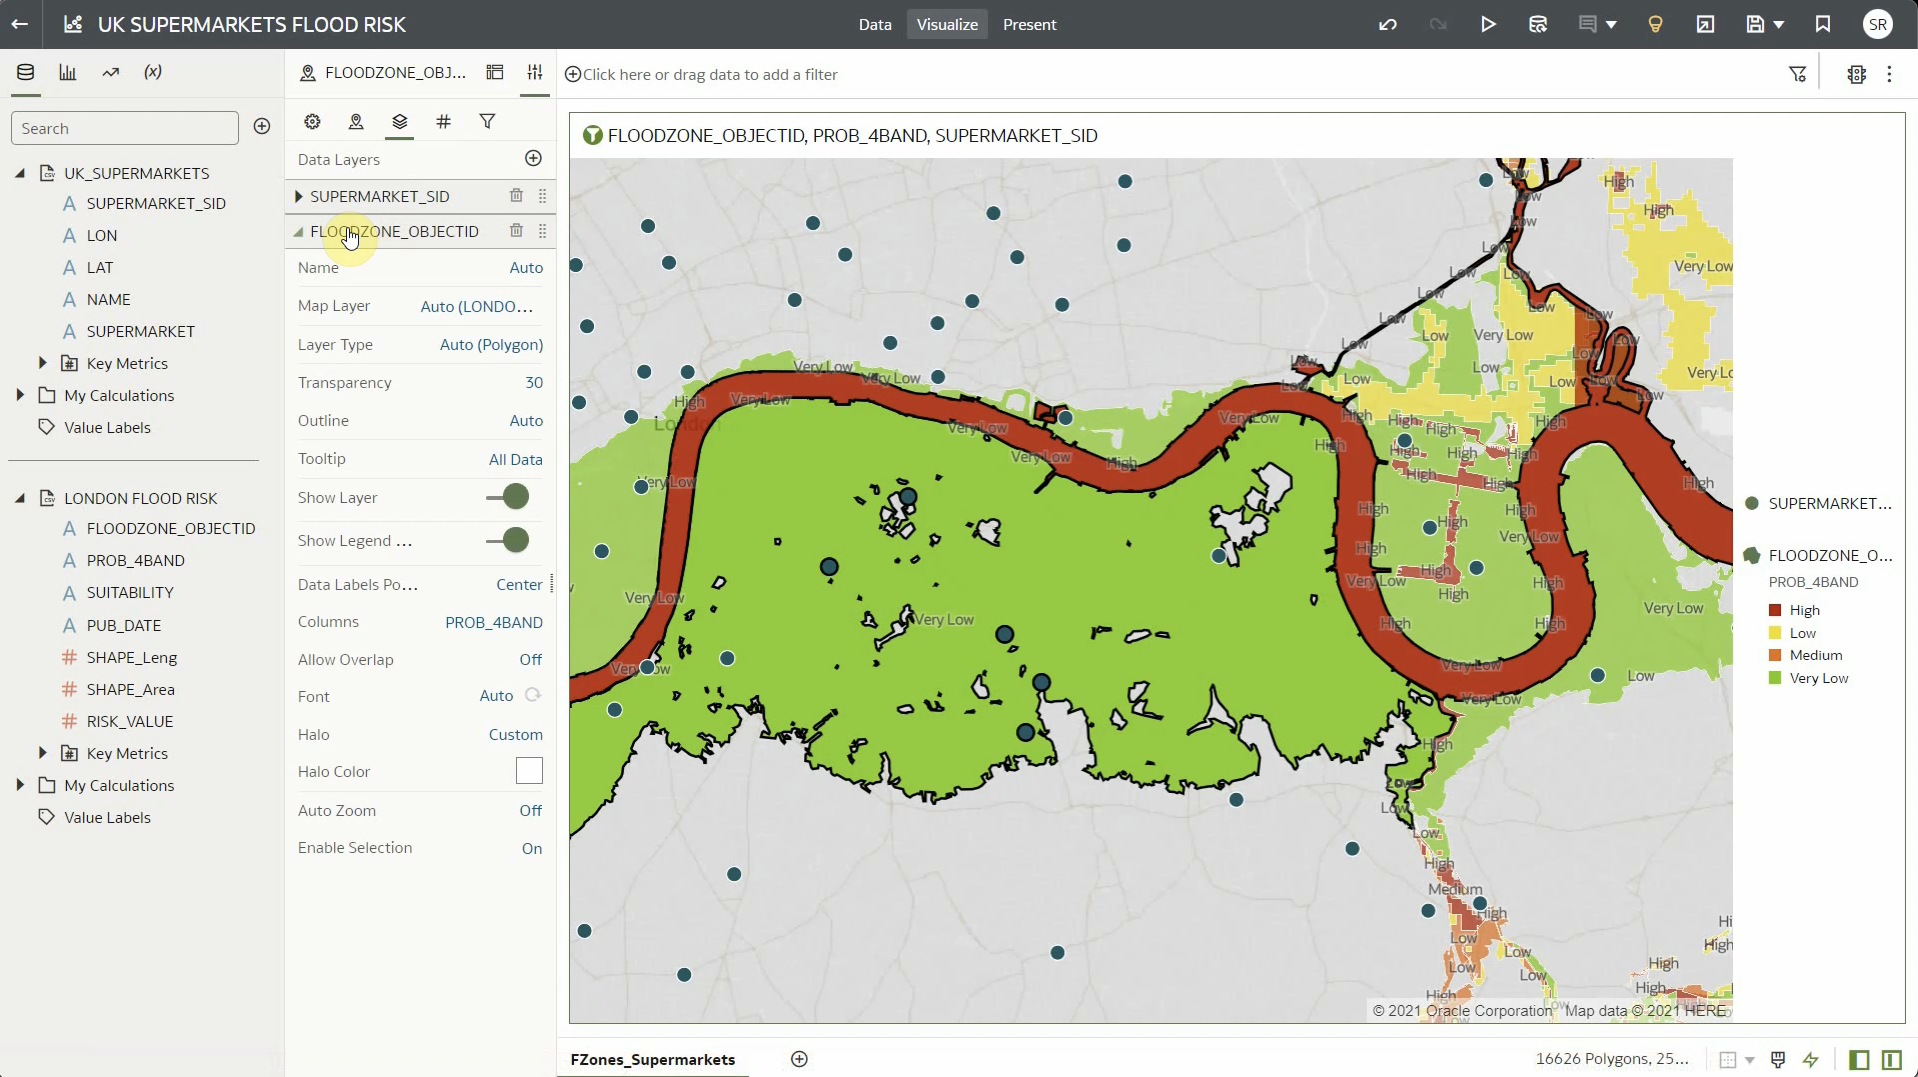
Watch the video and documentation entry Create and Bind a Parameter to a Filter. - Maps visualizations have been enhanced to offer more controls for formatting lines, polygon outlines (size, colors), and formatting data labels (e.g. red for negative numbers).
Watch the video and documentation entry Apply Multiple Data Layers on a Single Map Visualization & Format Numeric Values of Visualizations. - In the data modeling area, time series functions like Ago, ToDate and PeriodRolling calculations are natively available for any time columns in workbooks. There is no longer a need to use the semantic layer as a data source. Any time column from any dataset will support Time Series functions as workbook custom calculations.
Watch the video and documentation entry Time Series Functions.
Finally, items related to data connectivity and data preparation. These additions will help business users securely connect to a larger set of sources to enable faster data preparation:
- The connector to Delta sharing providers, like databricks, has been enhanced to support bearer tokens for authentication within OAC workbooks.
Watch the video and documentation entry Connect to Data Using Delta Sharing. - A new connector has been added to enable OAC to source directly from Oracle Cloud Infrastructure (OCI) Data Flow SQL endpoints.
Watch the video and documentation entry Overview to Analyzing OCI Data Flow SQL Endpoints. - The Custom Knowledge feature enables automatic enrichments of new data based on custom repositories uploaded by users. This feature has been extended to support keys that are entirely made of numeric values instead of text. This enables common categorization codes that contain only digits as keys for automatic enrichments.
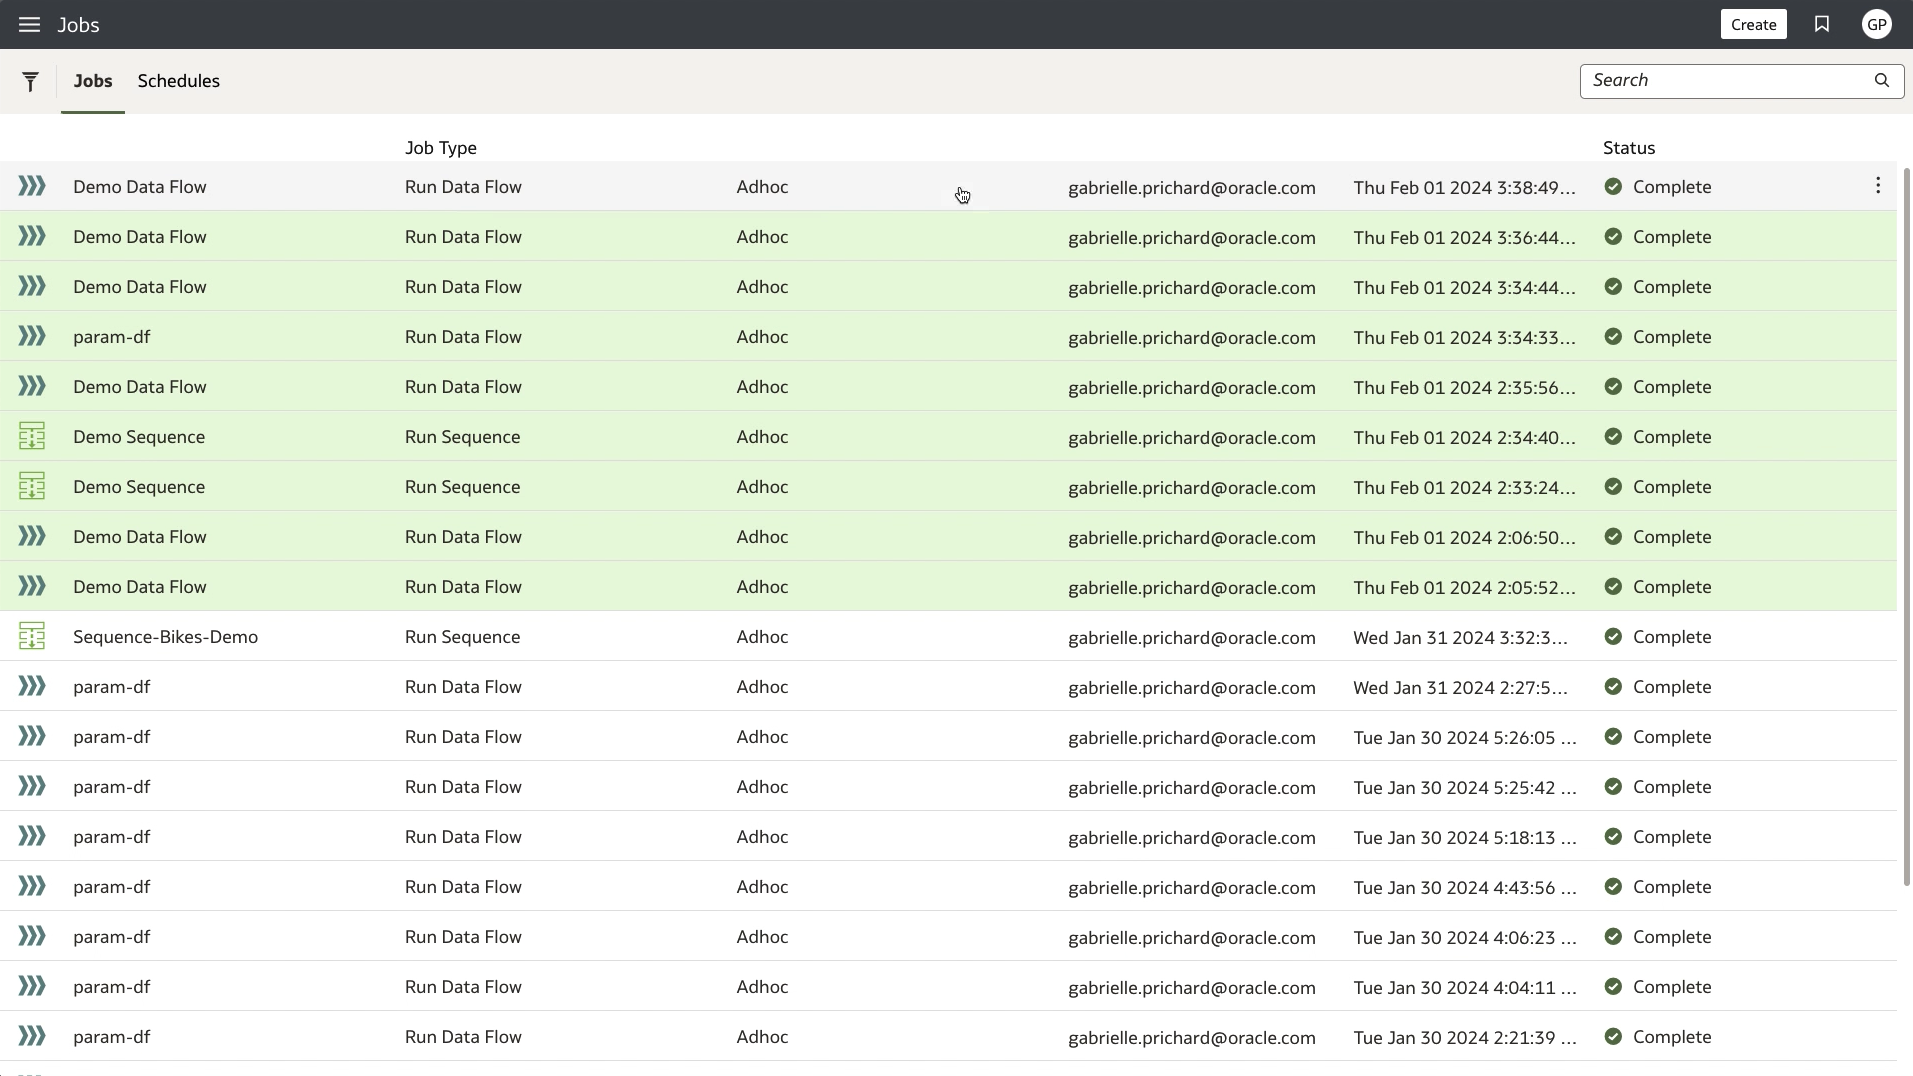
Watch the video and documentation entry Working with digit-only Keys. - A REST API has been added to enable users to run and monitor OAC data flows in a full programmatic way without having to use the OAC user interface. The same API also enables running data flow sequences. Watch the video.
We trust that you’ll find value in and delight from these new or enhanced features. Thank you for reading this blog!
See all the demos on the March 2024 update YouTube playlist
Read more on the Oracle Analytics platform product page
Find out more on the Oracle Analytics capabilities explorer