If you have ever looked at a notebook error and thought, “This shouldn’t be failing,” you are not imagining things. Debugging a notebook often feels harder than debugging traditional code because the failure is rarely just about the code in front of you. It is often tied to execution order, hidden state, session attachment, and the behaviour of the underlying compute.
The Spark session may have ended
In a traditional codebase, if the file is there and the runtime is up, you can usually start debugging the logic right away. In notebooks, that assumption breaks down quickly.
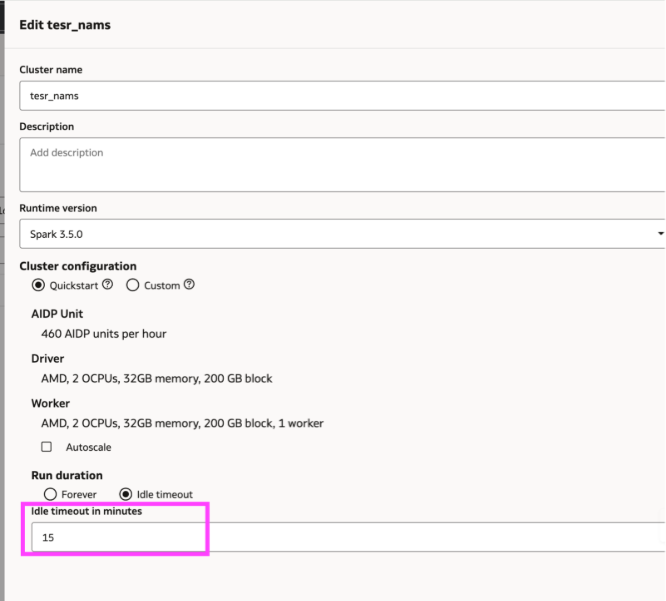
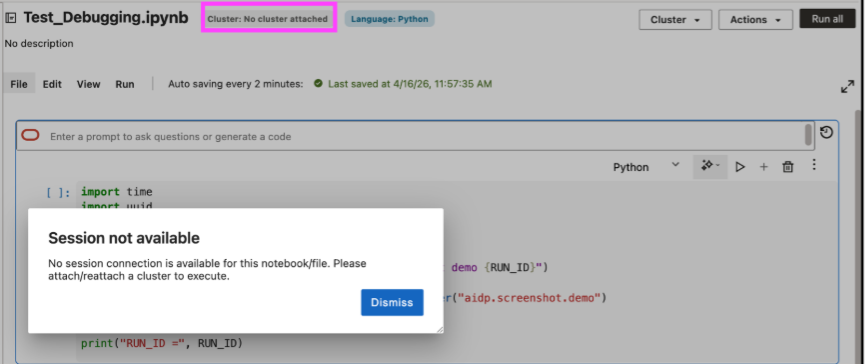
Sometimes the code is still intact on the screen, but the execution environment behind it is no longer available. A notebook can lose its session simply because the attached cluster hit its idle timeout.
Since notebooks require an attached cluster to run, a period of inactivity can detach the notebook.
This is one of the ways notebooks debugging differs from debugging traditional code. The notebook may appear intact while the runtime context has changed. AIDP Workbench reduces this ambiguity by surfacing a clear “session unavailable” state when no live session is attached, making the source of the issue easier to identify.
How to resolve it:
- Check cluster attachment before debugging the cell itself.
- If the cluster timed out or detached, reattach it first.
- Rerun any setup cells after reconnecting, because session-scoped state may no longer be available.
- Adjust idle timeout only when the workflow requires it, keeping cost impact in mind.
The spark session is live, but the state is out of sync
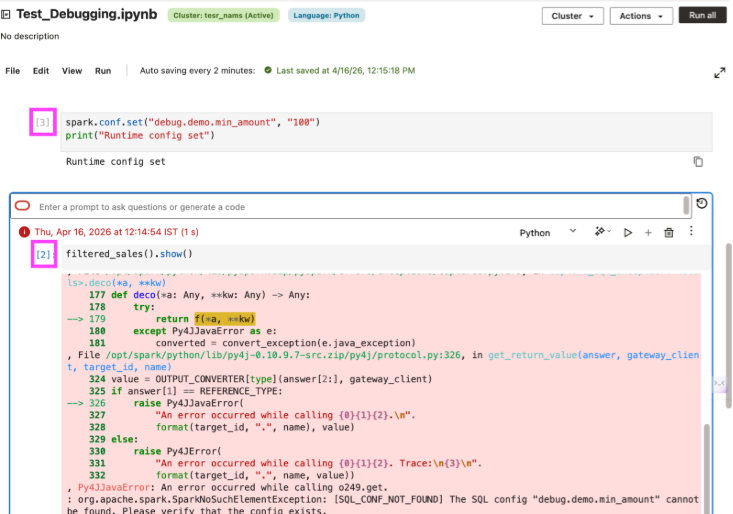
In notebooks, the code on screen can appear correct and still fail because execution order does not match dependency order. A function may depend on a config or setup cell that was not run in the current session or was added later and not rerun before the dependent cell was executed again.
That is what makes notebook debugging tricky: the code can look complete, but the runtime state behind it is incomplete. A failing cell may point you toward the function, even though the real issue is that a required dependency was skipped or only added after the first run. AIDP Workbench helps here by showing a run number on each notebook cell, so you can trace execution order more easily and spot when the notebook was run out of sequence.
This is what makes notebook debugging tricky. The code may look complete, while the runtime state behind it is incomplete. A failing cell may draw attention toward the function, even though the real issue is that a required dependency was skipped or introduced only after the previous run. AIDP Workbench shows a run number on each notebook cell, making it easier to verify whether dependency cells ran already.
How to resolve it:
- Check whether the failing cell depends on an earlier setup or config cell.
- Use cell run numbers to verify whether the dependency ran before the failing cell.
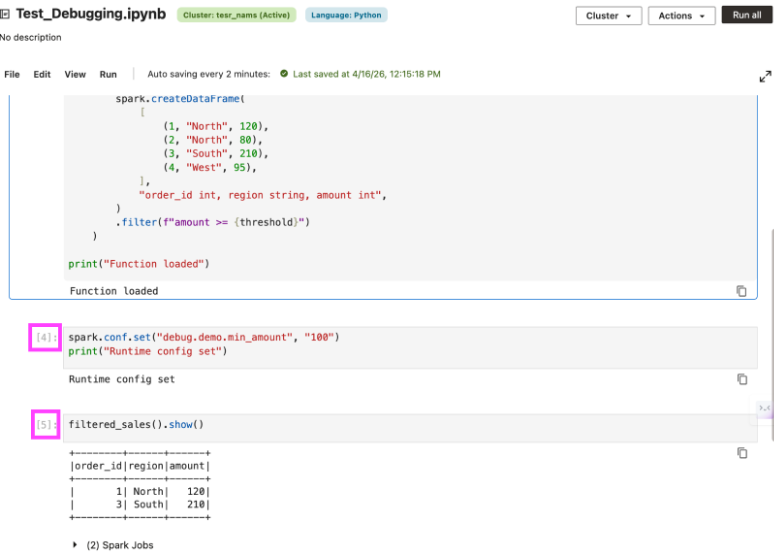
- If a dependency is added or corrected, rerun the dependent cell instead of assuming notebook state updates automatically.
- When the same code works after running an earlier cell, the problem is usually execution order, not the logic itself.
The failure happened in spark execution, not in the cell
Notebook failures are often not caused by the code in the cell alone. Many issues surface there, while the actual cause exists deeper in the compute layer.
A distributed job may fail because a specific task crashed, a worker hit an exception, or spark retried execution and eventually terminated the job. The notebook often exposes only the top-level error. Understanding the actual failure usually requires investigation beyond the cell output.
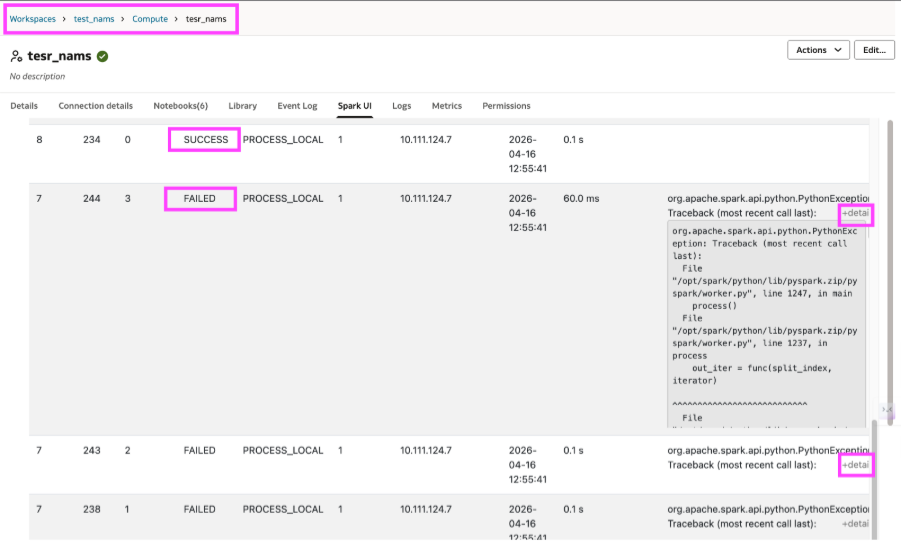
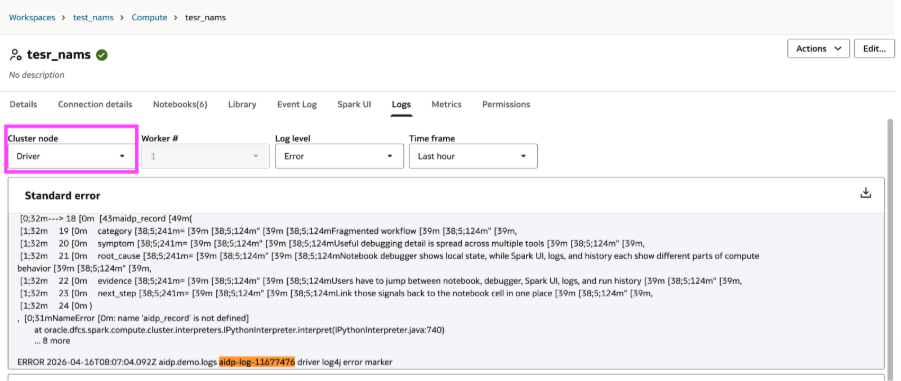
Spark UI and logs become essential at this stage. With AIDP Workbench, it is possible to move directly from the notebook to Spark UI and to driver or worker logs. Spark UI shows which tasks failed, which succeeded, and where the execution broke. Logs help you go one level deeper by showing the driver-side or worker-side error that caused the failure.
How to resolve it:
- Start with the notebook error to identify which operation failed.
- Go to Spark UI to see the failing task, stage, or execution path.
- Check driver logs for the surfaced runtime error.
- Check worker logs when the underlying failure occurred on the executor side.
The Spark workload exceeded the available compute
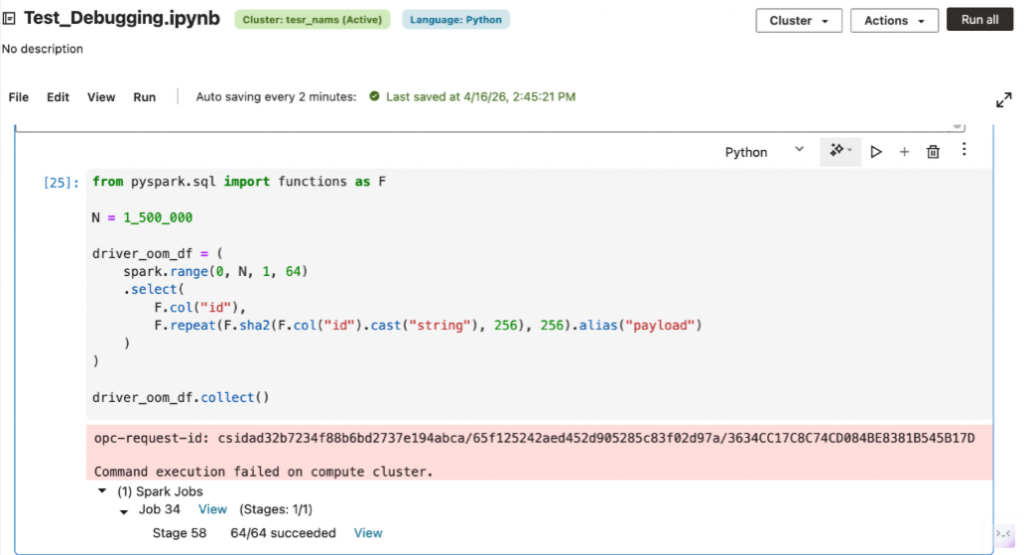
Some notebook failures are not caused by incorrect logic. A cell may fail because the workload exceeds the available compute i.e., the driver may run out of memory, executors may spill excessive data, or a shuffle-heavy job may overwhelm available resources.
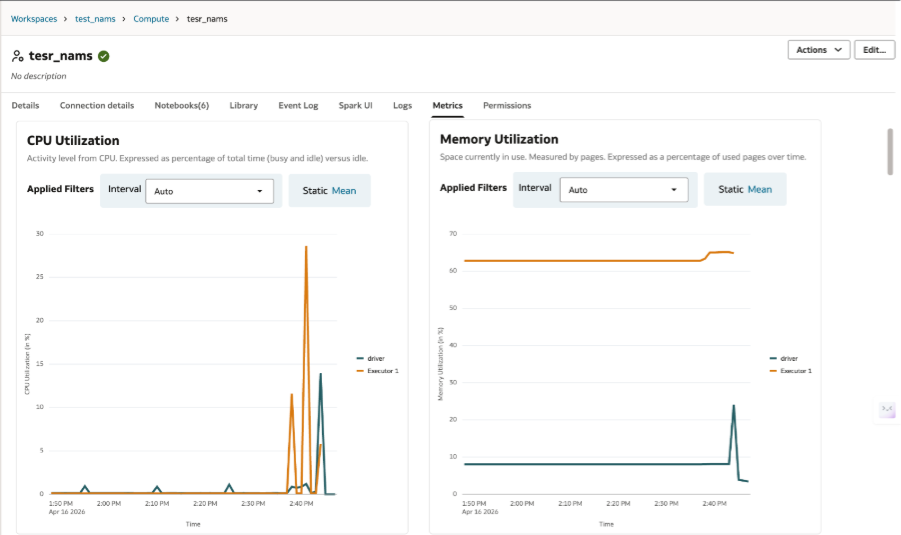
In these cases, debugging requires understanding whether the problem lies in the notebook logic or in the size and configuration of the compute environment. The appropriate fix may involve query optimization, but it may also require additional worker nodes, a larger cluster, or changes to runtime configuration. With AIDP Workbench, the Metrics tab makes it easier to see when the job is running into memory or CPU pressure rather than a logic issue in the notebook.
How to resolve it:
- Check whether the error indicates memory pressure, executor loss, or shuffle-heavy stages.
- Use Spark UI and metrics to determine whether the job is constrained by resources rather than logic.
- If the workload is valid but too large, scale the cluster or increase worker capacity before rewriting the notebook.
That is why debugging a notebook feels harder than debugging code. The cell only shows the symptom while the real explanation often lives in the surrounding context. The more easily you can move across that context, the notebook debugging starts to feel less like guesswork and more like engineering.