
If you can describe your machine learning problem as “predict a number from a table of features,” the new ADS Regression Operator is built for exactly that workflow.
The operator gives you a low-code way to train, evaluate, and package supervised tabular regression models with a simple YAML configuration. Instead of stitching together preprocessing, model selection, metric calculation, artifact writing, and reporting by hand, you can define the problem once and let ADS run the end-to-end workflow for you.
In this post, we will walk through what the ADS Regression Operator is, where it helps, and a hands-on example using the Bike Sharing dataset.
What Is the Regression Operator?
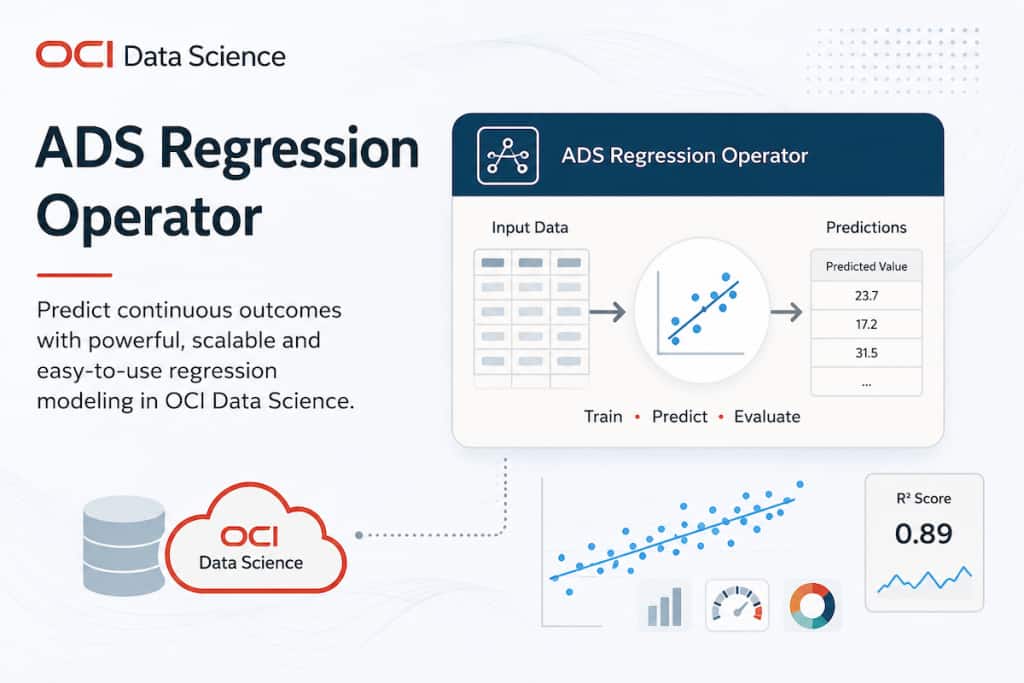
The ADS Regression Operator is a low-code operator for supervised tabular regression. It takes a training dataset, a target column, and a small set of configuration choices, then produces a trained model and a standard set of outputs such as predictions, metrics, an HTML report, and a serialized model artifact.
At a high level, the operator helps with:
- loading training data and optional test data
- using the
target_columnyou specify in the YAML - preprocessing mixed tabular features
- training a regression model
- evaluating the model on training and optional held-out test data
- generating artifacts you can review or operationalize
The operator currently supports these model options:
autolinear_regressionrandom_forestknnxgboost
When you choose auto, the operator compares the supported regression model families using cross-validation and selects the best one for the configured metric. If you already know the model family you want, you can run one explicitly.
Why This Operator Is Helpful?
Many regression projects start with the same boilerplate:
- read data
- split features and target
- detect numeric, categorical, and date columns
- impute missing values
- encode categories
- train a model
- score predictions
- save outputs somewhere consistent
That work is necessary, but it is also repetitive. The Regression Operator reduces that overhead so you can focus on the problem itself: what you want to predict, which data you trust, and how to interpret the results.
The operator is especially useful when you want:
- a repeatable YAML-driven workflow instead of one-off notebook code
- built-in preprocessing for mixed tabular data
- a consistent artifact layout for review and handoff
- a fast way to compare baseline models
- an easier path from experimentation to deployment
Example: Predicting Daily Bike Rental Demand
For this example, we will use the public Bike Sharing dataset from the UCI Machine Learning Repository. The dataset contains hourly and daily rental counts for the Capital Bikeshare system from 2011 and 2012, along with weather and seasonal information. The daily dataset includes the target column cnt, which makes it a natural regression problem.
We want to predict daily bike demand using features such as:
- date
- season
- month
- holiday and working-day indicators
- weather situation
- temperature, humidity, and wind speed
One important detail: the dataset also includes casual and registered, and those two values add up to cnt. Because they directly reveal the target, they should not be used as input features for this example.
Step 1: Install the Regression Operator dependencies
python3 -m pip install "oracle_ads[regression]"Step 2: Generate starter files
ads operator init -t regression --overwrite --output ./regression/
This generates a starter regression.yaml and backend configs you can customize.
Step 3: Prepare the bike-sharing train/test split
Download the dataset from UCI:
After downloading and unzipping the archive, use the day.csv file.
You can create a simple train/test split with pandas or your preferred data prep tool. For example:
import pandas as pd
from sklearn.model_selection import train_test_split

df = pd.read_csv("day.csv")

feature_columns = [
    "dteday",
    "season",
    "yr",
    "mnth",
    "holiday",
    "weekday",
    "workingday",
    "weathersit",
    "temp",
    "atemp",
    "hum",
    "windspeed",
    "cnt",
]

df = df[feature_columns]

train_df, test_df = train_test_split(df, test_size=0.2, random_state=42, shuffle=True)

train_df.to_csv("day_train.csv", index=False)
test_df.to_csv("day_test.csv", index=False)
Step 4: Configure the Regression Operator
Replace the contents of ./regression/regression.yaml with a configuration like the one below. Update the file paths so they point to your local copies of day_train.csv and day_test.csv.
The example marks dteday as a date column, asks the operator to choose a model automatically, and writes outputs to a results directory.
kind: operator
type: regression
version: v1
spec:
  training_data:
    url: /path/to/day_train.csv
  test_data:
    url: /path/to/day_test.csv
  output_directory:
    url: /path/to/results/blog_bike_sharing_regression
  target_column: cnt
  column_types:
    dteday: date
  model: auto
  metric: rmse
  generate_report: true
  generate_explanations: true
Step 5: Verify the configuration
ads operator verify -f ./regression/regression.yamlStep 6: Run the operator locally
ads operator run -f ./regression/regression.yaml -b localExpected Artifacts
After a successful run, you can expect outputs such as:
training_predictions.csvtest_predictions.csvtraining_metrics.csvtest_metrics.csvreport.htmlmodel.pklglobal_explanations.csvwhen explanations are enabled
This artifact pattern is useful because it makes review and handoff much easier. A teammate can quickly inspect predictions, open the HTML report, or pick up the saved model without reverse-engineering the training code.
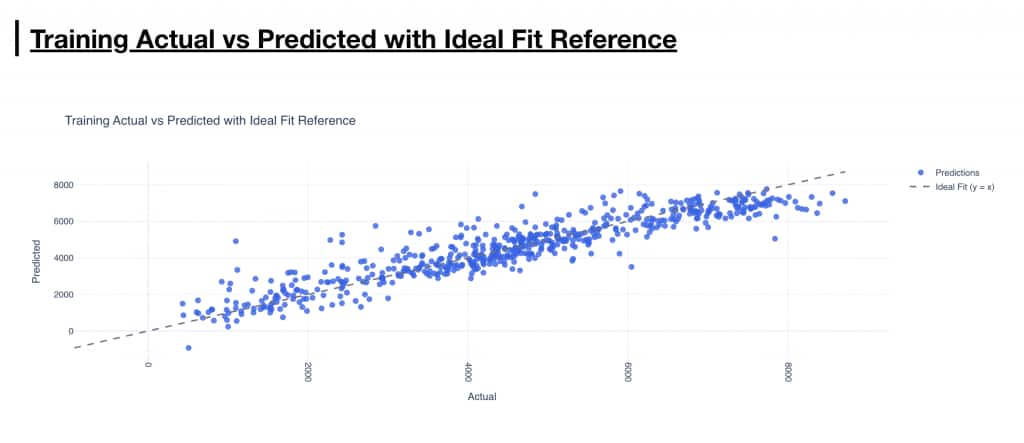
The report.html file includes an Actual vs Predicted scatter plot that helps you quickly assess model quality. Each point represents one record, with the actual target value on the x-axis and the predicted value on the y-axis. Points closer to the diagonal reference line indicate better predictions, while points farther away highlight larger errors.
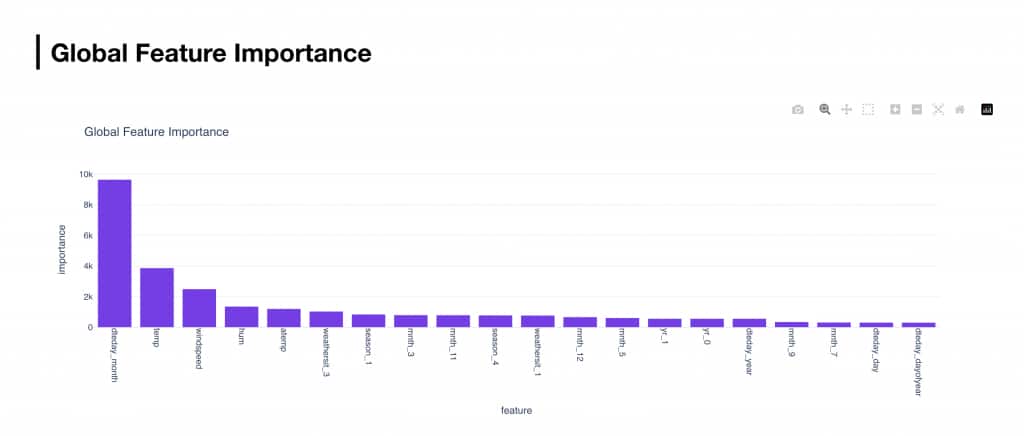
If explainability is enabled, the report also includes a Global Feature Importance bar chart. This chart shows which features had the strongest influence on the fitted model, making it easier to understand what drove the predictions.
A Few Practical Tips
- Start with
autowhen you want a quick baseline across supported model families. - Add a
test_datadataset whenever you want a clearer picture of held-out performance. - Be careful about leakage. If a feature is derived from the target or reveals it too directly, leave it out.
- Use
column_typeswhen you want to force a field such asdtedayto be treated as a date. - Turn on report generation so you get a shareable HTML summary of the run.
Closing Thoughts
The Regression Operator makes it easier to move from a tabular dataset to a working regression workflow without writing the same scaffolding code every time. It gives ADS users a repeatable way to preprocess data, train models, compare options, evaluate results, and save useful artifacts in one place. If your next project involves predicting a continuous value from structured data, the Regression Operator can help you get to a solid baseline quickly, while still leaving room to tune, explain, and productionize the result. You can find more details about our ADS Regression Operator from this official documentation page.