Introduction
For any developer delivering cloud-native applications, OpenTelemetry is often part of the cloud-native environment where the application runs. However, if you’re an engineer not working in this space then OpenTelemetry may not be a set of common products for your observability and monitoring solution.
What we want to demonstrate in this article and proof-of-concept (POC) is the modernization and elevation of observability for our WebLogic Server environments by leveraging the power and features of OpenTelemetry. OpenTelemetry will provide a unified, vendor-neutral telemetry that enhances performance monitoring, accelerates troubleshooting, and supports proactive, data-driven operations across enterprise Java applications.
What is OpenTelemetry
OpenTelemetry is a Cloud Native Computing Foundation (CNCF) project that is the result of a merger between two prior projects: OpenTracing and OpenCensus. It is a framework and toolkit designed to facilitate the generation, export, and collection of the data that make up the 3 pillars of observability: traces, metrics, and logs. Right around the corner is a fourth pillar that the OpenTelemetry community is evaluating: profile.
A major goal of OpenTelemetry is to enable instrumentation of applications and systems. This is to be done regardless of the programming language, infrastructure, and runtime environments.
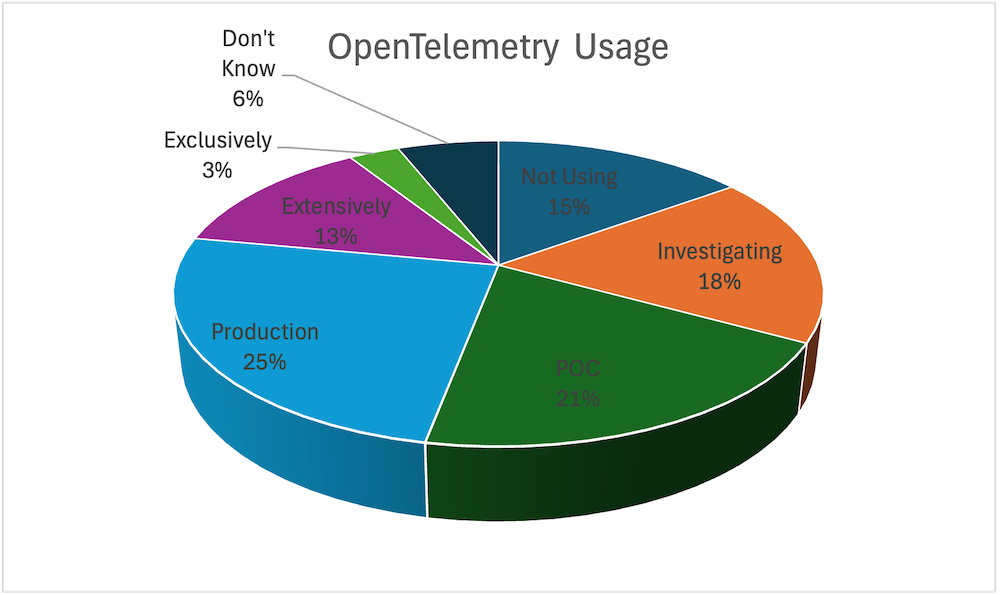
OpenTelemetry is quickly becoming the de-facto standard for observability. A 2025 survey by Grafana Labs pointed out some interesting statistics: More than 50 percent of respondents are using OpenTelemetry in production, and another 38% are actively investigating use of OpenTelemetry.
OpenTelemetry with WebLogic Server
Now that we have context regarding observability and OpenTelemetry, let’s get started in covering the POC. The purpose of the POC is to demonstrate observability using OpenTelemetry with WebLogic Server and the Oracle Database 23aiv8. We will cover the 3 pillars of observability: metrics, traces, and logs. The following table provides the list of products and versions that are included in the Proof of Concept.

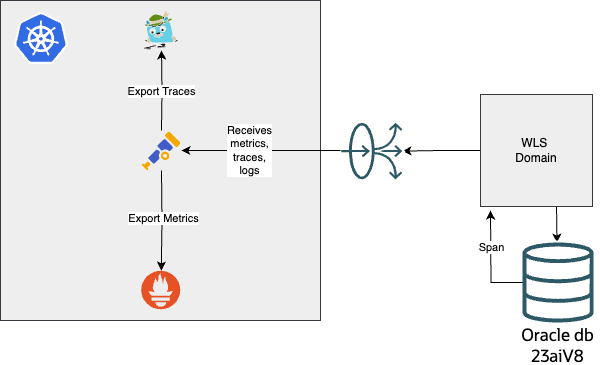
All the OpenTelemetry components, Prometheus, Jaeger, and the OTel Collector are deployed in a Kubernetes Cluster (OKE). Deploying these components to a Kubernetes cluster was purely for convenience. I had a Kubernetes cluster running and the use of Helm made the deployment easy.
The deployment of WebLogic Server (WLS) is running on virtual machines. The WLS domain consists of one administration server and two managed servers. The diagram below demonstrates at a high-level the deployment of the components.
To scrape telemetry data from WLS, we need to provide access to several Java jar files.
The script below demonstrates the setting of the necessary environment variables. It was aptly named: “enableOTEL.sh”.
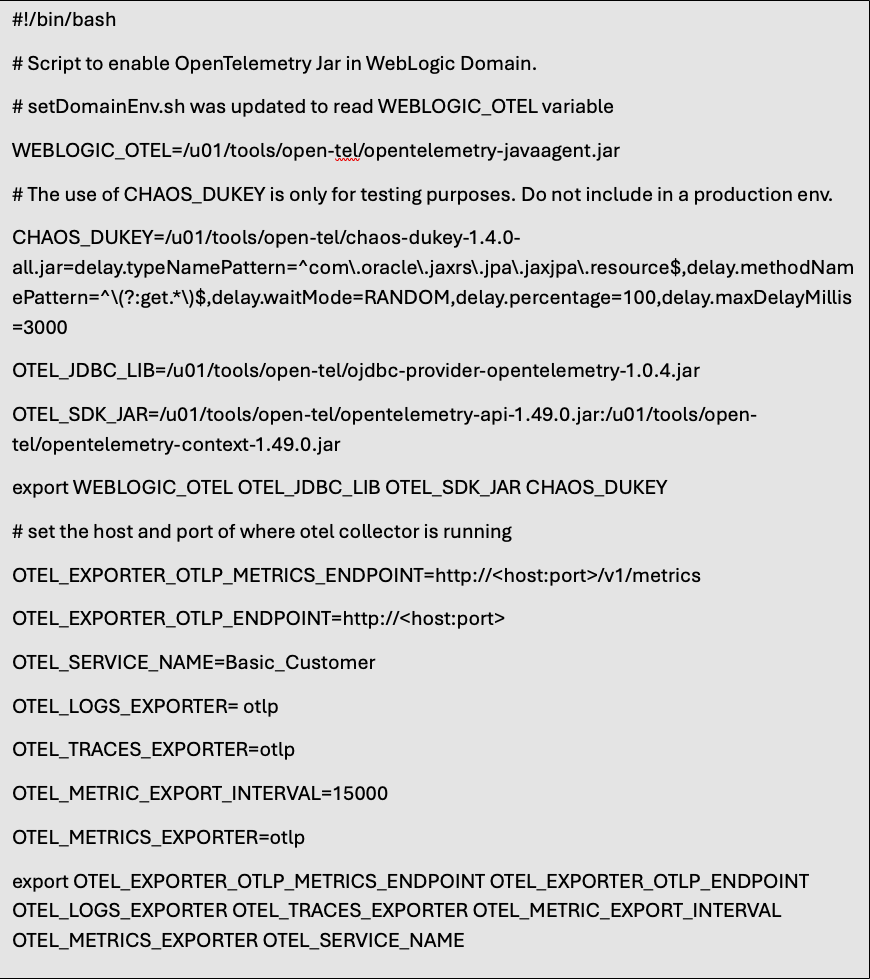
To understand all of the OpenTelemetry environment variables refer to the OpenTelemetry documentation. I will cover a couple of the key environment variables that are required to ensure a successful deployment, configuration, and scraping of the OpenTelemetry signals from WLS and the application deployed to WLS.
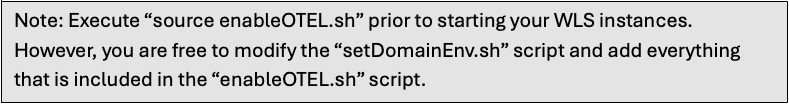
WEBLOGIC_OTEL: This is a custom variable that is set and referenced in the “setDomainEnv.sh”. This is not a net new “setDomainEnv.sh” script. It is the standard script shipped with the WLS product. The environment variable points to the location of where the OpenTelemetry Java agent resides. The java agent is also known as the zero-code instrumentation agent.

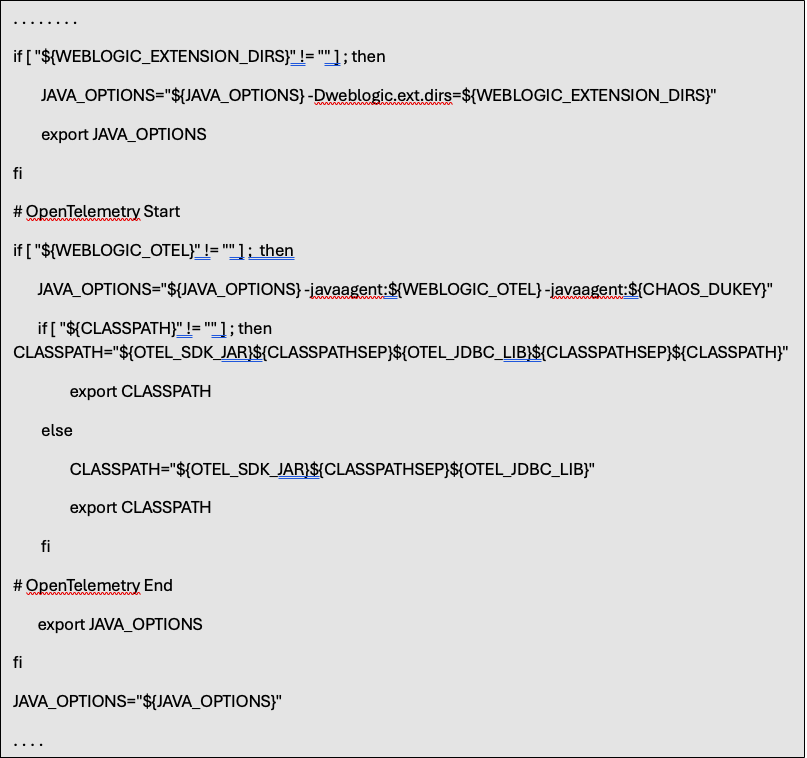
What is shown below is a snippet of the “setDomainEnv.sh” bash script. The area between “#OpenTelemetry Start” and “#OpenTelemetry End” are the necessary modifications to obtain the 3 pillars of observability from WLS and the Oracle database.
OTEL_JDBC_LIB: Again, this is a custom environment variable. It is required if you are planning to have trace spans returned from JDBC. I would highly recommend its use when executing your application on WLS and planning to obtain telemetry data.
OTEL_SDK_JAR: This is another custom environment variable. The two jars are required if you plan on capturing trace spans from JDBC, the database, and have added the properties discussed below to the database connection pool.
If these jar files are not found and the database properties have been added, then you will get “ClassNotFoundExceptions” when attempting to access the database through the JDBC connection.
CHAOS_DUKEY: This environment variable is not required. Chaos_dukey is a framework to inject latency within your application. It is only shown here to demonstrate how to add it if you want to inject latency in your application testing.
Note: Do not use this in a production environment.
With the custom script built, executed, and the WLS servers up and running we will now need to add properties to the database connection pool. Let’s have a look.
With the WLS instances started then fire up the remote console and access “sources” and create a data source. If you are unsure how to create a JDBC connection pool, then reference the WLS documentation.
With the data source and JDBC connection pool created, update the properties for the JDBC connection pool as shown below.
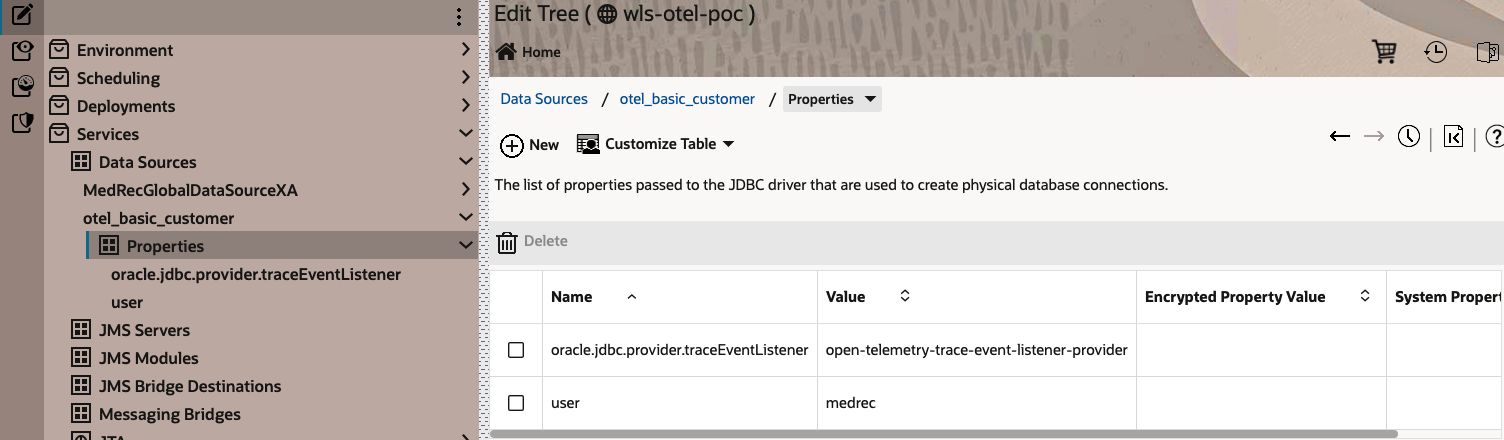
The connection pool property:
Key: oracle.jdbc.provider.traceEventListener
Value: open-telemetry-trace-event-listener-provider
Everything is configured for WLS and the database to send metrics, traces, and logs (known as signals in OpenTelemetry).
OpenTelemetry Configuration
We need to setup the OpenTelemetry collector to receive, process, and export the telemetry data. The yaml shown below is the configuration for the OpenTelemetry collector. The configuration is created and updated with a configMap.

The OTel Collector is where all the receivers, processes, and exporters are defined. Looking at the yaml above, we will look at some of the key pieces.
Receivers: The receivers collect telemetry from one or more sources. They can be pull or pushed based and may support one or more data sources. The grpc protocol is received on port 4317 and http protocol is received on 4318. By default, the 3 signals are consumed by the “otlp” receiver
Exporters: The exporters send data to one or more backends or destinations. In the yaml above we have defined 3 exporters: debug, Jaeger and associated endpoint, and Prometheus with the associated endpoint. The custom metric, discussed later, is exported to Prometheus.
Services.pipeline: The pipelines section is where the pipelines are configured. The pipeline consists of one of three types: traces, metrics, logs.
We now have everything ready to begin scraping telemetry data from WLS and the deployed
application. Now, we would like to provide more telemetry data than just what the zero-instrumentation agent provides. Let’s first look at how to add tracing spans to the the application code.
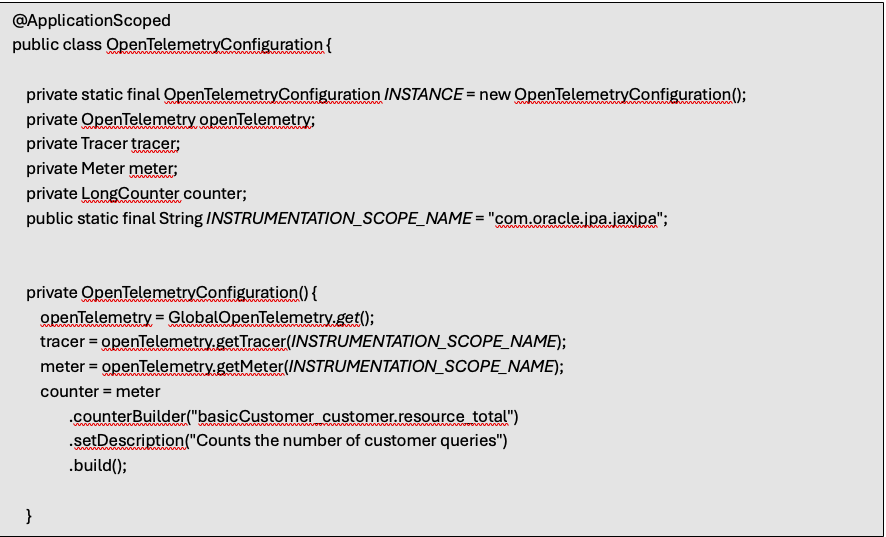
In the code shown above we are using the java management agent; therefore, there is no need to create the “SdkTracerProvider”, “OpenTelemetrySdk”, or create the “OtlpHttpSpanExporter” programmatically. The “WEBLOGIC_OTEL” environment variable provided the management agent to the application. To gain access to the “OpenTelemetry”, “Tracer”, and “Meter” a “get” request is sent to the “GlobalOpenTelemetry” class. The code above demonstrates how to gain access to these OpenTelemetry components.
The counter is created to demonstrate how to instantiate a custom “LongCounter” metric. Its usage will be demonstrated later in the document.
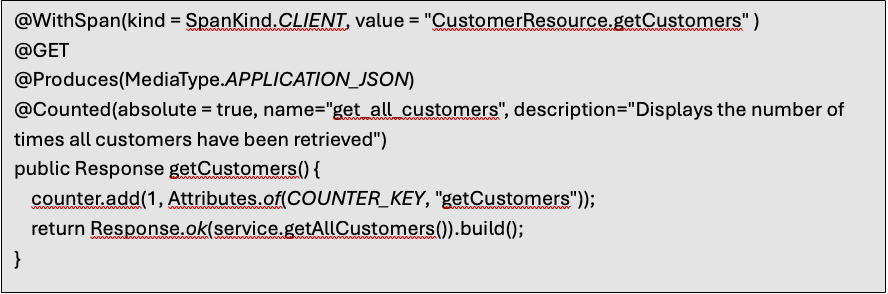
The code snippet below shows how to create a tracing span for the method. The annotation “@WithSpan” will generate a tracing span named “CustomerResource.getCustomers”. “@WithSpan” specifies the type of span and what name to give the span. Specifying a name makes it very easy to track individual spans in the dashboard.
After the application is deployed and exercised the span will be visible in the Jaeger dashboard as shown below.

You will also notice an interesting span above, named “my-service” (In future releases of the database, this name will more than likely be changed). Beginning with the new Oracle DB 23ai.V8, tracing spans are now captured in the database. This wonderful feature provides a measurement of how long we spent in the database.
There is another important feature that I want to point out that Oracle has provided with their JDBC database drivers. The database drivers now provide OpenTelemetry traces. Let’s have a look of what is available.
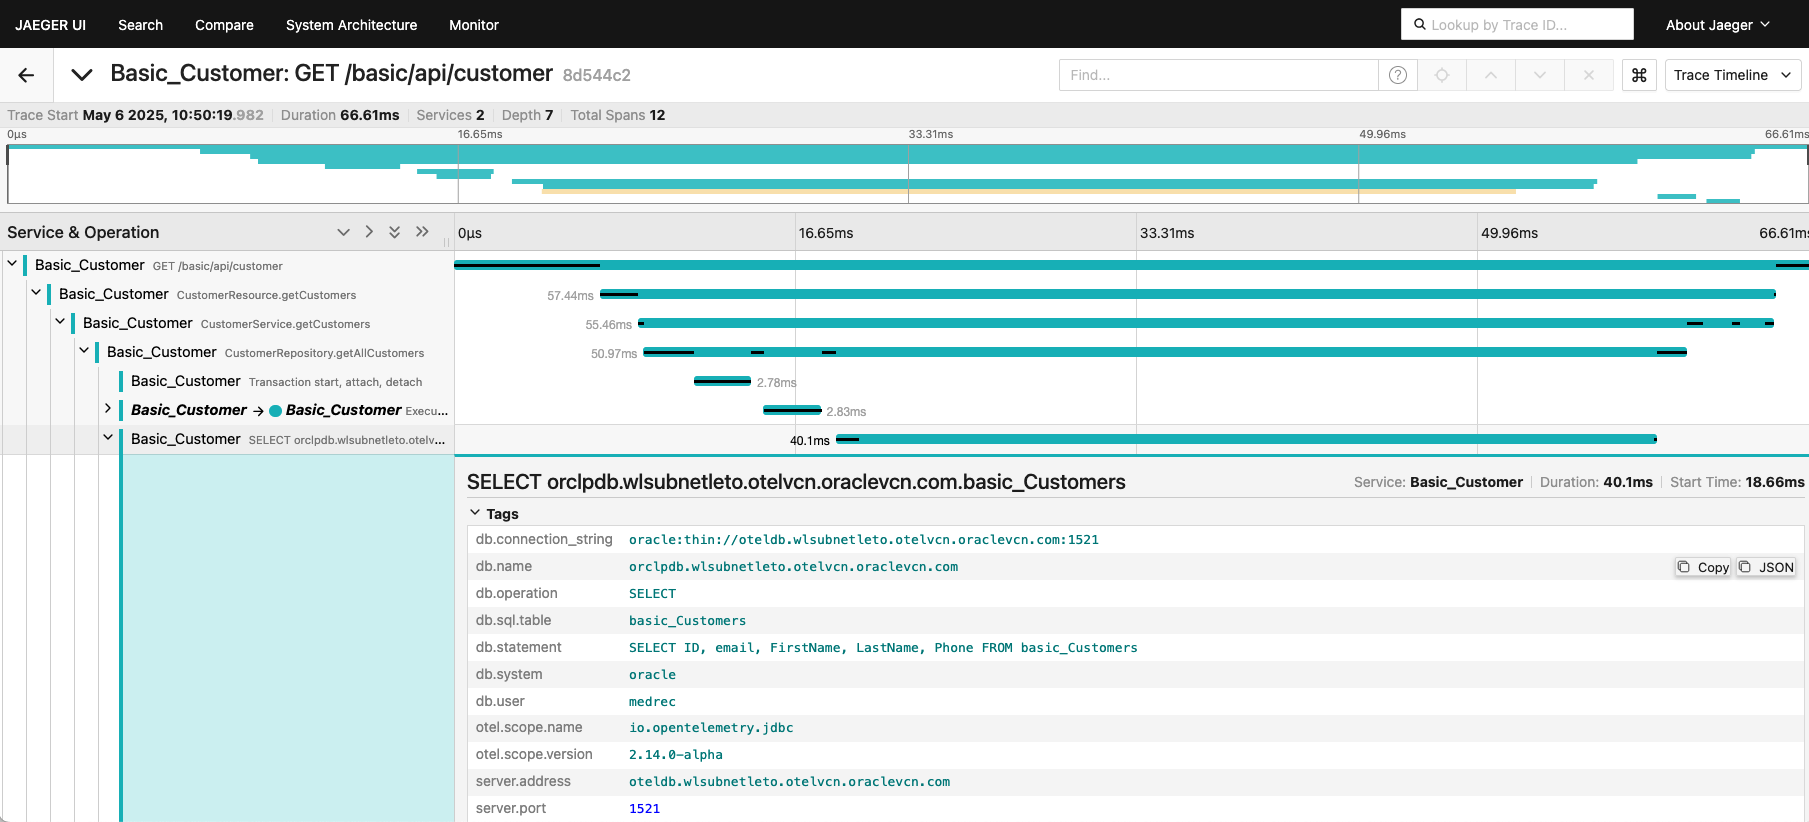
The expanded span shown above is provided by the JDBC driver. As a developer you don’t have to do anything in your application code to get these spans. Make sure you have provided the jars as demonstrated in the custom script, “enableOTEL.sh”. Also, make sure you have added the database connection pool properties shown earlier in this document.
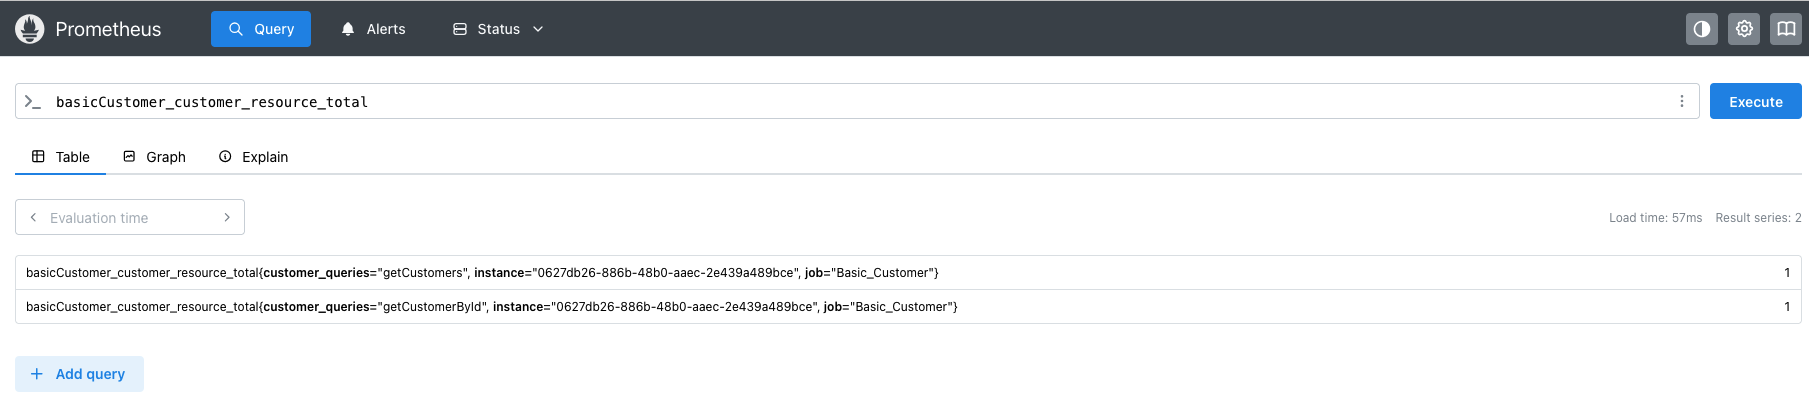
Let’s now have a peek at using OpenTelemetry metrics. I mentioned earlier about the use of LongCounter. For those familiar with the Prometheus API, a LongCounter is an OpenTelemetry metric equivalent to the metric Counter in Prometheus. This counter tabulates the total number of times a specific query is executed.
The metric is scraped by the OTel Collector and eventually exported to Prometheus. You can then do a search in Prometheus by the metric name. Shown in the Prometheus dashboard is the “basicCustomer_customer_resource_total” metric. This metric specifies an attribute of “customer_queries” and breaks them down by the specific SQL query executed. As shown below, there is one instance of “getCustomers”, and one instance of “getCustomerById”.
Obviously, this is just one of potential many custom metrics that you can add using the OpenTelemetry API.
Why OpenTelemetry
Observability and monitoring are not the same thing and is not just about a set of tools and practices. Each plays an important role in building more resilient, reliable, and efficient system management.
Observability definition from the Cloud Native Computing Foundation (CNCF):
- “Observability is a system property that defines the degree to which the system can generate actionable insights. It allows users to understand a system’s state from these external outputs and take (corrective) action.”
- “Computer systems are measured by observing low-level signals such as CPU time, memory, disk space, and higher-level and business signals, including API response times, errors, transactions per second, etc. These observable systems are observed (or monitored) through specialized tools, so-called observability tools.”
- “Observable systems yield meaningful, actionable data to their operators, allowing them to achieve favorable outcomes (faster incident response, increased developer productivity) and less toil and downtime.”
- “Consequently, the observability of a system will significantly impact its operating and development costs.”
A further definition and clarification from the OpenTelemetry project:
- Observability lets you understand a system from the outside, by letting us ask questions about that system without knowing its inner workings.
- To ask questions about your system, your application must be properly instrumented That is, the application code must emit signals such as traces, metrics, and logs. An application is properly instrumented when developers don’t need to add more instrumentation to troubleshoot an issue, because they have all the information they need.
Summary
Using OpenTelemetry, WebLogic Server, and the Oracle Database you can obtain telemetry data throughout the entire processing of the request. The three signals metrics, traces, and logs will help engineers, administrators, and DBAs obtain deeper insight into the overall performance of their application and database operations. In addition, the signals added to JDBC and the Oracle database helps the engineer breakdown how much time is spent in the code, in the database, and by deduction can determine how much time was spent traversing the network.
Using OpenTelemetry with Oracle WebLogic Server provides many benefits:
- A standard set of tools that are commonly used in cloud-native and non-cloud-native environments.
- A unified, vendor-neutral telemetry that enhances performance monitoring, accelerates troubleshooting, and supports proactive, data-driven operations across Enterprise Java applications.
- Broad community support.
- The OpenTelemetry suite of products can be easily used by WebLogic Server without requiring any modifications to the WLS product.
- Oracle has added OpenTelemetry to the Oracle database driver and db23aiV8.
- In OCI, traces can be shipped to OCI APM.
Be on the lookout for further blogs covering OpenTelemetry, WebLogic Server, and the Oracle database.