Elasticity (scaling up or scaling down) of a WebLogic Server cluster provides the benefits of being able to manage resources based on demand and enhances the reliability of customer applications while managing resource costs. There are different ways to trigger the automatic scaling of WebLogic Server clusters in a Kubernetes environment. The architecture of the WebLogic Server Elasticity component as well as a detailed explanation of how to scale up a WebLogic cluster using a WebLogic Diagnostic Framework (WLDF) policy can be found in the Configuring and Using the Diagnostics Framework for Oracle WebLogic Server documentation.
In this demo, we demonstrate another way to automatically scale a WebLogic cluster on Kubernetes, by using Prometheus. Since Prometheus has access to all available WebLogic metrics data, user has flexibility to use any of it to specify the rules for scaling. Based on collected metrics data and configured alert rule conditions, Prometheus’s Alert Manager will send an alert to trigger the desired scaling action and change the number of running Managed Servers in the WebLogic Server cluster.
We use the WebLogic Monitoring Exporter to scrape runtime metrics for specific WebLogic Server instances and feed them to Prometheus. We also implement a custom notification integration using the webhook receiver, a user-defined REST service that is triggered when a scaling alert event occurs. After the alert rule matches the specified conditions, the Prometheus Alert Manager sends an HTTP request to the URL specified as a webhook to request the scaling action. For more information about the webhook used in the sample demo, see adnanh/webhook/.
In this blog, you will learn how to configure Prometheus, Prometheus Alert Manager, and a webhook to perform automatic scaling of WebLogic Server instances running in Kubernetes clusters.
This picture shows all the components running in the pods in the Kubernetes environment:
The WebLogic domain, running in a Kubernetes cluster, consists of:
-
An Administration Server (AS) instance, running in a Docker container, in its own pod (POD 1).
-
A WebLogic Server cluster, composed of a set of Managed Server instances, in which each instance is running in a Docker container in its own pod (POD 2 to POD 5).
-
The WebLogic Monitoring Exporter web application, deployed on a WebLogic Server cluster.
Additional components, running in a Docker container, in their own pod are:
-
Prometheus
-
Prometheus Alert Manager
-
WebLogic Kubernetes Operator
-
Webhook server
Installation and Deployment of the Components in the Kubernetes Cluster
Follow the installation instructions to create the WebLogic Kubernetes Operator and Creating and Managing WebLogic domains to provision the WebLogic domain. In this blog, we will be using the following parameters to create the WebLogic Kubernetes Operator (operator) and WebLogic domain:
1. Deploy the WebLogic Kubernetes Operator (create-weblogic-operator.sh)
- In create-operator-inputs.yaml:
serviceAccount: weblogic-operator
targetNamespaces: domain1
namespace: weblogic-operator
weblogicOperatorImage: container-registry.oracle.com/middleware/weblogic-kubernetes-operator:latest
weblogicOperatorImagePullPolicy: IfNotPresent
externalRestOption: SELF_SIGNED_CERT
externalRestHttpsPort: 31001
externalSans: DNS:slc13kef
externalOperatorCert:
externalOperatorKey:
remoteDebugNodePortEnabled: false
internalDebugHttpPort: 30999
externalDebugHttpPort: 30999
javaLoggingLevel: INFO
2. Create and start a domain (create-domain-job.sh)
- In create-domain-job-inputs.yaml:
domainUid: domain1
managedServerCount: 4
managedServerStartCount: 2
namespace: weblogic-domain
adminPort: 7001
adminServerName: adminserver
startupControl: AUTO
managedServerNameBase: managed-server
managedServerPort: 8001
weblogicDomainStorageType: HOST_PATH
weblogicDomainStoragePath: /scratch/external-domain-home/pv001
weblogicDomainStorageReclaimPolicy: Retain
weblogicDomainStorageSize: 10Gi
productionModeEnabled: true
weblogicCredentialsSecretName: domain1-weblogic-credentials
exposeAdminT3Channel: true
adminNodePort: 30701
exposeAdminNodePort: true
namespace: weblogic-domain
loadBalancer: TRAEFIK
loadBalancerWebPort: 30305
loadBalancerDashboardPort: 30315
3. Run this command to identify the admin NodePort to access the console :
kubectl -n weblogic-domain describe service domain1-adminserver
weblogic-domain – is the namespace where the WebLogic domain pod is deployed.

Previous blog entries have described how to start and run WebLogic Server instances in Kubernetes with the WebLogic Monitoring Exporter deployed on Managed Servers running in the cluster. In this blog we use web application version of WebLogic Monitoring Exporter. An alternative way of deploying the WebLogic Monitoring Exporter is that where the operator injects the Monitoring Exporter to a sidecar, please refer to the documentation Using the WebLogic Monitoring Exporter with the Operator.
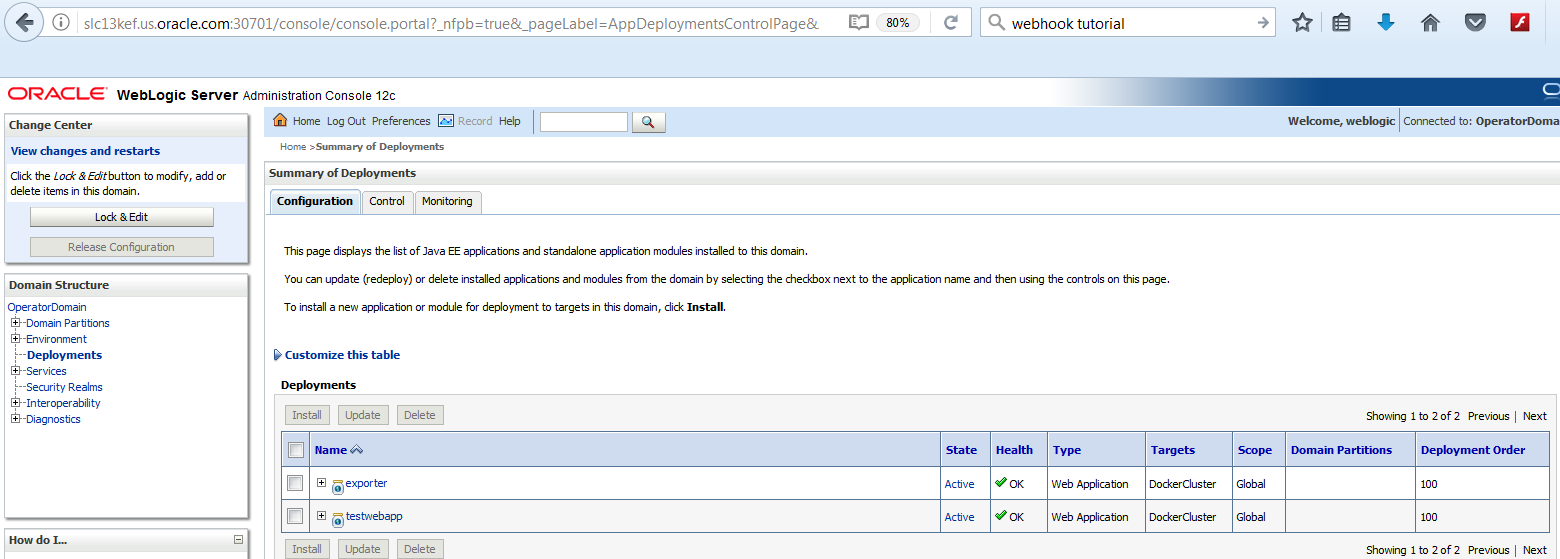
Access the WebLogic Server Administration Console at this URL, http://[hostname]:30701/console, using the WebLogic credentials (used when provisioning the WebLogic domain). In our example, we setup an alert rule based on the number of the opened sessions produced by this web application, “testwebapp.war”. Deploy the testwebapp.war application and WebLogic Monitoring Exporter “wls-exporter.war” to DockerCluster.
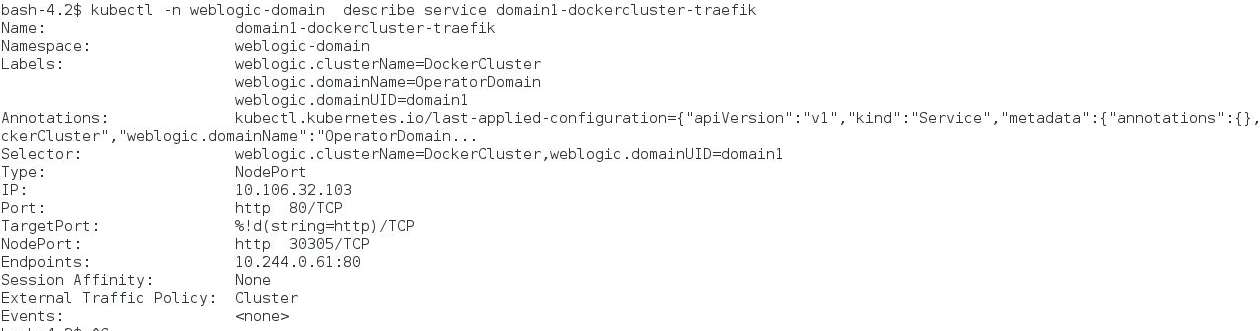
Review the DockerCluster NodePort for external access:
kubectl -n weblogic-domain describe service domain1-dockercluster-traefik
To make sure that the WebLogic Monitoring Exporter is deployed and running, access the application with a URL like the following:
http://[hostname]:30305/wls-exporter/metrics
You will be prompted for the WebLogic user credentials that are required to access the metrics data, <weblogic-user>/<weblogic-password>. The metrics page will show the metrics configured for the WebLogic Monitoring Exporter:
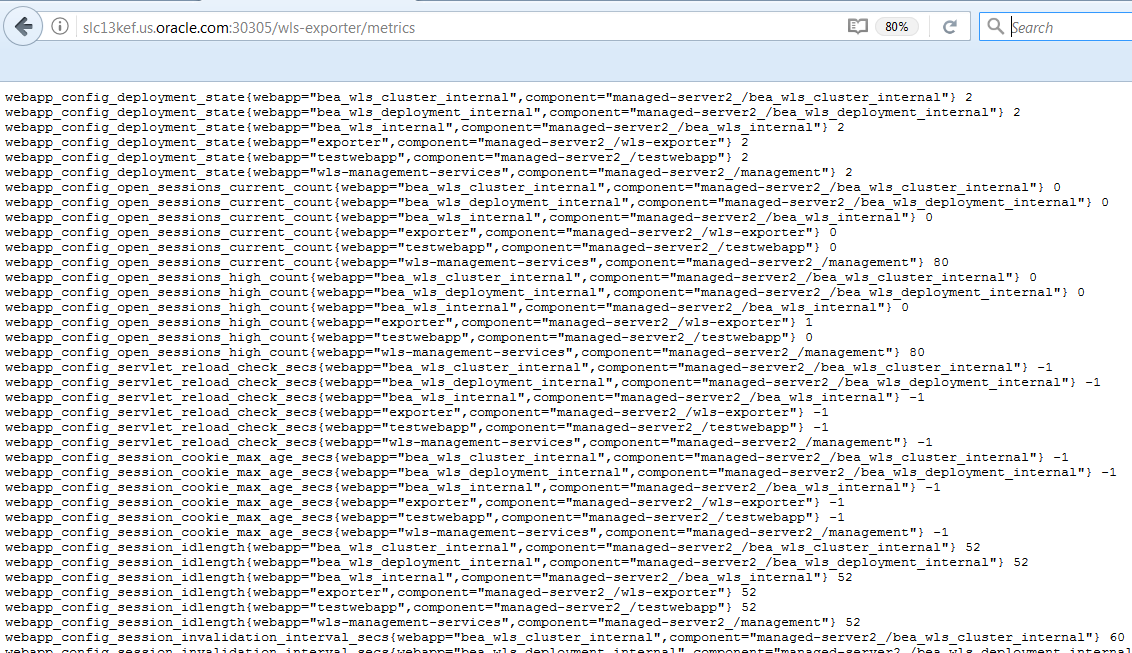
Make sure that the alert rule you want to setup in the Prometheus Alert Manager matches the metrics configured for the WebLogic Exporter. Here is an example of the alert rule we used:
if sum(webapp_config_open_sessions_current_count{webapp=”testwebapp”) > 15 ;The metric used, ‘webapp_config_open_sessions_current_count’, should be listed on the metric’s web page.
Setting Up the Webhook for Alert Manager
We used this webhook application in our example. To build the Docker image, create this directory structure:
– apps
-scripts
-webhooks
1. Copy the webhook application executable file to the ‘apps’ directory and copy the scalingAction.sh script to ‘scripts’ directory.
Create a scaleUpAction.sh file in the ‘scripts’ directory and edit it with the code listed below:
#!/bin/bash
echo scale up action >> scaleup.log
MASTER=https://$KUBERNETES_SERVICE_HOST:$KUBERNETES_SERVICE_PORT
echo Kubernetes master is $MASTER
source /var/scripts/scalingAction.sh --action=scaleUp --domain_uid=domain1 --cluster_name=DockerCluster --kubernetes_master=$MASTER --wls_domain_namespace=domain1
2. Create a Docker file for the webhook, Docker.webhook, as suggested:
FROM store/oracle/serverjre:8
COPY apps/webhook /bin/webhook
COPY webhooks/hooks.json /etc/webhook/
COPY scripts/scaleUpAction.sh /var/scripts/
COPY scripts/scalingAction.sh /var/scripts/
CMD ["-verbose", "-hooks=/etc/webhook/hooks.json", "-hotreload"]
ENTRYPOINT ["/bin/webhook"]
3. Create hooks.json file in the webhooks directory, for example:
[
{
"id": "scaleup",
"execute-command": "/var/scripts/scaleUpAction.sh",
"command-working-directory": "/var/scripts",
"response-message": "scale-up call ok\n"
}
]
4. Build the ‘webhook’ Docker image:
docker rmi webhook:latest
docker build -t webhook:latest -f Dockerfile.webhook .
Deploying Prometheus, Alert Manager, and Webhook
We will run Prometheus, the Alert Manager and the webhook pods under the namespace ‘monitoring’. Execute the following command to create a ‘monitoring’ namespace:
kubectl create namespace monitoringTo deploy a Prometheus instance in Kubernetes, create a Prometheus configuration file, prometheus-kubernetes.yml. A sample file is provided here.
The example of the Prometheus configuration file specifies:
– <weblogic-user>/<weblogic-password> WebLogic credentials as the user credentials
– Five seconds as the interval between updates of WebLogic Server metrics
– 32000 as the external port to access the Prometheus dashboard
– scaling rules:
ALERT scaleup
if sum(webapp_config_open_sessions_current_count{webapp=”testwebapp”}) > 15
ANNOTATIONS {
summary = "Scale up when current sessions is greater than 15",
description = "Firing when total sessions active greater than 15" }
– Alert Manager is configured to listen port 9093
As required, you can change these values to reflect your specific environment and configuration. You can also change the Alert Rule by constructing Prometheus-defined queries matching your elasticity needs.
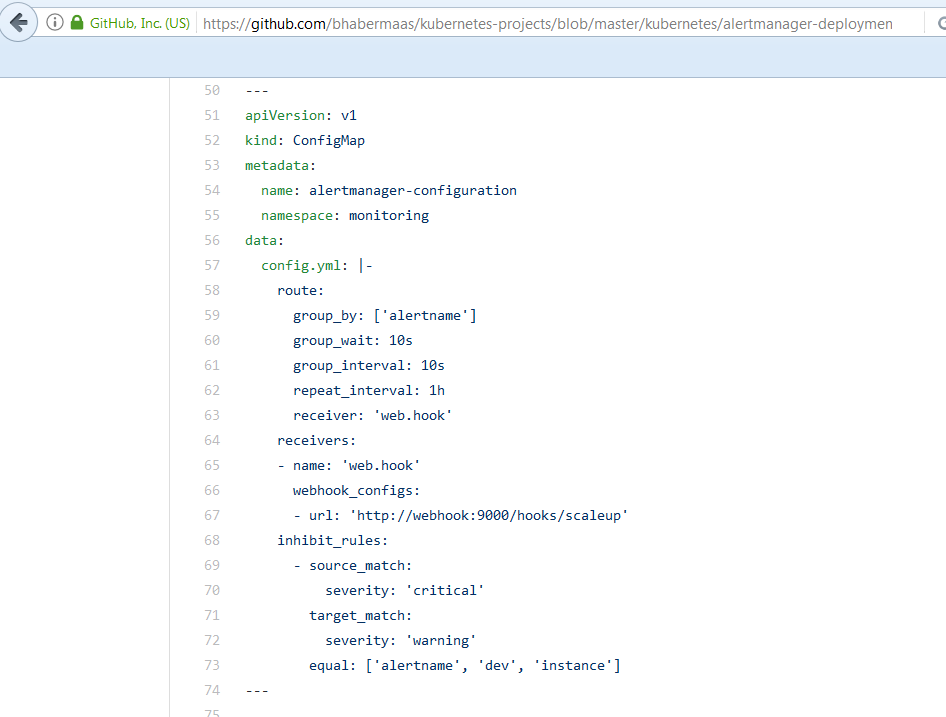
To generate alerts, we need to deploy the Prometheus Alert Manager as a separate pod, running in the Docker container. In our provided sample Prometheus Alert Manager configuration file, we use the webhook:
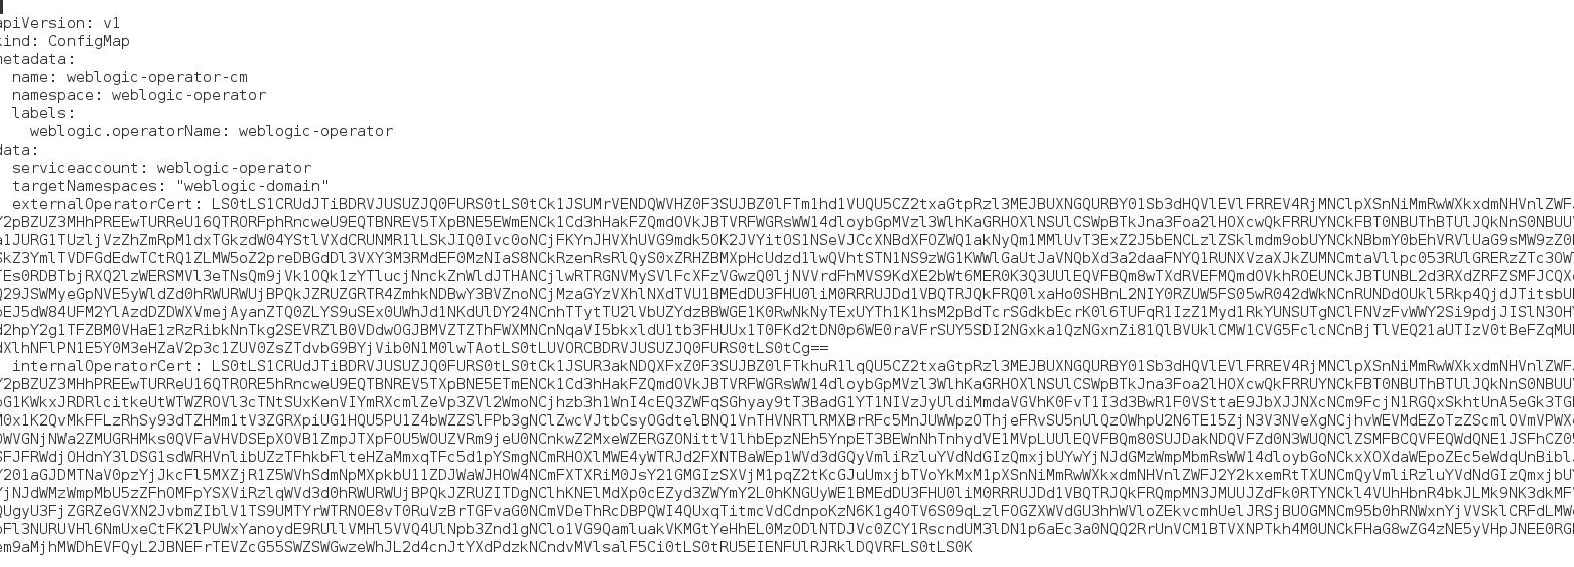
Update the ‘INTERNAL_OPERATOR_CERT’ property from the webhook-deployment.yaml file with the value of the ‘internalOperatorCert’ property from the generated weblogic-operator.yaml file, used for WebLogic Kubernetes Operator deployment, for example:
Start the webhook, Prometheus, and the Alert Manager to monitor the Managed Server instances:
kubectl apply -f alertmanager-deployment.yaml
kubectl apply –f prometheus-deployment.yaml
kubectl apply –f webhook-deployment.yaml
Verify that all the pods are started:
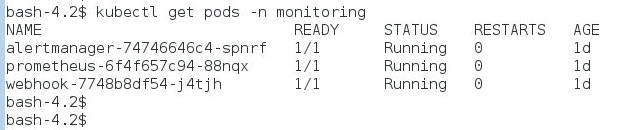
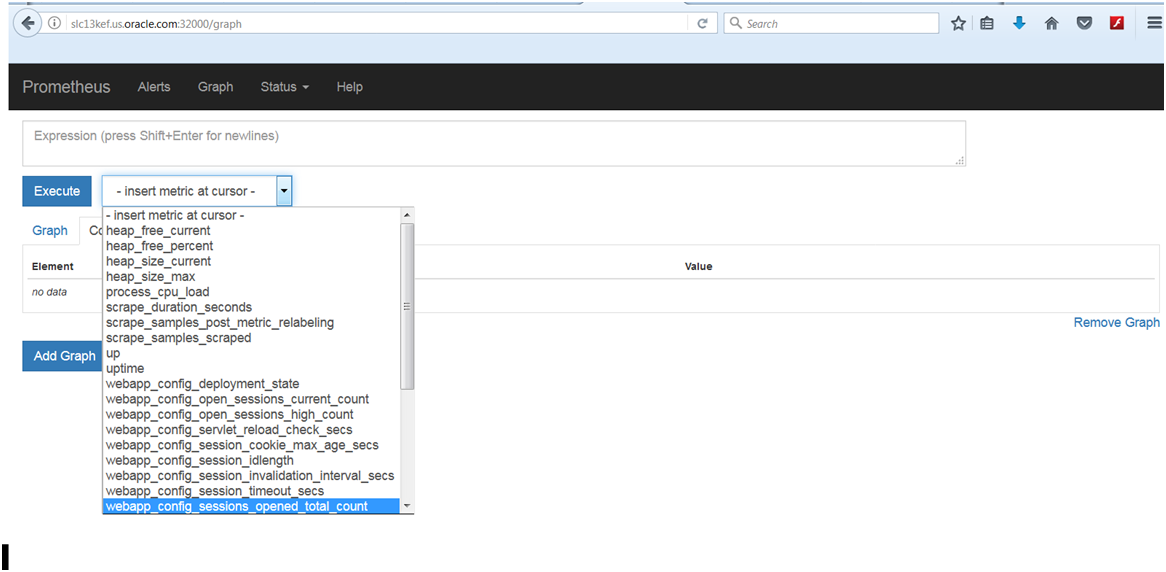
Check that Prometheus is monitoring all Managed Server instances by browsing to http://[hostname]:32000.
Examine the Insert metric at cursor pull-down menu. It should list the metric names based on the current configuration of the WebLogic Monitoring Exporter web application.
You can check the Prometheus Alert Setting by accessing this URL, http://[hostname]:32000/alerts:
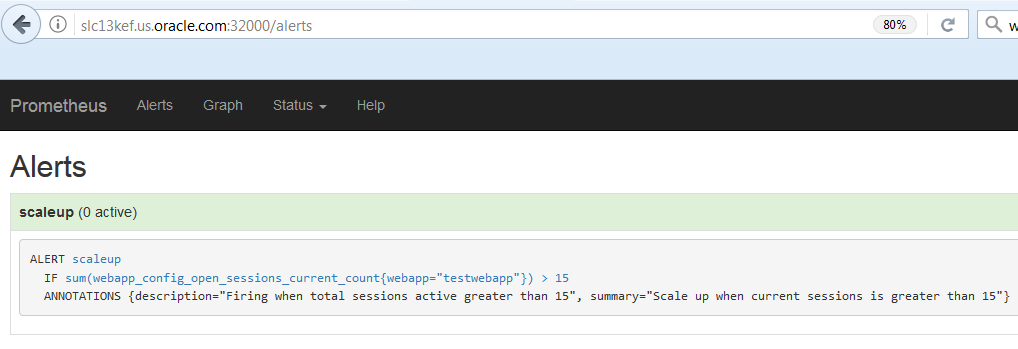
It should show the configured rule, listed in the prometheus-deployment.yaml configuration file.
Auto Scaling of WebLogic Clusters in K8s
In this demo, we configured each WebLogic Server cluster to have two running Managed Server instances, with a total number of Managed Servers equal to four. You can modify the values of these parameters, configuredManagedServerCount and initialManagedServerReplicas, in the create-domain-job-inputs.yaml file, to reflect your desired number of Managed Servers running in the cluster and maximum limit of allowed replicas.
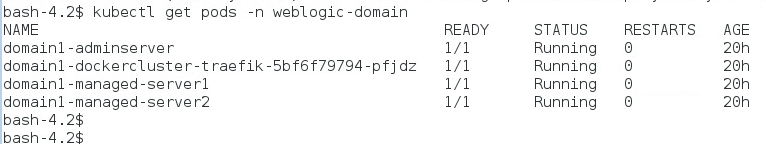
Per our sample file configuration, initially we have only two Managed Servers pods started. Let’s check all the running pods now:
Per our configuration in the Alert Rule, the scale up will happen when the number of open session for the application ‘testwebapp’ on the cluster is more than 15. Let’s invoke the application URL 17 times using curl.sh:
#!/bin/bash
COUNTER=0
MAXCURL=17
while [ $COUNTER -lt $MAXCURL ]; do
OUTPUT="$(curl http:/$1:30305/testwebapp/)"
if [ "$OUTPUT" != "404 page not found" ]; then
echo $OUTPUT
let COUNTER=COUNTER+1
sleep 1
fi
done
Issue the command:
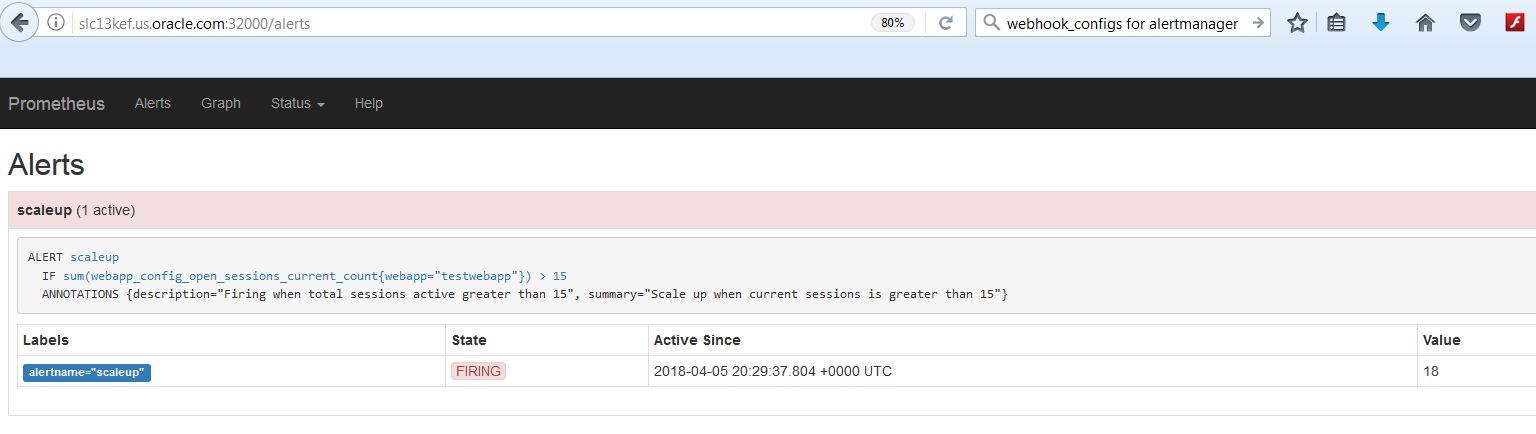
. ./curl.sh [hostname]When the sum of open sessions for the “testwebapp” application becomes more than 15, Prometheus will fire an alert via the Alert Manager. We can check the current alert status by accessing this URL, http://[hostname]:32000/alert
To verify that the Alert Manager sent the HTTP POST to the webhook, check the webhook pod log:
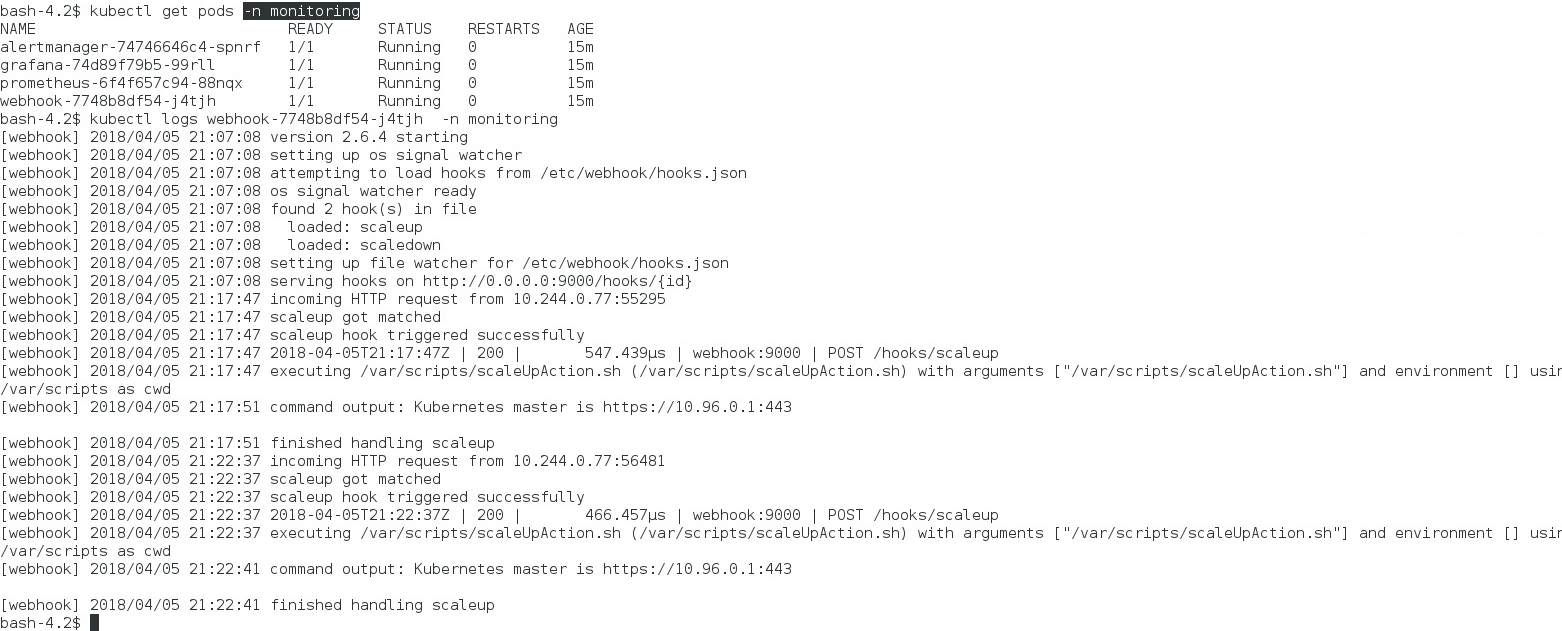
When the hook endpoint is invoked, the command specified by the “execute-command” property is executed, which in this case is the shell script, /var/scripts/scaleUpAction.sh. The scaleUpAction.sh script passes the parameters for the scalingAction.sh script, provided by the WebLogic Kubernetes Operator. The scalingAction.sh script issues a request to the Operator Service REST URL for scaling.
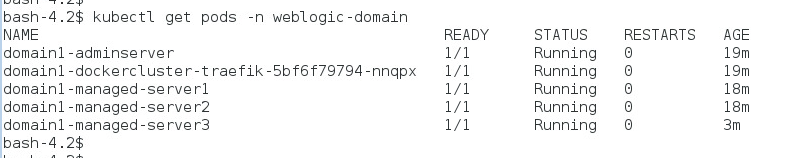
To verify the scale up operation, let’s check the number of running Managed Server pods. It should be increased to a total of three running pods:
Summary
In this blog, we demonstrated how to use the Prometheus integration with WebLogic Server to trigger the automatic scaling of WebLogic Server clusters in a Kubernetes environment. The WebLogic Server cluster can be automatically scaled by increasing (or decreasing) the number of pods based on a very comprehensive set of WebLogic domain-specific (custom) metrics monitored and analyzed by Prometheus. Our sample demonstrates that in addition to being a great monitoring tool, Prometheus can easily be configured for WebLogic Server cluster scaling decisions.