Introduction

This blog is about making your Java code go faster, without any code changes, just by using a specific version of the Java runtime.
I am writing a series of blogs on using different languages to access Oracle databases [eg Python, Node.js, Rust and Julia]. This week, I thought that I would cover Java JDBC.
Java is not my first choice of language, and I have been using JDK 8 for many years, so I thought that I would try out some of the newer Java JDKs. I got side tracked from my intended JDBC topic as I was surprised by the performance of one of the newer JDKs. So this blog become a comparison of recent JDKs using two micro benchmarks.
The JDKs covered were:
- Oracle JDK 1.8.0_351-b10
- Oracle JDK 11.07
- OpenJDK 19.0.1
- GraalVM CE JDK 19.0.1
- GraalVM EE JDK 19.0.1
- GraalVM CE Native Image 19.0.1
- GraalVM EE Native Image 19.0.1
This blog covers the following topics:
- The two micro menchmarks that I created
- The results
- My Java source code
- How I did the builds and tests
- How I calculated the results
- Summary
This blog is not a tutorial on the Java language, nor the many features of the GraalVM. This is also not a blog on how to download and configure various JDKs.
I also did the same benchmarks for many other popular runtime languages. I will eventually get back to using Java JDBC with Oracle Databases.
My micro benchmarks
After I got the mandatory ‘hello world’ working with the latest JDK, I wondered whether the marketing claims of newer JDKs are faster were true. I also wanted to try out GraalVM as I had heard of it, but I had never tried it before.

I needed some trivial Java workloads to compare the various JDKs that I was interested in. I am not interested in training neural networks nor simulating the big bang. Instead, I care deeply about fast access to SQL databases. I do not want to get distracted by things like Java reflection, exception handling nor generics. Before I got too deep into JDBC benchmarking, I wanted something simple that I could write in 10 minutes. After 10 minutes, I ended up with some trivial code to do some string processing and simple maths:
- Calculate the Fibonacci sequence with an input of 1475, repeated one million times
- Some trivial string processing with String and StringBuffer. ie creating, concatenating and using substrings for strings under 2000 characters with a huge number of iterations
How valid are these results
Micro benchmarks are by definition only relevant to the specific workload that they cover. These workloads do not try to cover everything, they only cover what I care about. The only workload that matters to you is your workload. So try your own workloads with the newer JDKs. I have found that string processing and simple maths are important to enable fast SQL database drivers, so that is what I tested.

Results
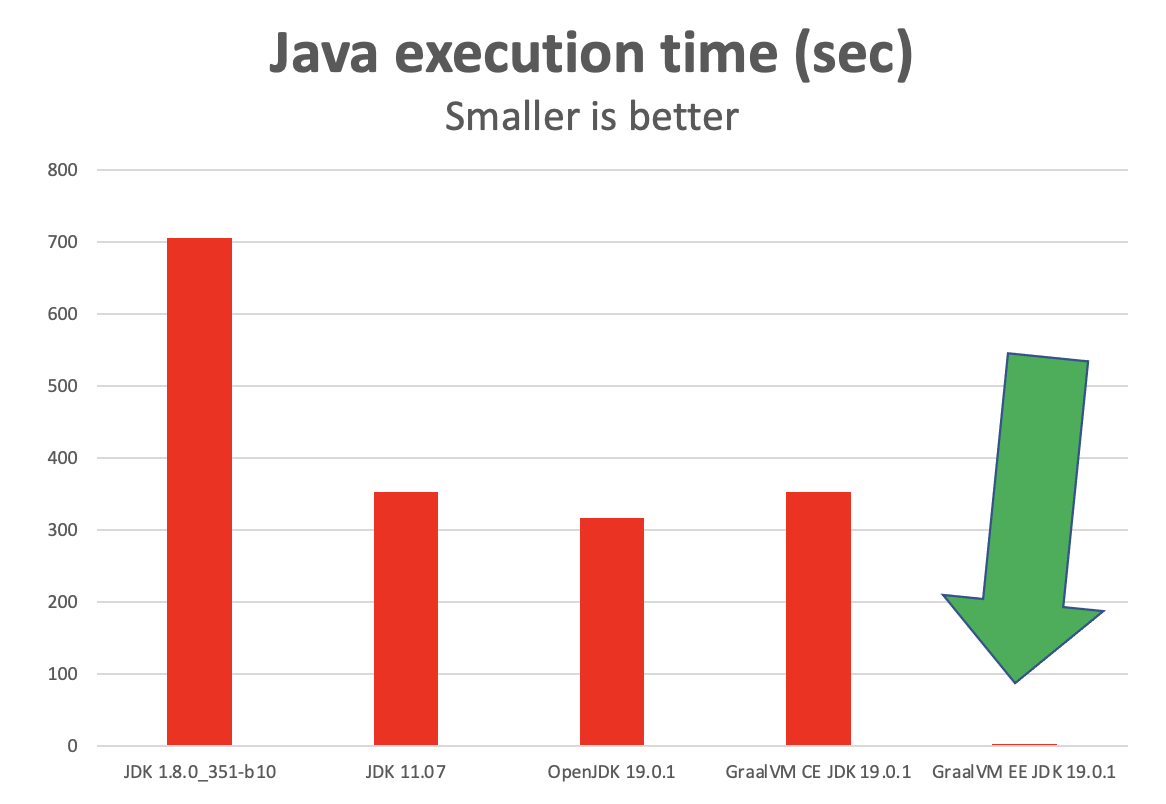
- JDK 8 took the longest to run my combined micro benchmarks
- JDK 11 was about twice as fast as JDK 8 to run the same workload
- OpenJDK 19 was slightly faster than JDK 11 to run the same workload
- GraallVM Community Edition 19.0.1 was actually slower than OpenJDK 19 for the same workload
- GraalVM Enterprise Edition 19.0.1 was significantly faster than all of the other runtimes
- It was between 131x to 293x faster !!!
- This Java code running in JIT mode was almost as fast as my optimized C code for this workload
Why was GraallVM Enterprise Edition 19.0.1 so much faster than other runtimes? I assume that the developers were effective in using more aggressive optimizations and licensed the product accordingly.
The results look fairly definitive, but the reality is more complicated than that.
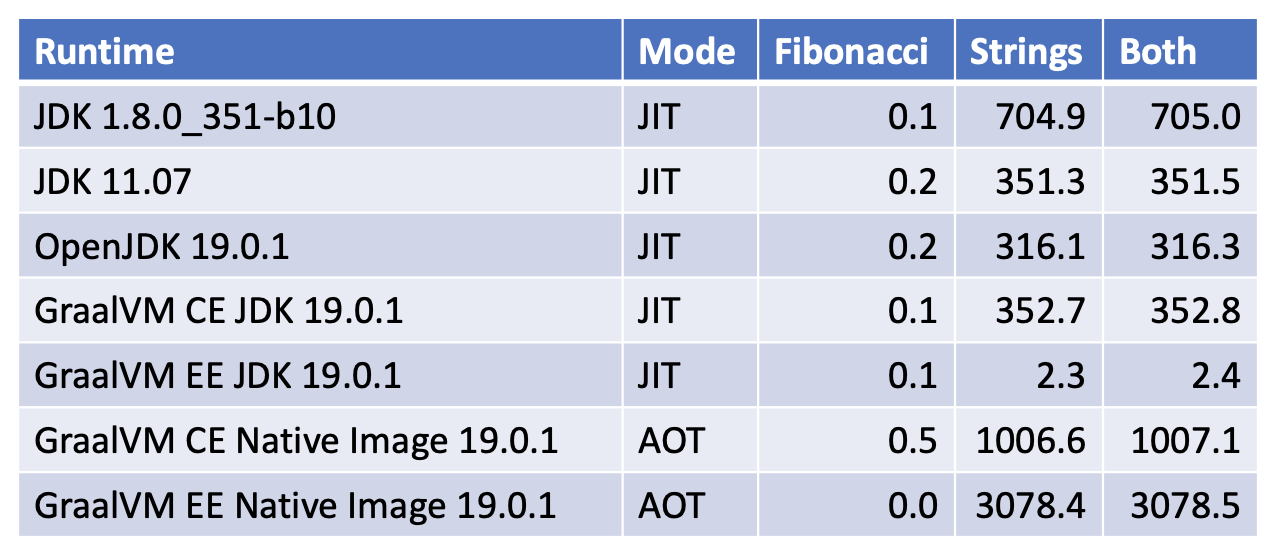
I had naively assumed that using AOT [ahead of time] compilation would give better results than JIT mode. This turned out not to be true for these micro benchmarks. Both the community and enterprise editions of native image compilation were signifcantly slower than GraallVM Community Edition 19.0.1 when run in JIT mode. Are these results true for any Java workload, or specific to my microbenchmarks? I do not know. Try GraallVM Enterprise Edition 19.0.1 in both JIT and AOT modes yourself using your workloads.
Maybe in the future, you will have the option to minimize startup time, or to maximize runtime performance with GraalVM native image?

The Java native-image [ahead of time] compiler was designed with three goals:
- To create a standalone executable which can run independently of the Java runtime
- To minimize the startup time of this executable
- Lower runtime memory overhead compared to the Java runtime
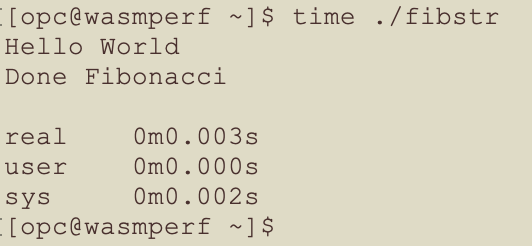
For my micro benchmarks, all three goals were achieved:
- A Linux x8664 ELF image was created
- The time to start the process, execute the fibonacci method and exit was about three milliseconds
- The VIRT memory [measured by top] of running the executable was about 0.13 GB vs about 32 GB using the Java runtimes
Of the three Java methods, long_strings took 99% of the execution time. Was I weighting the workload to give good Java results? Nope, I originally ran this workload to compare Oracle PLSQL vs C code. For this PLSQL vs C code test, I balanced the number of iterations of the three functions to enable easy measurement of my C code. ie I needed to do sufficient iterations to measure the work in the C code vs the overhead of starting and stopping the process in which it ran. I will cover the PLSQL vs C code results in a follow-up blog.
My trivial Java source code
The Main method
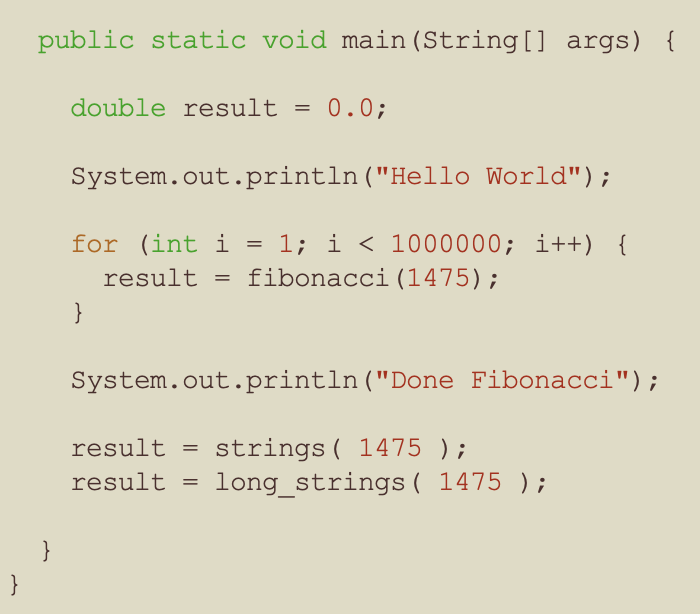
- The fibonacci method has an input of 1475 and was called one million times
- Why 1475, to avoid integer overflow in some of the other languages which I tested this workload against
- Both the strings and long_strings methods are called with an input of 1475
- Why am I not using a static const variable for 1475, just because
The Fibonacci Method
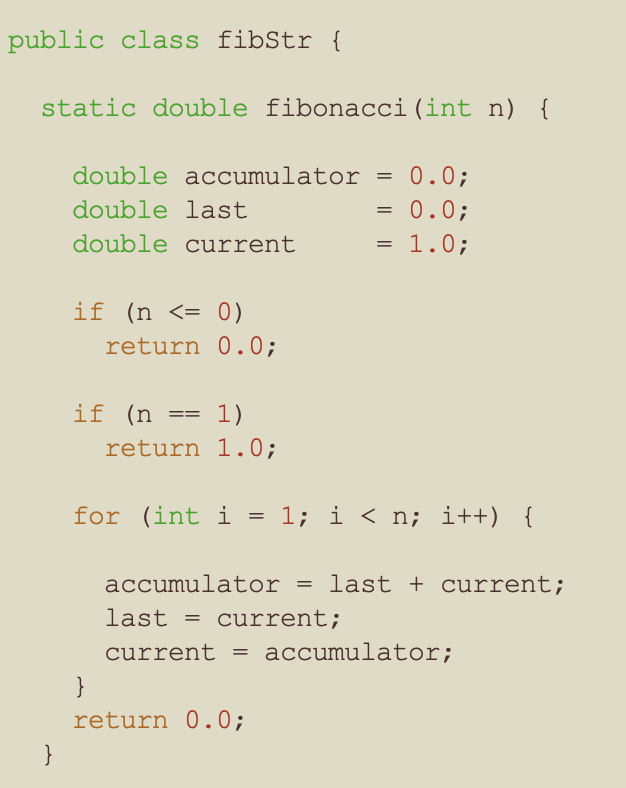
Why am I using a double for the variables?
- The values of the Fibonacci sequence rapidly get larger
- I also implemented these micro benchmarks in many other languages
- Some of these languages had issues with integer overflow for large values in the Fibonacci sequence
- So I used the type double to be fair and consistent across all of the languages
strings method
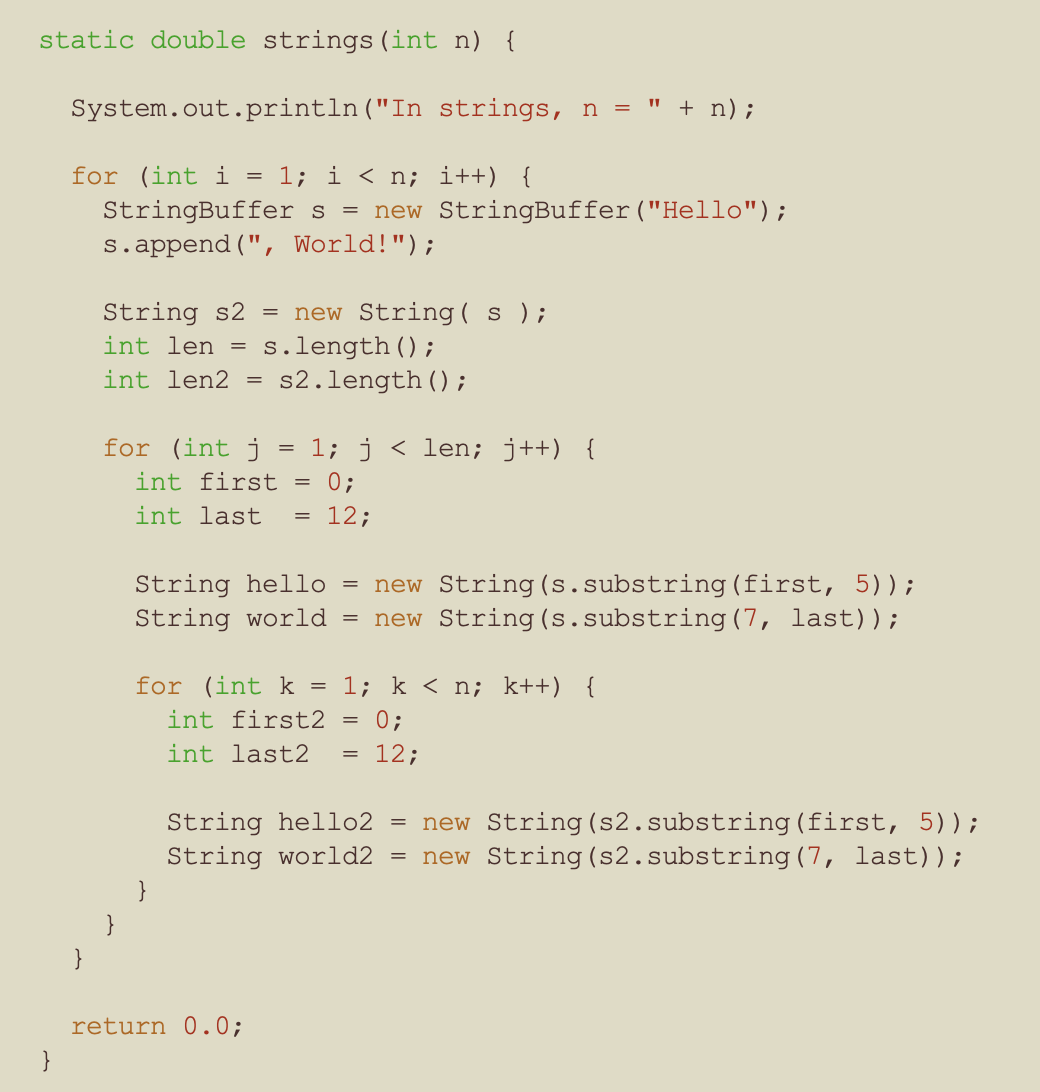
- This method does some trivial operations on Strings and StringBuffers
- The operations include constructors, append, length, substring and copy
- There are three nested loops, so the operations in the inner-most loop are executed about 26 million times
- 1475 * 12 * 1475 = 26,107,500
- n = 1475
- The string length is 12 characters
The long_strings method part 1
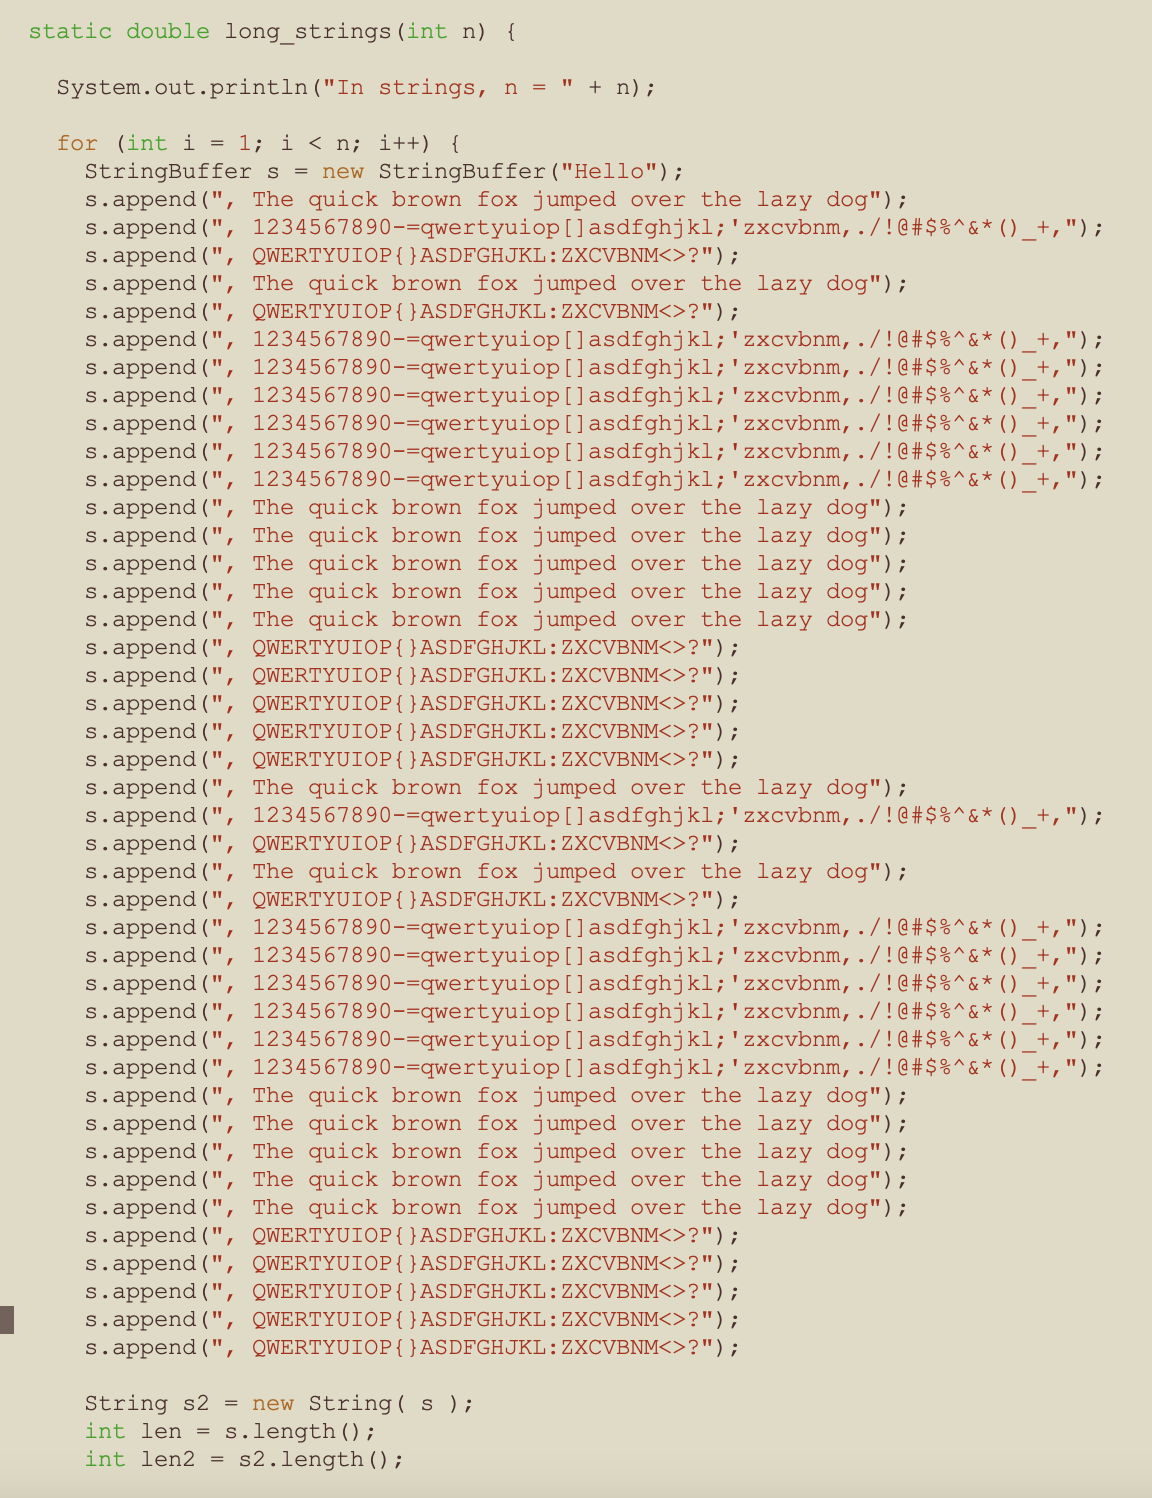
The logic for method long_strings was the same as for method strings, but there were significantly more StringBuffer concatenation operations.
- The fully appended StringBuffer is 1965 bytes long
- Why did I not initially create the StringBuffer with more than 1965 bytes?
- I wanted to make the comparisons with other languages fair and consistent
- I am not trying to optimize the code for this workload, I am trying to see how common / ‘bad’ code performs
- The number of iterations of the String and StringBuffer operations is significantly larger
- This also creates the opportunity of garbage collection
The long_strings method part 2
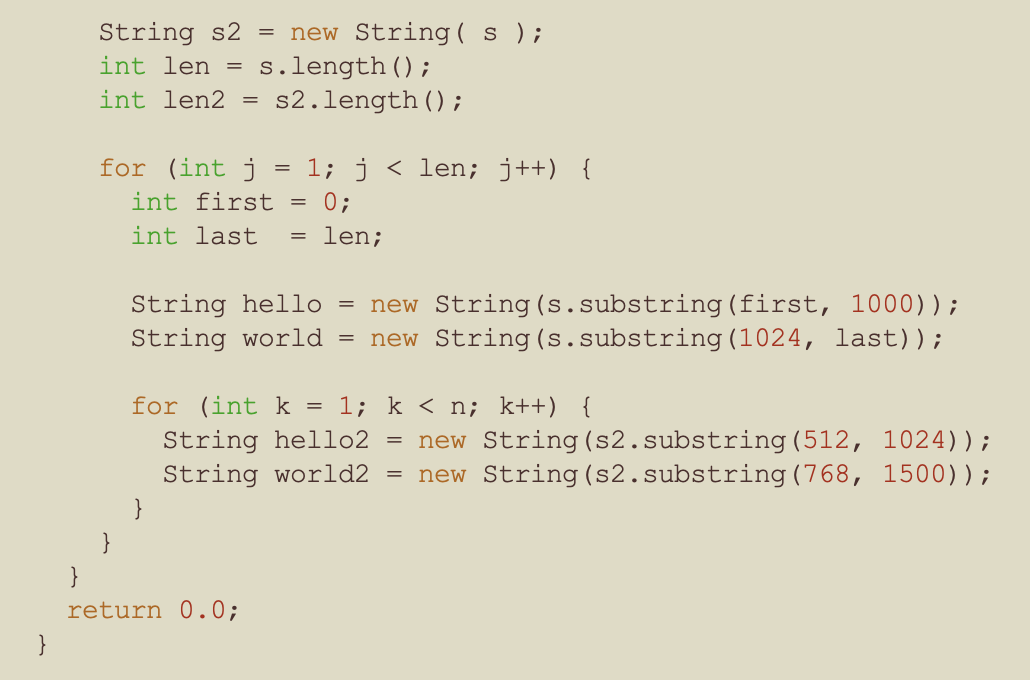
- The ‘j’ for loop iterates based on the length of the string, ie 1965 times
- The ‘k’ for loop iterates n times, ie 1475
- The outer ‘i’ for loop also iterates n times, ie 1475
- 1475 * 1965 * 1475 = 4,275,103,125 iterations
- So there are 4.2 billion iterations of the ‘k’ loop which creates Strings from substrings
My environment
I repeated these tested on two different machines:
- Oracle Linux 8.6 on Oracle Cloud. 4 OCPU with 128 GB RAM
- Ubuntu 22.04 on Oracle Cloud. 4 OCPU with 128 GB RAM
- As these were VMs, to avoid the risk of a noisey neighbor, I repeated the tests many times over three days
- My micro benchmarks were not doing any disk nor network IO. Instead they were CPU bound for a single threaded workload.
- As measured by ‘top‘, the VIRT and RSS memory was stable for the duration of the tests and there was an abundance of RAM
- VIRT was about 32 GB and the VMs had 128 GB of RAM
- I was not running any other workload on the VMs apart from ‘top’
- I followed the instructions to install and configure GraalVM Native Image
- GCC 8.5.0 was used by GraalVM Native Image on my Oracle Linux VM
How I built and ran each test
For jdk 1.8.0_351
- java -version
- javac fibStr.java
- time java fibStr
For jdk 11.0.17
- java -version
- javac fibStr.java
- time java fibStr
For OpenJdk 19.0.1
- java -version
- javac fibStr.java
- time java fibStr
For jdk 19.0.1 from graalvm-ce-java19-22.3.0
- java -version
- javac fibStr.java
- time java fibStr
For jdk 19.0.1 from graalvm-ee-java19-22.3.0
- java -version
- javac fibStr.java
- time java fibStr
For jdk 19.0.1 Native-Image from graalvm-ce-java19-22.3.0 Community Edition
- java -version
- javac fibStr.java
- native-image fibStr
- time ./fibstr
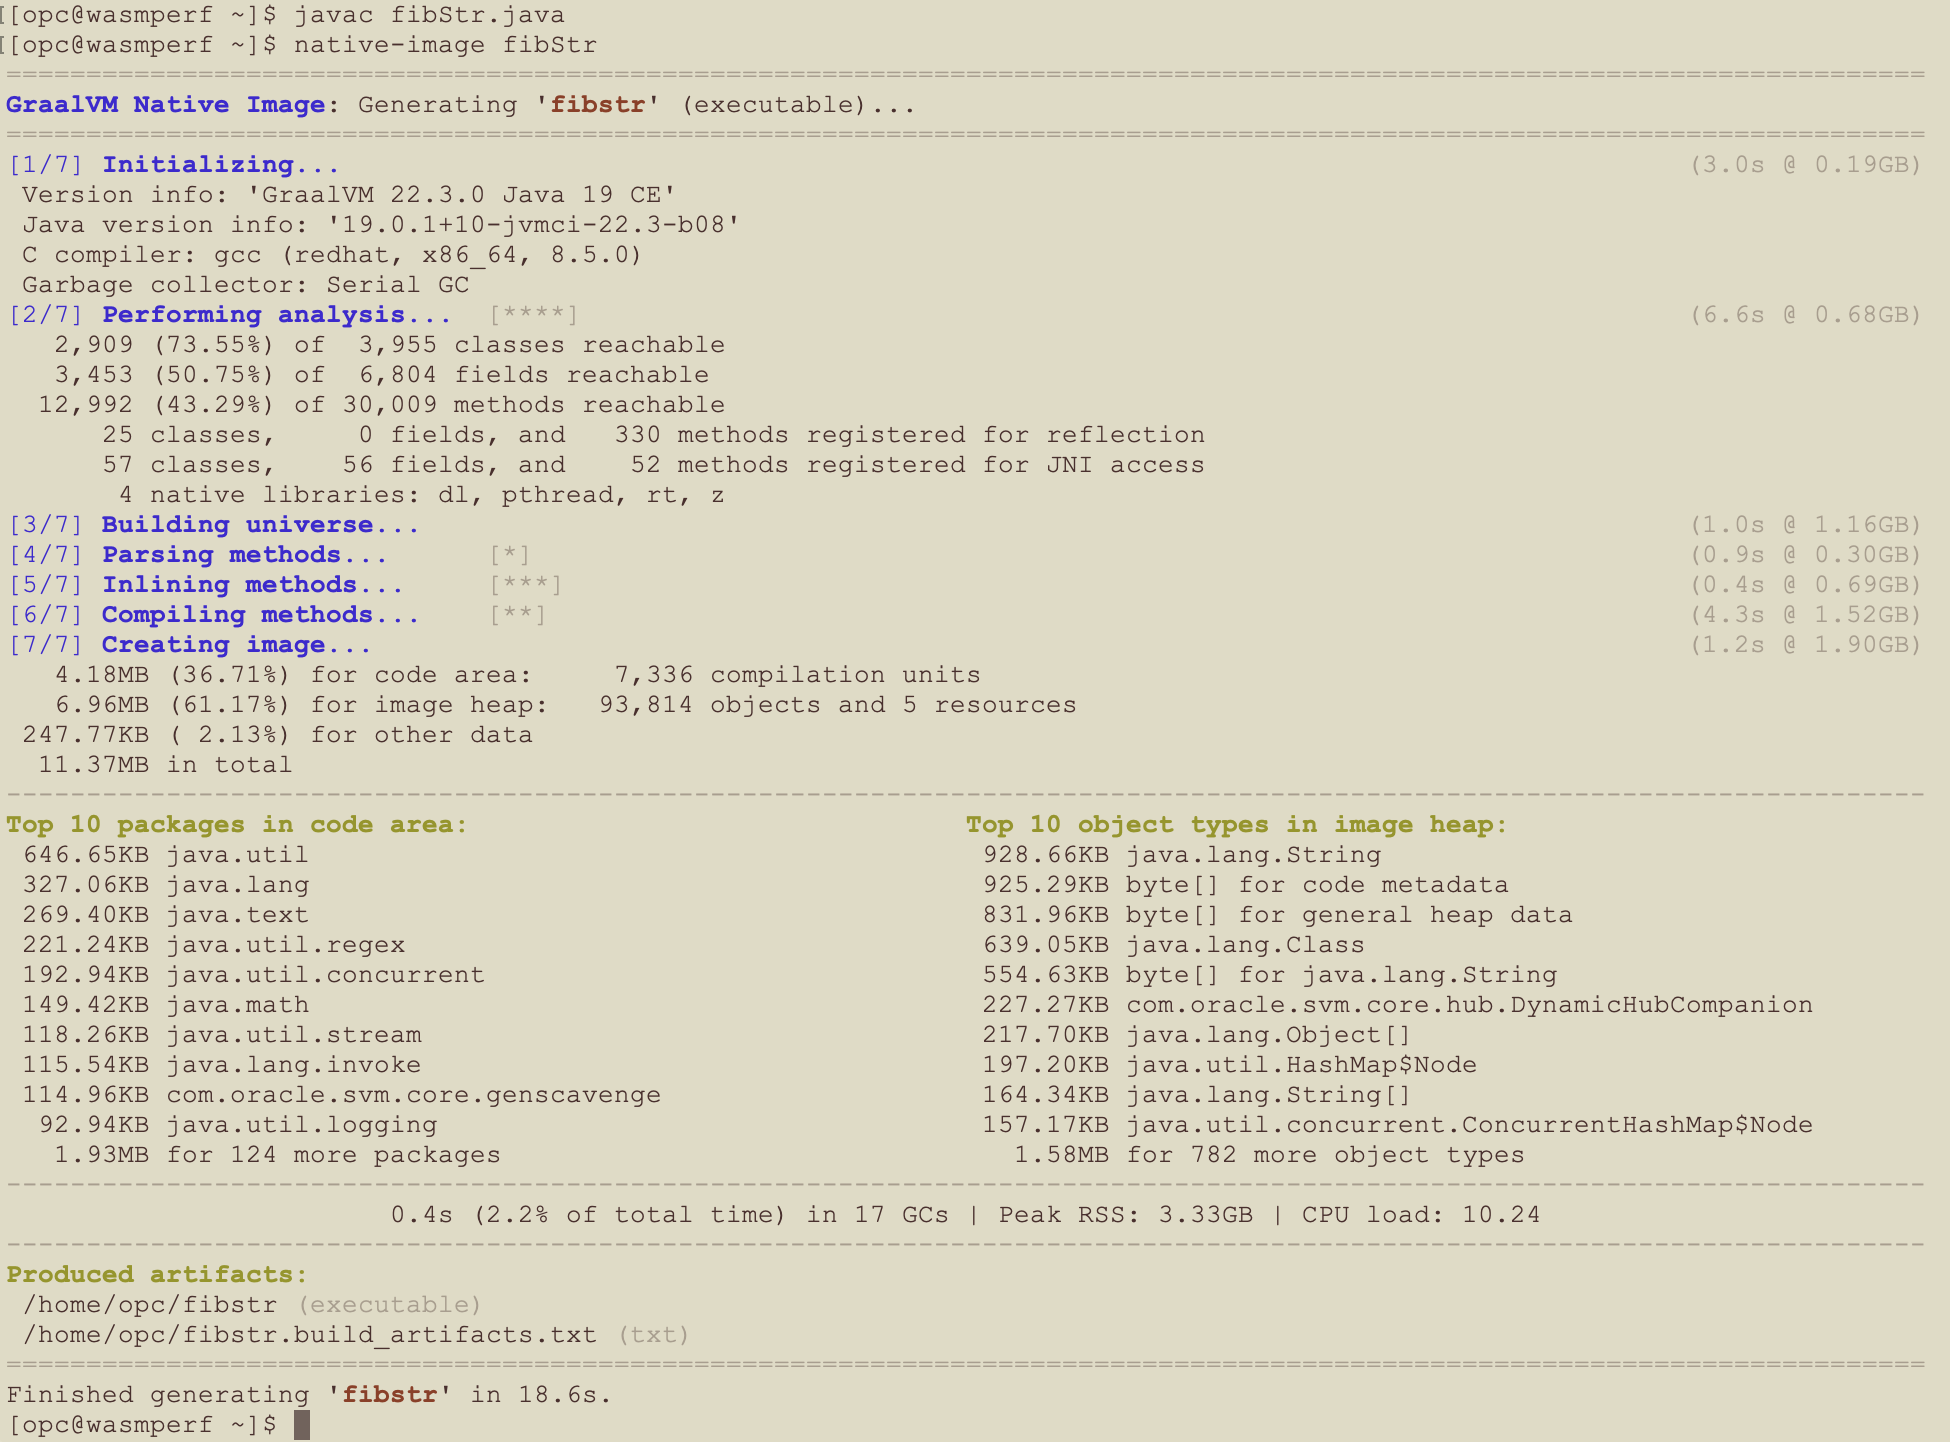
fibstr: ELF 64-bit LSB executable, x86-64, version 1 (SYSV), dynamically linked, interpreter /lib64/ld-linux-x86-64.so.2, for GNU/Linux 3.2.0, BuildID[sha1]=743060ec73742fd44031580bbfeed20d32e038d2, with debug_info, not stripped
For jdk 19.0.1 Native-Image from graalvm-ee-java19-22.3.0 Enterprise Edition
- java – version
- javac fibStr.java
- native-image fibStr
- time ./fibstr
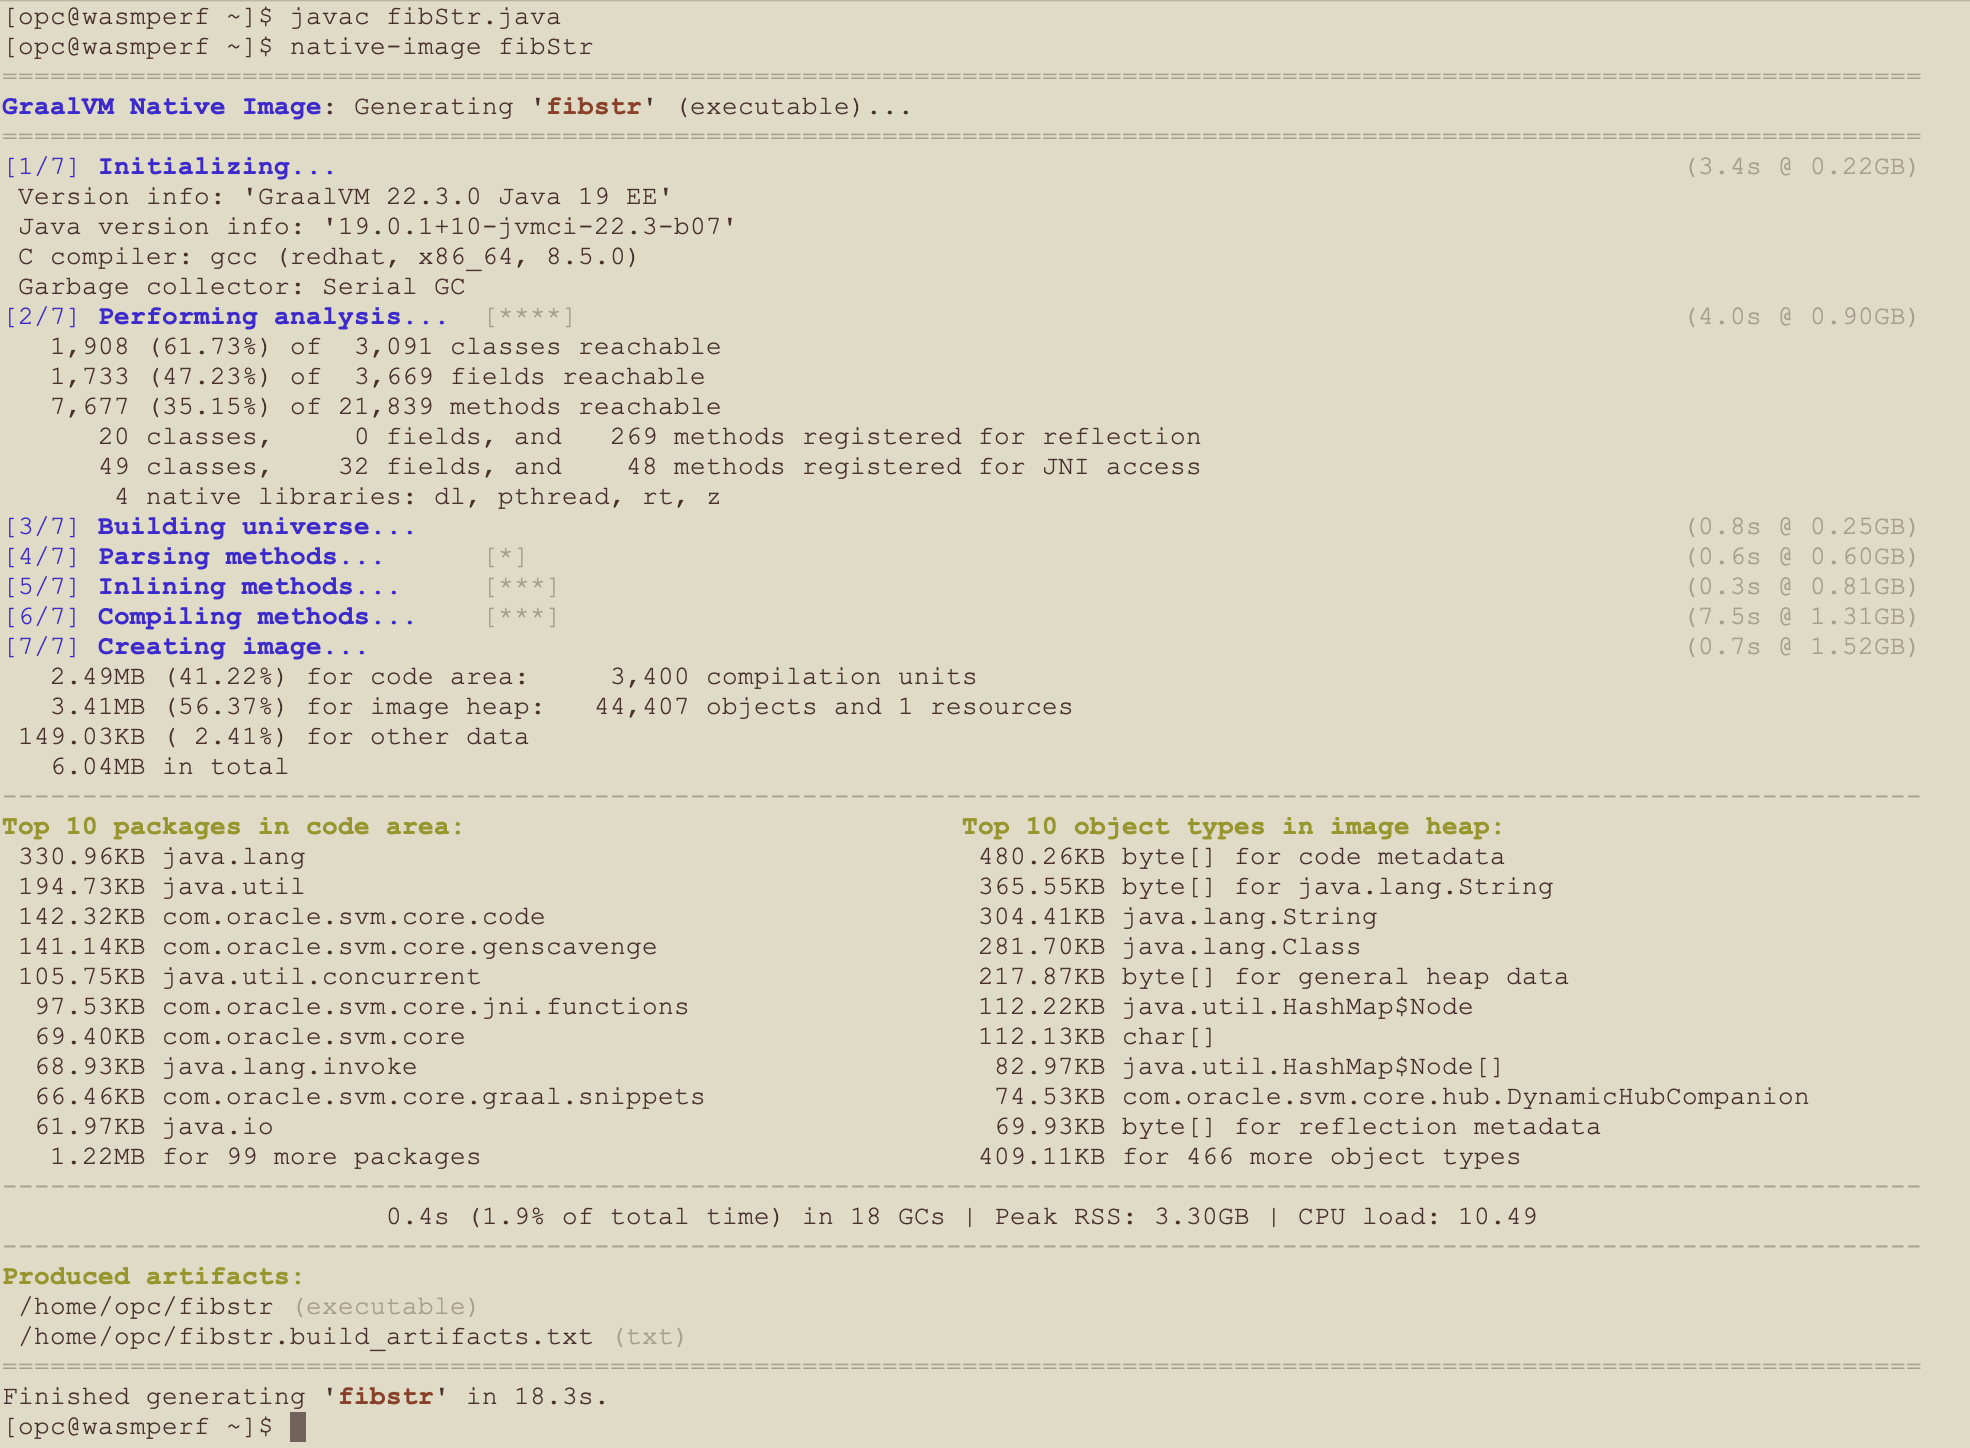
fibstr: ELF 64-bit LSB executable, x86-64, version 1 (SYSV), dynamically linked, interpreter /lib64/ld-linux-x86-64.so.2, for GNU/Linux 3.2.0, BuildID[sha1]=cc1003d58160ce6f66d884d4f41768c291eb7117, not stripped
How I calculated the results
On three different days, I did the following:
- Run the tests for each runtime 10 times using the Linux time command until I got stable results
- I eliminated the highest and lowest results
- I took the average of the remaining eight results
- The Linux time command gives a resolution of 1 millisecond
- The fastest results for the three functions took about one second
- Most of the results took over a minute
- So measurement error did not seem to be a factor
- There was always some variation between the runs, however the relative performance was always the same
Summary
- Based on my micro benchmarks, newer Java runtimes tend to give better performance without any code changes
- The GraalVM Enterprise Edition JDK 19.0.1 run in JIT mode gave the best performance for these micro benchmarks by a significant margin
- The GraalVM native-image ahead of time compiliation was significantly slower than using the JIT mode for these micro benchmarks
Disclaimer: These are my personal thoughts and do not represent Oracle’s official viewpoint in any way, shape, or form.