End-to-End Monitoring and Log Analytics for Siebel CRM environments
Running Siebel CRM at scale is a business-critical commitment – customer service can’t pause, sales teams can’t “try again later,” and IT can’t afford long, repetitive investigations every time something slows down.
Imagine launch day for your biggest phone release. Pre-orders open, traffic spikes, and everything looks fine—until checkout latency jumps, timeouts start, and the order service begins to flake. Carts stall, customers refresh, and then they leave. You don’t just lose orders—you lose trust. And many of those customers don’t come back; they buy from a competitor, turning your outage into millions of dollars in lost revenue for you—and millions in revenue for them.
This is where solid monitoring and log analytics pays off: real-time health signals and alerts catch the slowdown early, performance under load points to the bottleneck fast, and historical metrics and logs drive better capacity planning—keeping the platform resilient and cloud-native.
That’s exactly the value of the Siebel CRM Observability – Monitoring and Log Analytics module, managed through Siebel Cloud Manager (SCM). It is an optional SCM-managed capability with two components:
- Monitoring
- Log Analytics
Under the hood, it uses established tooling such as Prometheus, Grafana, Oracle OpenSearch, Fluentd, and OCI services to provide end-to-end visibility across infrastructure, database, Kubernetes, Siebel services, and supporting components. Modern tooling that IT like to use – no need for Siebel skills here.
The outcome is simple: teams spend less time reacting to incidents and more time operating proactively.
Business value and IT impact
SCM Observability focuses on outcomes that matter:
- Reduce downtime: Detect issues earlier and respond faster with dashboards and alerts.
- Improve user experience: Make performance behavior visible under load and track the impact of changes.
- Lower operational overhead: Replace manual checks with near real-time health signals and consistent views.
- Enable data-driven planning: Use historical metrics and logs to support infrastructure scaling decisions and capacity planning.
Monitoring – From raw metrics to operational insight
Monitoring provides near real-time metrics to spot performance issues early, make better scaling decisions, and trigger proactive alerts before incidents become outages. It supports both:
- Day-to-day operational monitoring through dashboards and alerts.
- Deeper diagnostics through metric exploration and query-based investigations.
It collects metrics that covers key areas such as:
- Siebel Gateway, Siebel AI, and Siebel ConfigAgent
- Siebel server and components
- Business data
- Oracle database health
- Container
- Node or VM
- Ingress controller
- Kubernetes
- OCI infrastructure
It is built around a familiar, scalable pattern:

You can visualize and investigate data in:
- Grafana, open source dashboarding.
- OCI APM Dashboards, OCI-native dashboard experience.
- Prometheus UI, useful for exploration, ad-hoc analysis, and PromQL queries.
Note: Although Oracle does not ship Grafana server, Oracle makes sample dashboards available as JSON files that you can quickly import into your Grafana environment.
Monitoring supports operational responsiveness through alert rules evaluated by Alertmanager, with OCI alerting services available as part of the overall approach.
Sample metrics
Out of the box, SCM collects metrics that help teams understand workload, capacity, and user and session pressure. For example:
| Siebel SERVER METRIC | EXAMPLE VALUE | WHAT IT TELLS YOU |
| Active_Tasks | 142 | Current workload on the Siebel Server |
| Max_Tasks | 300 | Capacity ceiling (useful for scaling/alerts) |
| Active_Sessions | 610 | Current user/session pressure |
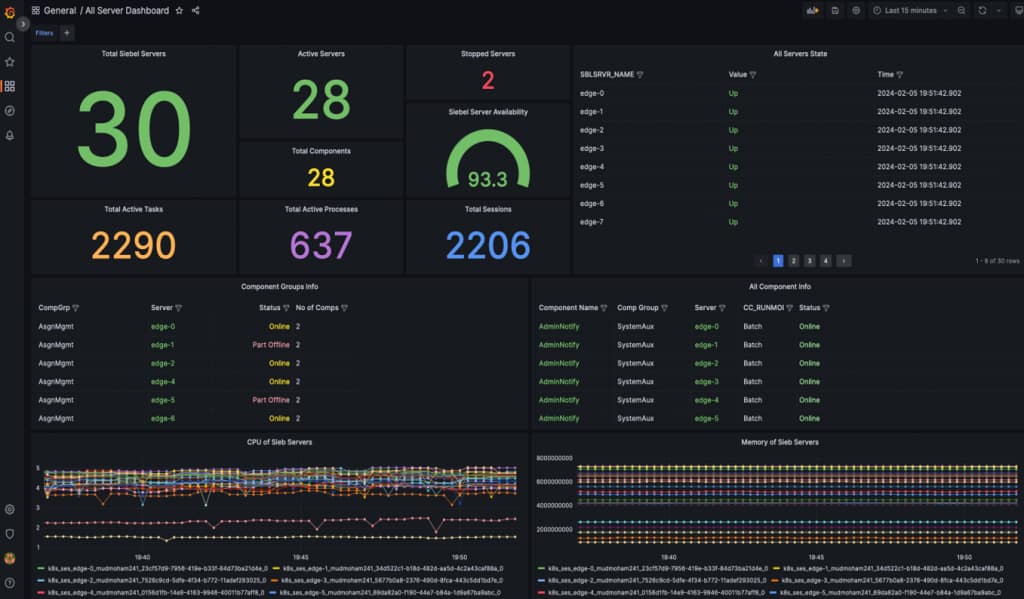
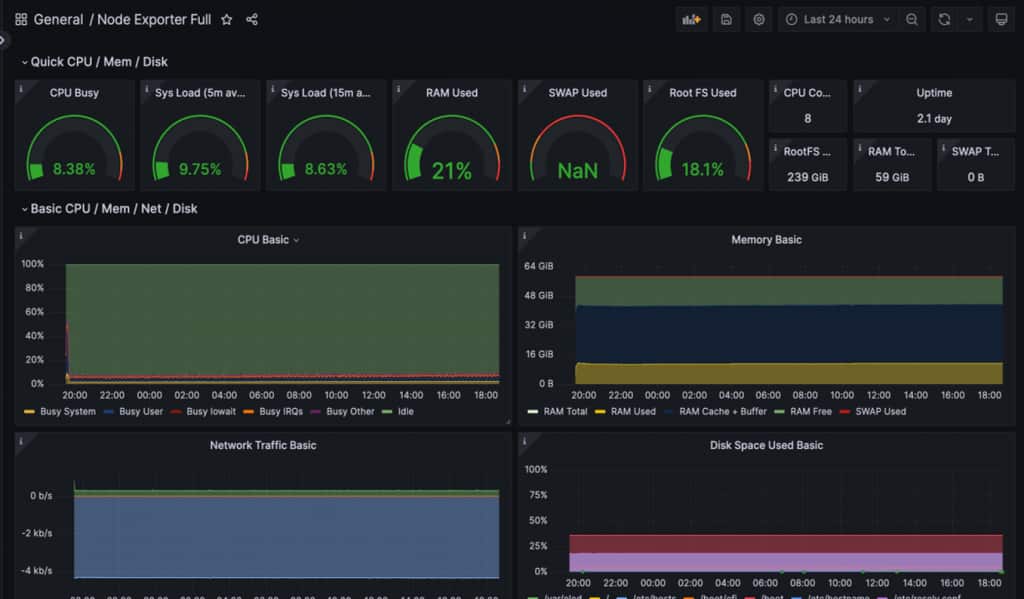
Sample monitoring dashboard
Log Analytics: Turn logs into searchable, actionable intelligence
Log Analytics centralizes Siebel CRM and Kubernetes logs managed by SCM, making them easy to ingest, search, visualize, and alert on—so teams can troubleshoot across components faster and perform root-cause analysis without needing direct server access as end-to-end logs are available in a browser.
It supports two major log analytics destinations, each with distinct strengths:
- Oracle OpenSearch (Open-source option with dashboards and strong search and aggregation capabilities, including OpenSearch Dashboards)
- OCI Logging Analytics (OCI-native SaaS for indexing, enrichment, correlation, dashboards)
SCM uses Fluentd to collect and centralize logs across Siebel components and the Kubernetes cluster, and routes them to the enabled analytics services. It uses sidecar Fluentd log collectors, Fluentd log aggregator agents, and a DaemonSet collector.
The following dashboards are provided as samples:
- An Overall Log Dashboard
- Siebel Server Log Dashboard
- Application Interface Log Dashboard
- Object Manager Log Dashboard
- Gateway Log Dashboard
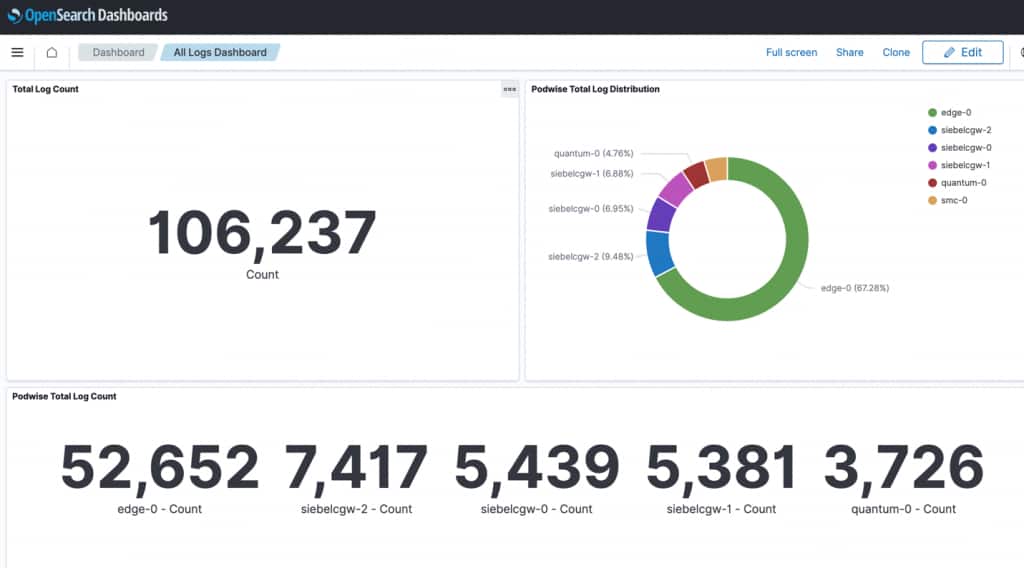
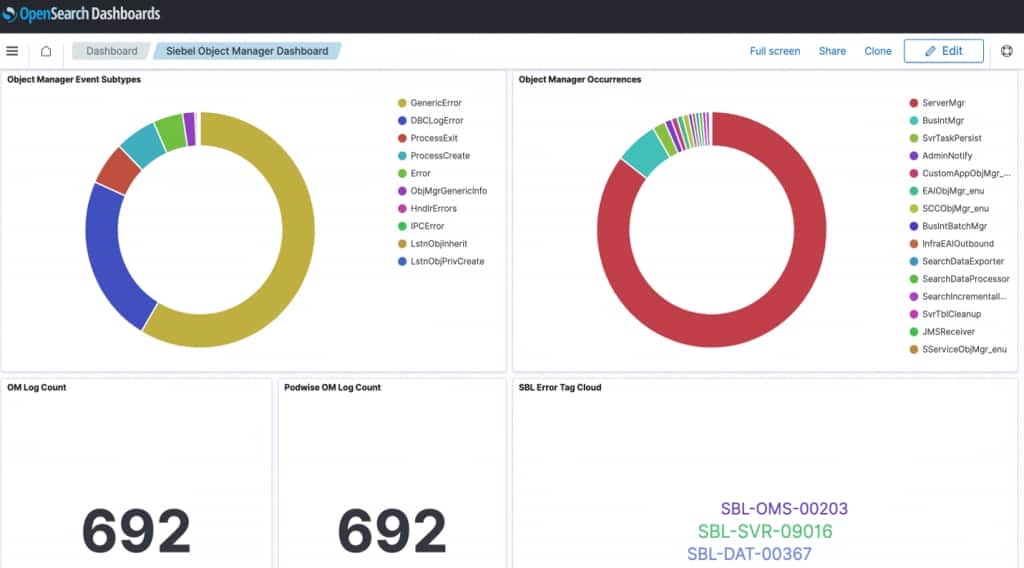
Sample log analytics dashboard
This observability stack supports both daily monitoring and a scalable, future-ready operational model for Siebel CRM. It combines Prometheus time-series metrics with centralized log analytics, including data from Siebel Usage Pattern Tracking (UPT), to create a modern foundation that supports higher transaction volumes, distributed services, and increasing user demand.
AI can be used to analyze logs from UPT, application servers, Kubernetes, and infrastructure in a unified view to identify usage patterns, detect anomalies, highlight bottlenecks, and surface user-impacting issues more quickly. When these insights are correlated with Prometheus metrics, teams can connect system behavior with overall health in near real time, improve alert accuracy, accelerate root-cause analysis, and make better capacity planning decisions. The payoff is not just better visibility today, but a smarter operating model for the future—one that boosts uptime, cuts investigation effort, and keeps Siebel CRM ready for what’s next.
For more information, refer the Monitoring Siebel CRM Deployments and Log Analytics in Siebel CRM Deployments chapters in the Siebel Cloud Manager documentation.