Some catalog issues are easy to describe but hard to trace.
Imagine a Siebel architect trying to understand why a large product family has become harder to configure over time. The symptoms are visible, but the cause may be spread across products, classes, relationships, domains, constraints, and promotions. Manual review can be slow, incomplete, and difficult to repeat.
Siebel provides two Product Analyzer Toolkit approaches: an eScript-based toolkit for quick in-environment checks, and a Property Graph-Based toolkit for deeper cross-entity analysis of larger catalogs.
The Property Graph-Based Product Analyzer Toolkit helps teams analyze these larger, more connected catalog problems. It migrates selected Siebel catalog data from Oracle 19c into an Oracle 26ai property graph, where catalog entities can be explored as connected nodes and edges. This graph-first model makes it easier to trace relationships, run cross-entity impact analysis, and investigate catalog complexity without placing ongoing query load on the live Siebel application.
Use the eScript-based Product Analyzer Toolkit when you want to work inside Siebel with minimal external setup. It runs natively through Siebel business services, uses predefined rules, and is a good fit when you want quick diagnostics on live data for specific product families.
Choosing the right toolkit
Use this as a simple decision guide:
| Use case | Recommended toolkit |
| Quick diagnostics inside Siebel | eScript-based toolkit |
| Minimal setup | eScript-based toolkit |
| Deep cross-entity traversal | Property Graph-Based toolkit |
| Large catalog impact analysis | Property Graph-Based toolkit |
| Separate analysis layer outside live Siebel load | Property Graph-Based toolkit |
| Baseline first, deeper analysis later | Use both together |
Many teams start with eScript to establish a baseline and then move to the Property Graph-Based Product Analyzer Toolkit for deeper investigation. This gives teams a simple adoption path: start small, then go deeper only when needed.
For more information on the eScript-based Product Analyzer Toolkit, including how it works, where it fits best, and how to get started, read the blog How to Identify and Fix the Hidden Catalog Issues.
How the Property Graph-Based Product Analyzer Toolkit works
The Property Graph-Based Product Analyzer Toolkit simplifies the process through three core components: the data migration module, the property graph DDL generator, and the MCP server for AI-assisted graph queries.
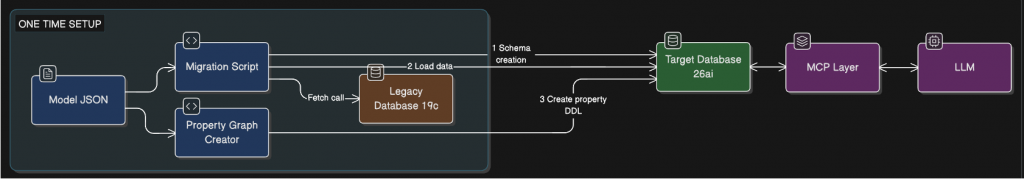
The complete analysis follows this flow:
- Select the scope: Identify the catalog entities to migrate and, if needed, use QUERY_DATE to limit the extract for incremental refreshes.
- Migrate catalog data (migration_19c_to_26ai.py): Use the migration script to stream relational data from Oracle 19c to Oracle 26ai in configurable batches. The script prompts before touching the target database and performs idempotent upserts so refreshes can be re-run safely.
- Build the property graph (create_property_graph.py): Use the DDL generator to read the graph model JSON and create the Oracle 26ai property graph definition for vertices, edges, key columns, and labels.
- Expose query tools (property_graph_mcp.py): Use the MCP server to make graph query tools available so analysts can explore data, vertices, and edges directly or through natural-language prompts.
- Traverse cross-entity relationships: Use PGQL and AI-assisted queries to follow multi-hop paths across products, classes, relationships, domains, constraints, and promotions.
- Generate actionable findings: Identify the exact products, classes, relationships, or promotions to fix, and rerun the analysis to verify remediation.
In practice, this means less time stitching together evidence across the catalog and more time resolving issues that affect performance.
Key benefits
Key benefits include:
- Deeper relationship analysis: Follow multi-hop relationships across products, classes, domains, constraints, and promotions.
- Reduced load on live Siebel: Run analysis on Oracle 26ai after the data is migrated, rather than placing ongoing query load on the live Siebel application.
- Repeatable investigation: Rerun the migration and graph queries to validate fixes over time.
- Incremental refresh support: Use a date cutoff to update the graph without rebuilding the full data set.
- AI-assisted exploration: Use the MCP server to support natural-language-driven graph queries.
This is not the lightweight option. It requires Python, Oracle connectivity, Oracle Instant Client, an Oracle 26ai instance, wallet setup, and an MCP client. The graph is also only as current as the most recent migration, so this approach is best suited to scheduled analysis rather than real-time investigation. In other words, this toolkit works best when the catalog is large enough and the analysis need is deep enough to justify the extra setup.
Getting started
A sensible adoption path is to use this toolkit when the catalog has outgrown simple rule-based checks or when teams need broader evidence before deciding what to fix first. Start by assessing the infrastructure, migrate the relevant data, run deeper analysis on high-impact areas, and then fold the results into a remediation cycle: triage, fix, rerun, and measure improvement.
Used that way, the graph becomes a repeatable analysis layer rather than a one-time experiment.
To access the Property Graph-Based Product Analyzer Toolkit, log a Service Request with Oracle Support under Siebel CRM and request the Patch ID 39161636. The patch includes python files, configuration files and detailed documentation to help you configure and extend the toolkit for custom use.