In the previous post, we introduced the high-level steps involved in the lifecycle of Kibana analytics. In this post, we will see how to get started with deploying and using the delivered Kibana analytics.
Assumption
This post assumes that Elasticsearch and Kibana are installed in the environment. For guidance on installation, please refer:
PeopleSoft Search and Kibana Analytics Home Page (Doc ID 2205540.2)
Setting Up Kibana in PeopleSoft Search Framework
Working with Kibana
This post also assumes that you have taken an application’s update image which delivers some Kibana dashboards.
Where do we start?
How do we know what is delivered by the application in the update image? Well, there are PeopleBooks for HCM and FSCM that list all the delivered Kibana analytics.
HCM PeopleBooks (Image 40) > Understanding Kibana Analytics Using Elasticsearch
FSCM PeopleBooks (Image 42) > Understanding Kibana Analytics Using Elasticsearch
Note: The hyperlinks shared above are references to the current PUM images available at the time of writing. Please refer the latest version of PeopleBooks for an updated list in the future.
In PeopleBooks, we can see the available Kibana analytics, and the underlying delivered Search Definitions used for each of the Kibana Dashboards. We will also notice that the Dashboards listed in the table are hyperlinks to more detailed documentation. Lots of valuable information! Be sure to review them to get a good understanding of the dashboard specific functionality.
Taking stock of what is delivered
The applications provide all the objects and configuration required for the deployment of delivered Kibana analytics. This includes the data source (PS Query or Connected Query), Search Definitions, Search Categories and Kibana Configuration as shown below.
| Lifecycle of Kibana Analytics | Delivered via PUM | Customer Action |
| 1. Data Source | ||
| 1.1. Create PS Query or Connected Query | ✓ | |
| 1.1.a. Define Drilling URL for Navigation | ✓ | |
| 1.1.b. Create date/time prompt for incremental indexing | ✓ | |
| 2. Search Designer | ||
| 2.1. Create Search Definition | ✓ | |
| 2.1.a. Use Query (data source) created for search | ✓ | |
| 2.1.b. Map query fields to search metadata attributes | ✓ | |
| 2.1.c. Add security-related metadata | ✓ | |
| 2.2. Create Search Category | ✓ | |
| 3. Search Administration | ||
| 3.1. Deploy Search Definition/Category | ✓ | |
| 3.2. Build Search Index | ✓ | |
| 4. Create Visualizations/Dashboards | ||
| 4.1. Create Index Pattern | ✓ | |
| 4.2. Create Visualizations | ✓ | |
| 4.3. Create Dashboards | ✓ | |
| 5. Administer Visualizations/Dashboards | ||
| 5.1. Import Dashboards | ✓ | |
| 5.2. Configure Dashboards | ✓ | |
| 5.3. Specify User Privileges | ✓ | |
| 5.4. Deploy Dashboards | ✓ |
Let us take the example of the ‘Application Details’ dashboard delivered in HCM and review the related objects and configurations delivered via PUM images.
| Data Source | |
| Connected Query | HRS_SRCH_APPLICANT_CQY |
| Search Designer | |
| Search Definition | HC_HRS_APP_INDEX |
| Search Category | HC_HRS_APP_INDEX |
| Kibana Configuration | |
| Kibana Dashboard (Detail) | Application Details |
| Kibana Dashboard (Tile) | Application – External vs Internal |
| Tile | |
| Content Reference | HC_HRS_APPLICATION_DBRD_FL |
Reporting Tools > Connected Query > Connected Query Manager
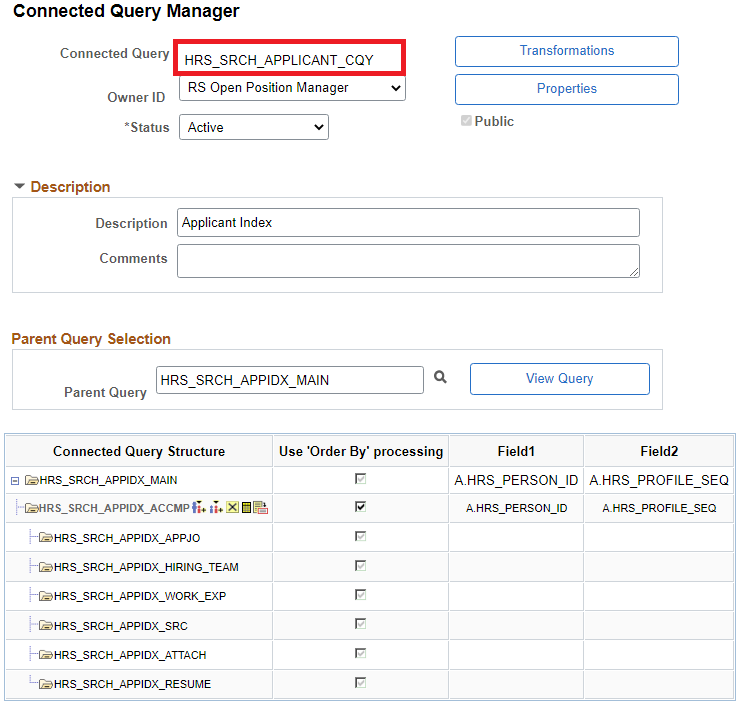
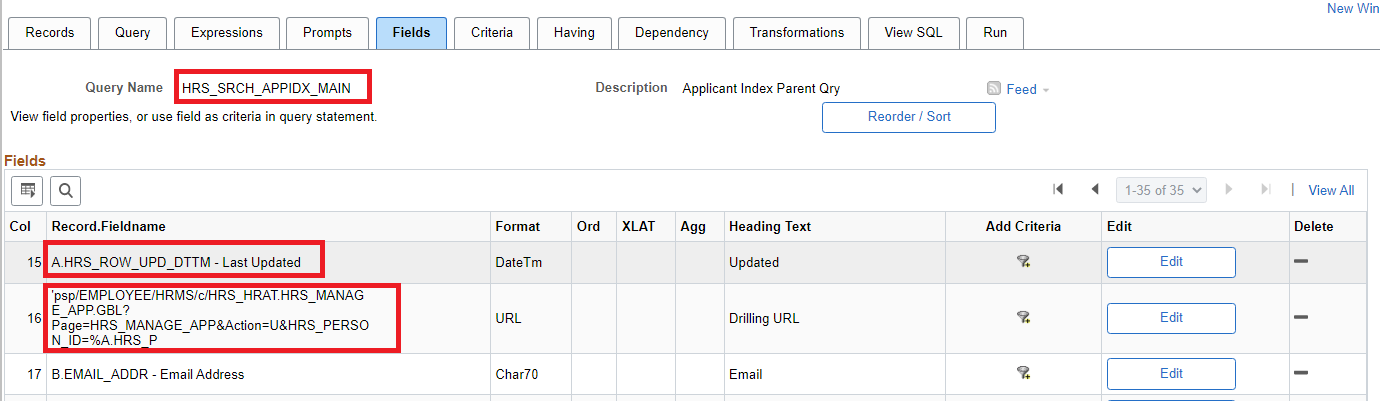
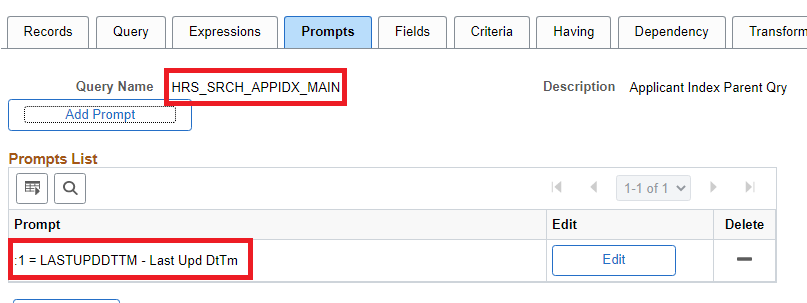
If we review the Parent Query HRS_SRCH_APPIDX_MAIN, we will notice the drilling URL and date/time prompt fields which are required for the search definition.
PeopleTools > Search Framework > Designer > Define Search Definitions
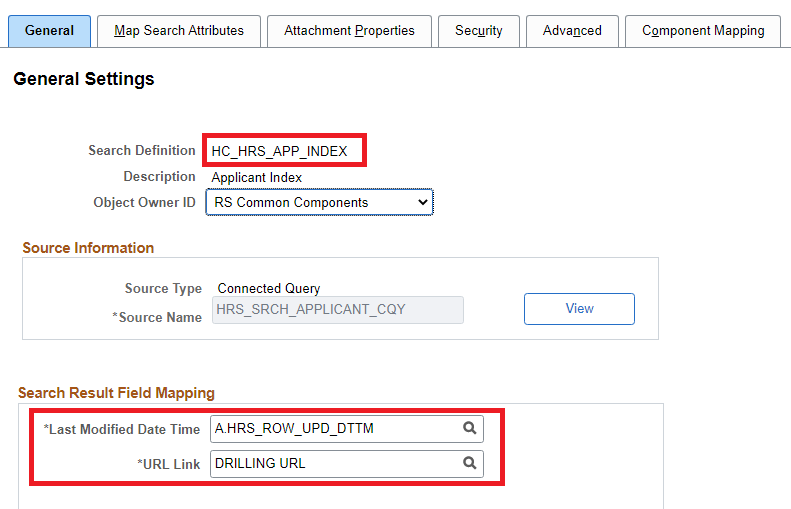
Notice the Search Definition references the Connected Query HRS_SRCH_APPLICANT_CQY as the data source. Further, the ‘Last Modified Date Time’ and ‘URL Link’ field mapping is configured using the Connected Query fields. Also, review the Map Search Attributes and Security tabs.
PeopleTools > Search Framework > Designer > Define Search Categories

PeopleTools > Search Framework > Administration > Configure Kibana Dashboards

PeopleTools > Search Framework > Administration > Import Dashboards from Kibana

The JSON files referenced on the ‘Import Dashboards from Kibana’ page represent the objects (including Dashboards, Visualizations and Index Patterns) to be deployed onto the Kibana server. For those who are curious, these files are stored in the database in an attachment table called PTSF_DBOARD_ATT.
PeopleTools > Portal > Structure and Content
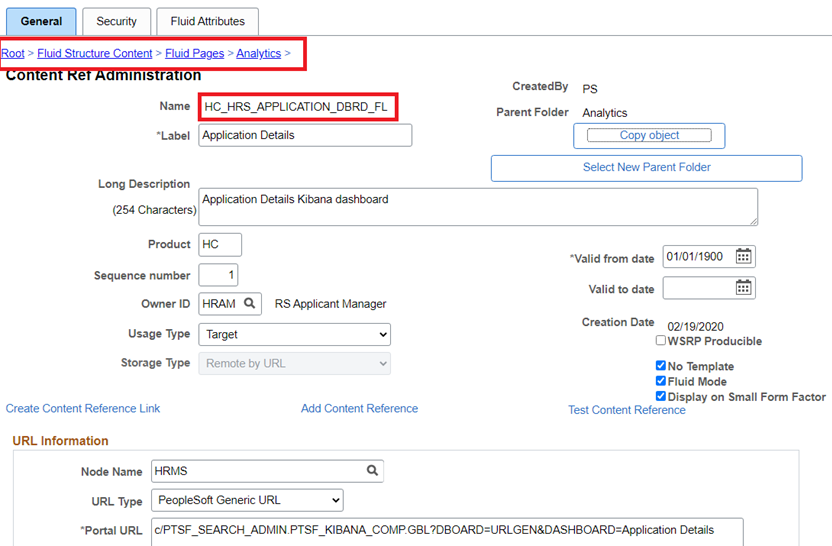
This content reference is the Homepage Tile created as part of the Kibana configuration.
Let’s Deploy!
We just reviewed all the objects necessary for the Kibana analytic (Application Details) delivered via PUM. We can deploy and use the delivered Kibana analytic using the following steps:
- Deploy Search Definition
- Build Search Index
- Assign Roles to Dashboards
- Deploy Dashboards to Kibana
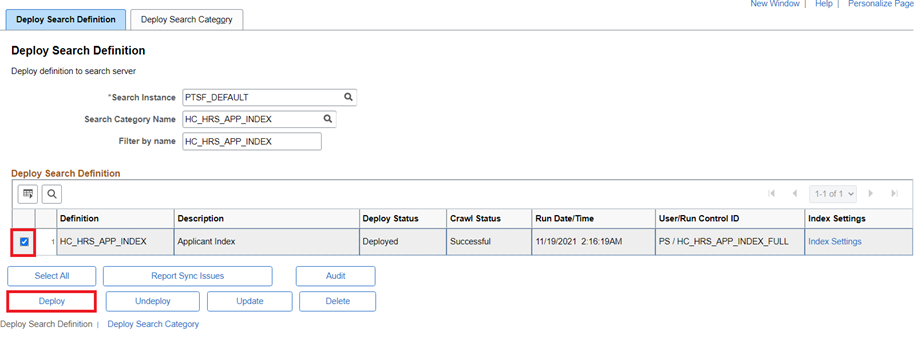
Deploy Search Definition
In this step, we need to ensure the delivered search definition is deployed on the Elasticsearch server. This can be done using the Deploy Search Definition page. This step effectively creates the structure of the search index in Elasticsearch based on the metadata defined in the PeopleTools search definition.
PeopleTools > Search Framework > Administration > Deploy Search Definition
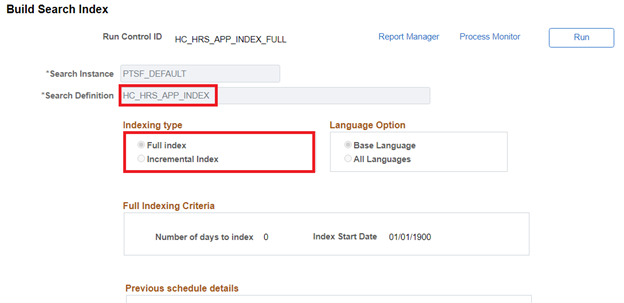
Build Search Index
The next step is to schedule the search indexing process (full index for the initial load and incremental index for periodic updates). This step will populate the search index in Elasticsearch with the results from the search definition query.
PeopleTools > Search Framework > Administration > Schedule Search Index
Assign Roles to Kibana Dashboards
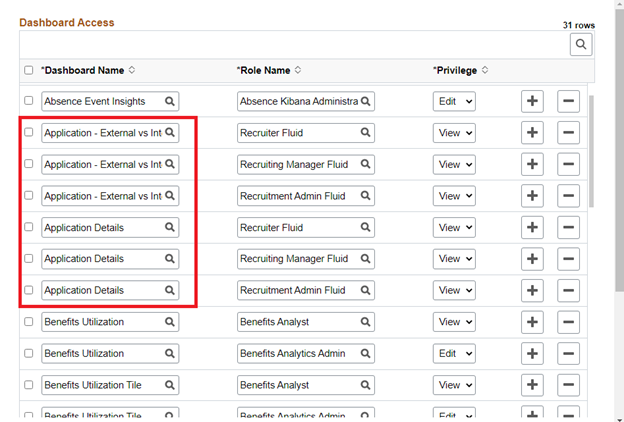
In this step, we will review and assign roles to the Kibana Dashboards (tile and full view) to ensure that the Kibana analytics tile and dashboard are visible only to the authorized users. We can assign any custom roles with appropriate privileges as determined by requirements.
PeopleTools > Search Framework > Administration > Assign Kibana Dashboard Roles
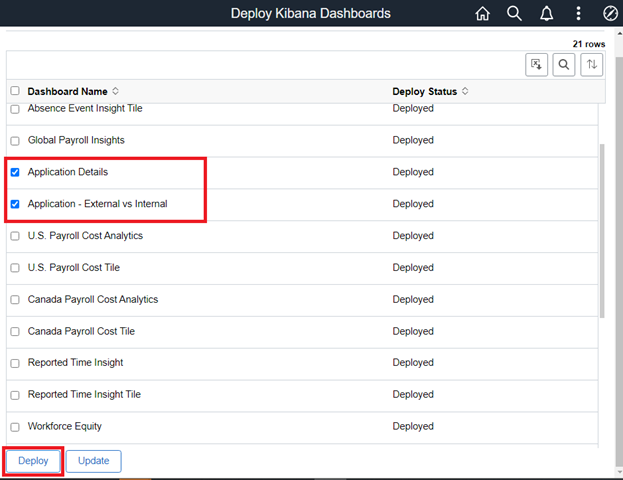
Deploy Kibana Dashboards
The final step is to deploy the dashboards (tile and full view) to Kibana!
PeopleTools > Search Framework > Administration > Deploy Dashboards to Kibana
All done! We are now ready to explore the Kibana Dashboards and Visualizations.