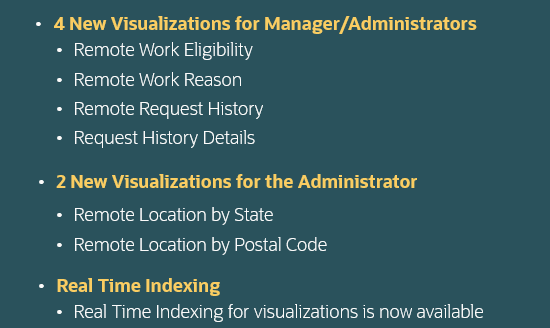
As employers continue to find that “sweet spot” of providing remote working and the need to have employees in the office, analytics will play a vital role in understanding the flexibility your employees expect, where your employees want to work, and what the office staffing may look like. With Image 44, we have delivered 4 more visualizations for the Manager/Administrator, and an additional 2 new visualizations solely for the Administrator to help with this type of analysis.
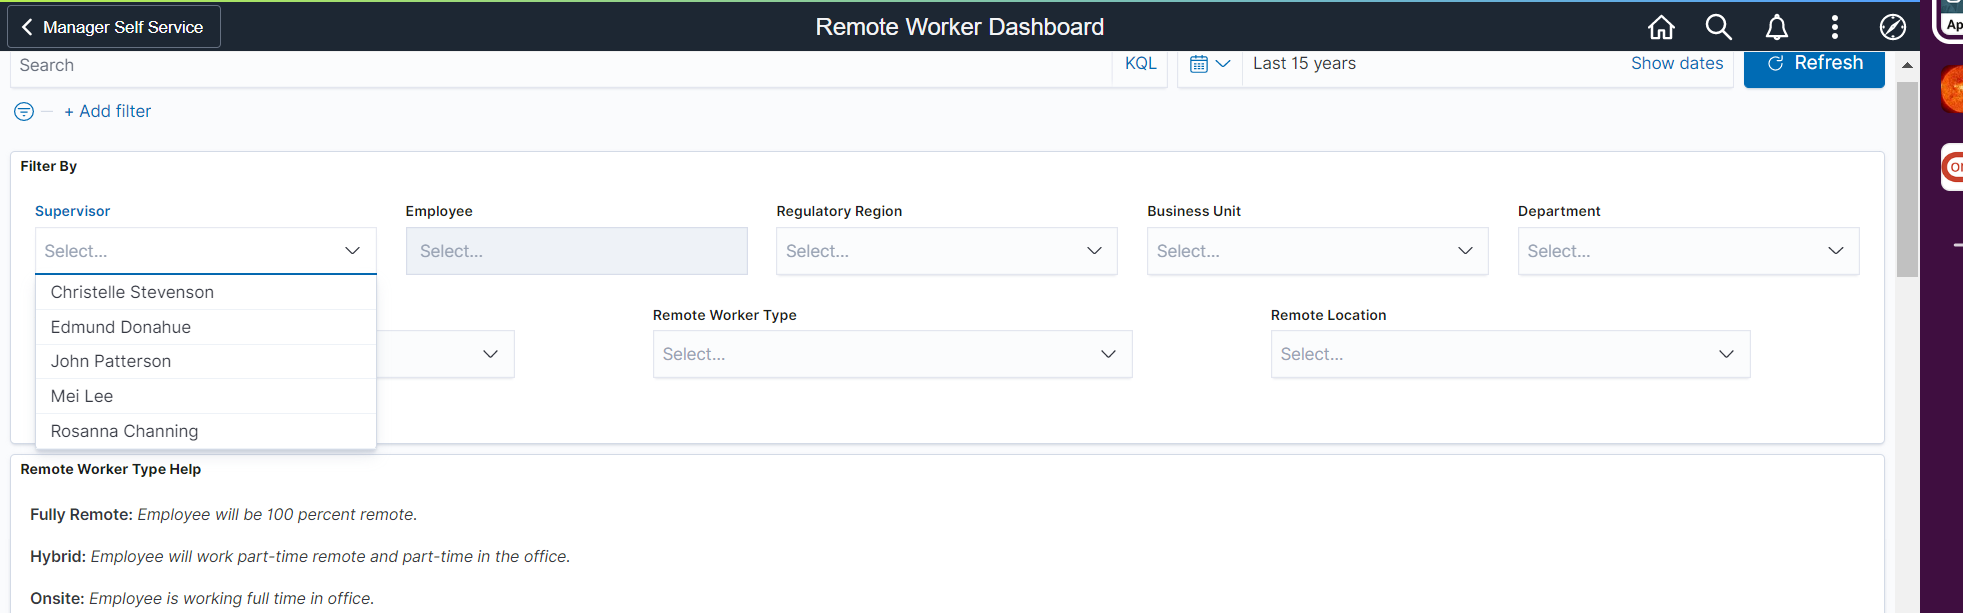
The Remote Worker Dashboard for Managers provides insights into many unique aspects of the managers’ direct and in-direct employees’ data surrounding remote work. The Manager can filter by Supervisor and other fields to drill deeper into the data.
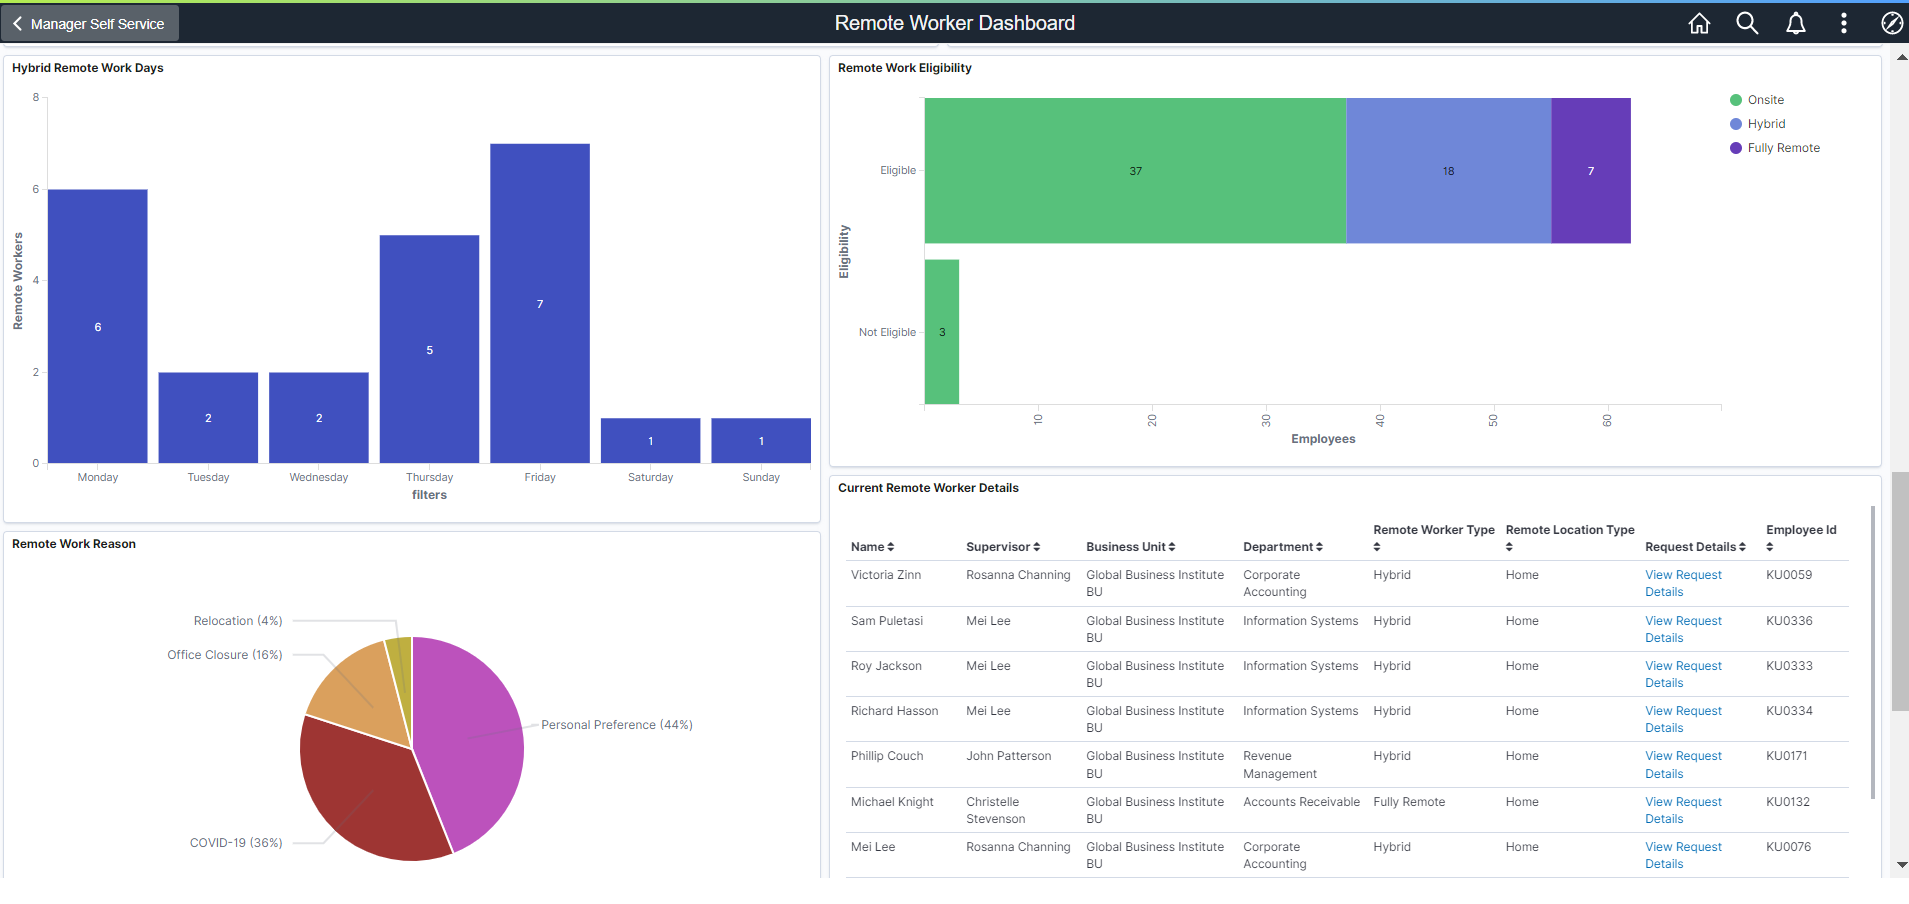
The first delivery of analytics included a breakdown and distribution of Remote Worker types, including by Department and Location as seen below.

We have now added a breakdown by Eligibility for remote working based on U.S. job codes and Position Data. Remote Work Reason allows you to monitor why employees are requesting to work outside of the office. These two visualizations may be important to understanding the value of remote working to your organization.
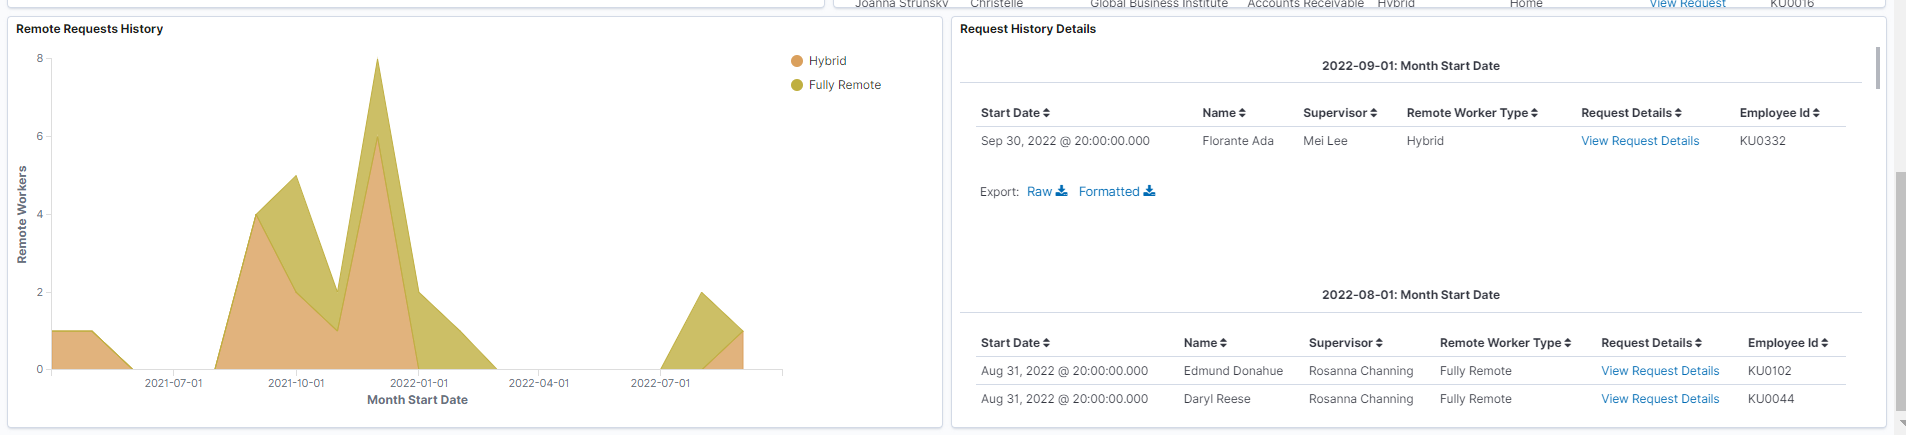
Understanding the cyclical nature of the requests can bring you more insight as well. For instance, employees are requesting changes based on seasonal or holiday schedules, due to child care issues in the summer, employees working while visiting family, or stretching out vacation breaks by working at the rental property. Understanding the reality of the workplace may be helpful in creating or updating policies and practices that can help you retain and attract staff.
The Remote Worker Administrator has two additional visualizations to understand where employees are while remote working. The Remote Location by State and Postal Code may also be helpful to Payroll to understand taxing situations.

The visualizations also take advantage of real time indexing (RTI). This means that you don’t have to schedule the index to run for instance overnight to pull in new data. Instead every time you refresh the page, you can have the latest data available for your viewing. RTI requires your organization to be on PeopleTools 8.59.10 or above.
As you have heard me say many times, I hope these new visualizations are not only helpful for you but also help you think outside of the box about what is possible. I fully expect that you will create many other graphical representations to answer those unique questions that your management may pose. Check out this recently delivered feature video about the Remote Worker Insights.
To learn more about the Remote Worker feature and delivered Insight Analytics, look for these blogs and video.
