Did you know that PeopleSoft offers a centralized workspace which a collections analyst or manager can use to access collector activities or monitor collections?
This blog will help you understand how the workspace can be used to access collector activities or monitor collections.
Two new dashboards AR Collection Analysis and Collector Performance have been created to give Managers, Supervisors and Leads a centralized location to view information about the state of collections and collector performance. The new dashboards have been implemented using Kibana.
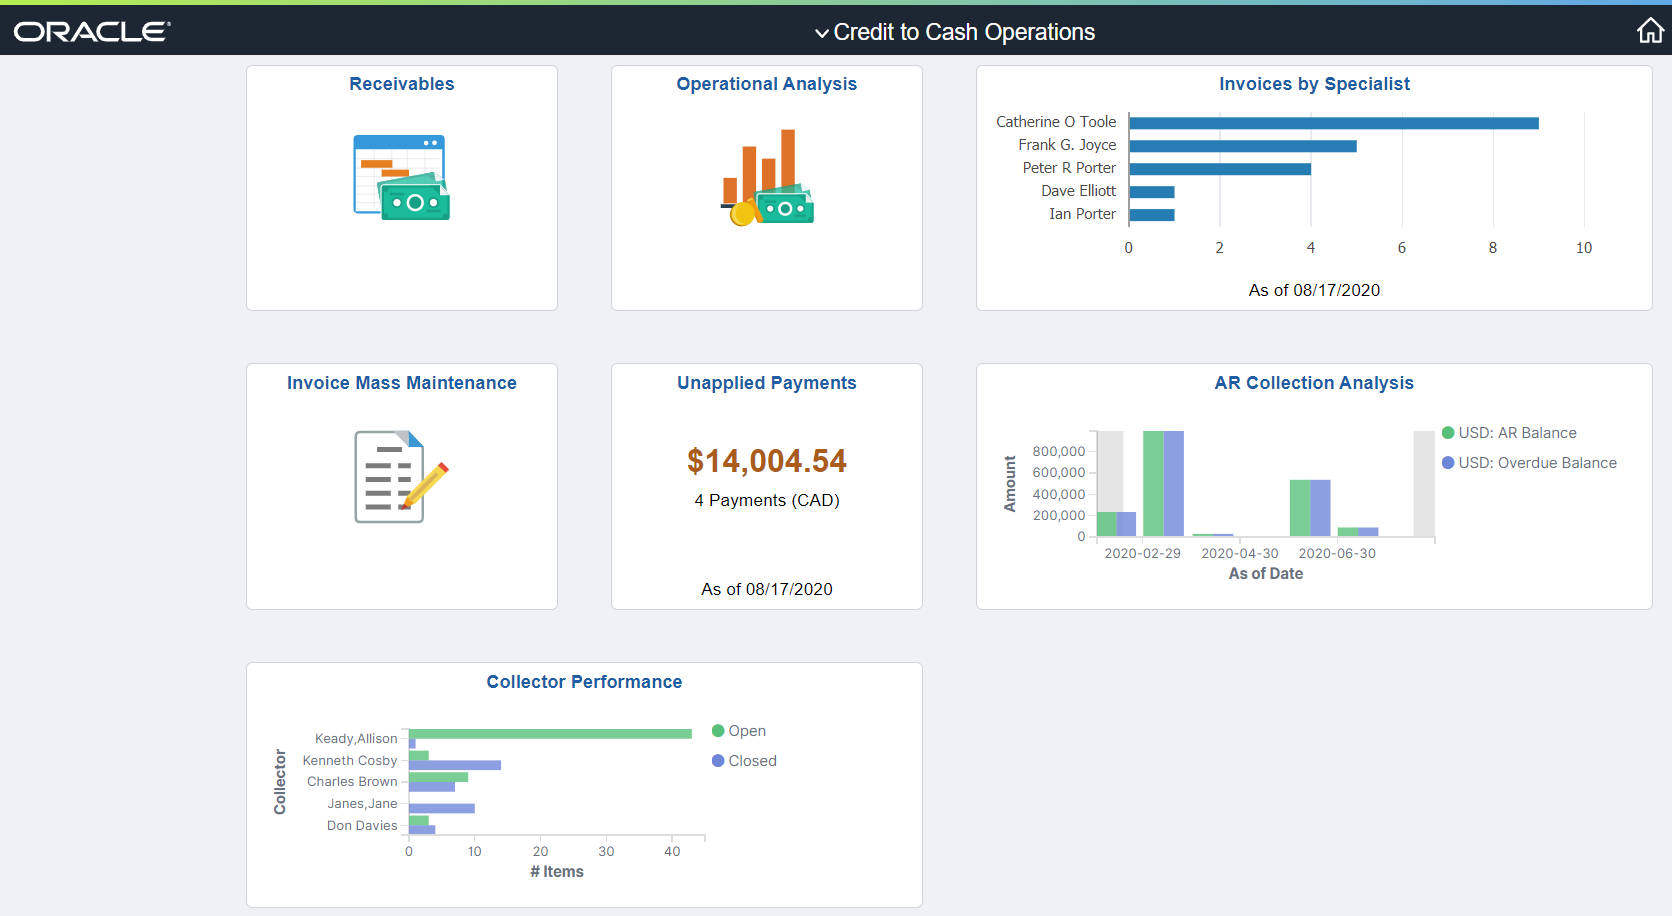
The AR Collection Analysis dashboard helps the Receivables Manager, Supervisors or Lead to monitor and measure the Receivables position. With access to basic and advanced data elements, Managers can review the collection status of all Receivables from an operational perspective so that they can move towards the goals of the organization.
With this dashboard managers can see the trends and can drill down into specific invoice to see what is happening in their collection activities. The AR Collection Analysis dashboard ( Figure 1) displays the following information
- AR Balance vs Overdue
- AR Balance vs Collected
- Write offs and Deductions
- Disputes by Business Unit
- Top 5 Customer Risk Scores
- Top 5 Customer Balances
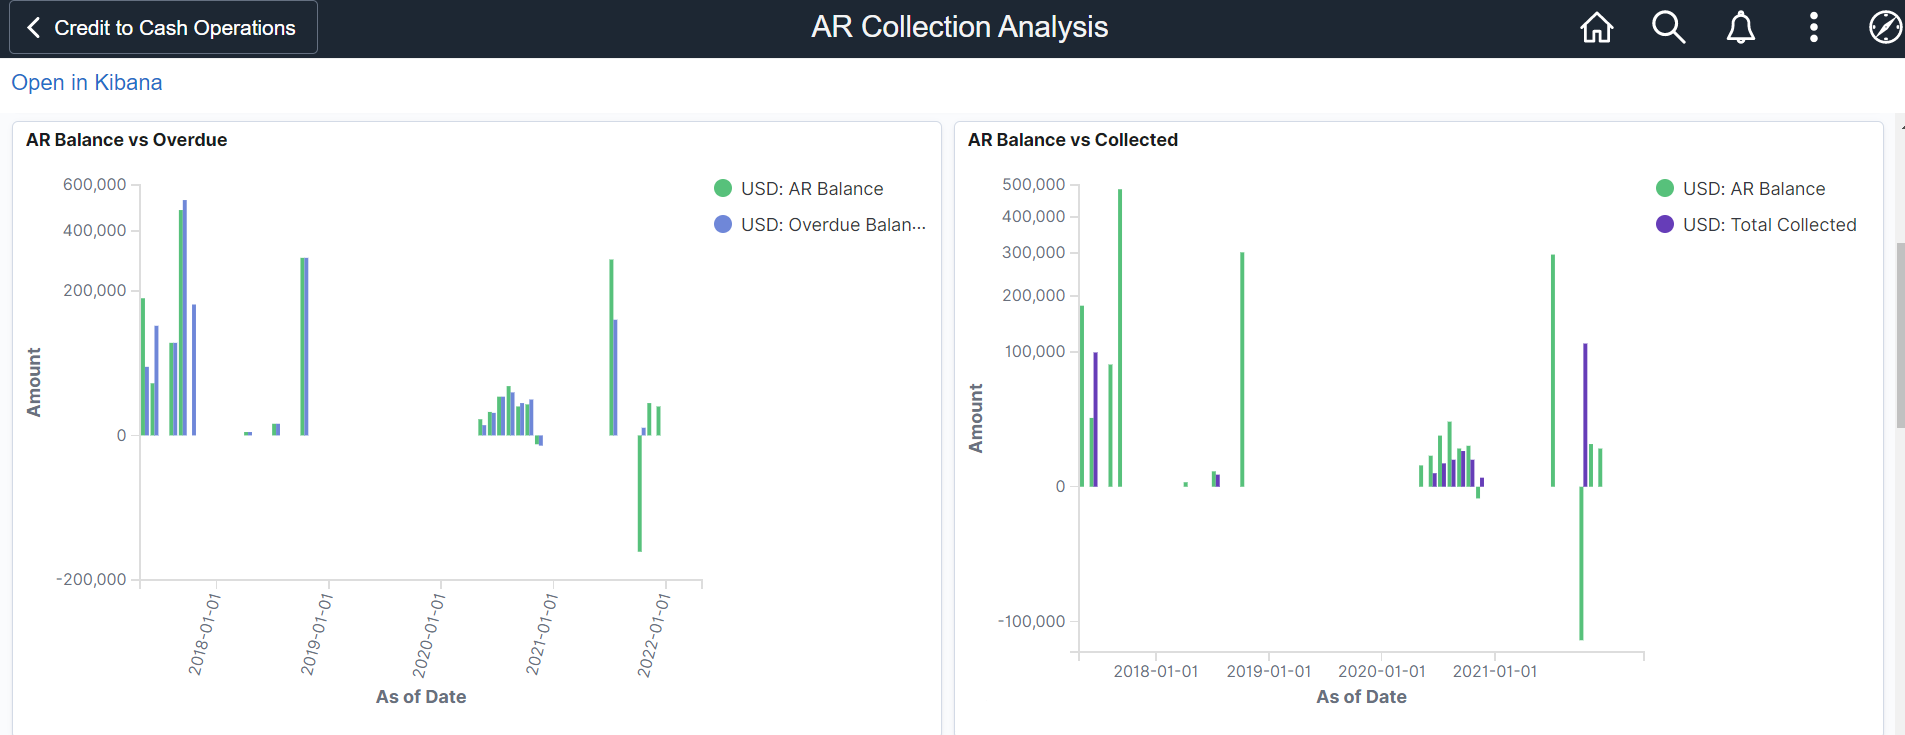
Figure(1) AR Collection Analysis
- AR Balance vs Overdue visualization shows as of date on X-axis and Amount on Y-axis. It provides a holistic view of the Receivables position, helps the user identify overdue amounts and take measures to collect them.
- AR Balance vs Collected visualization shows as of date on X-axis and amount on Y-axis. Users can see the total Account Receivables balance and the amount collected to get an insight into outstanding amount.
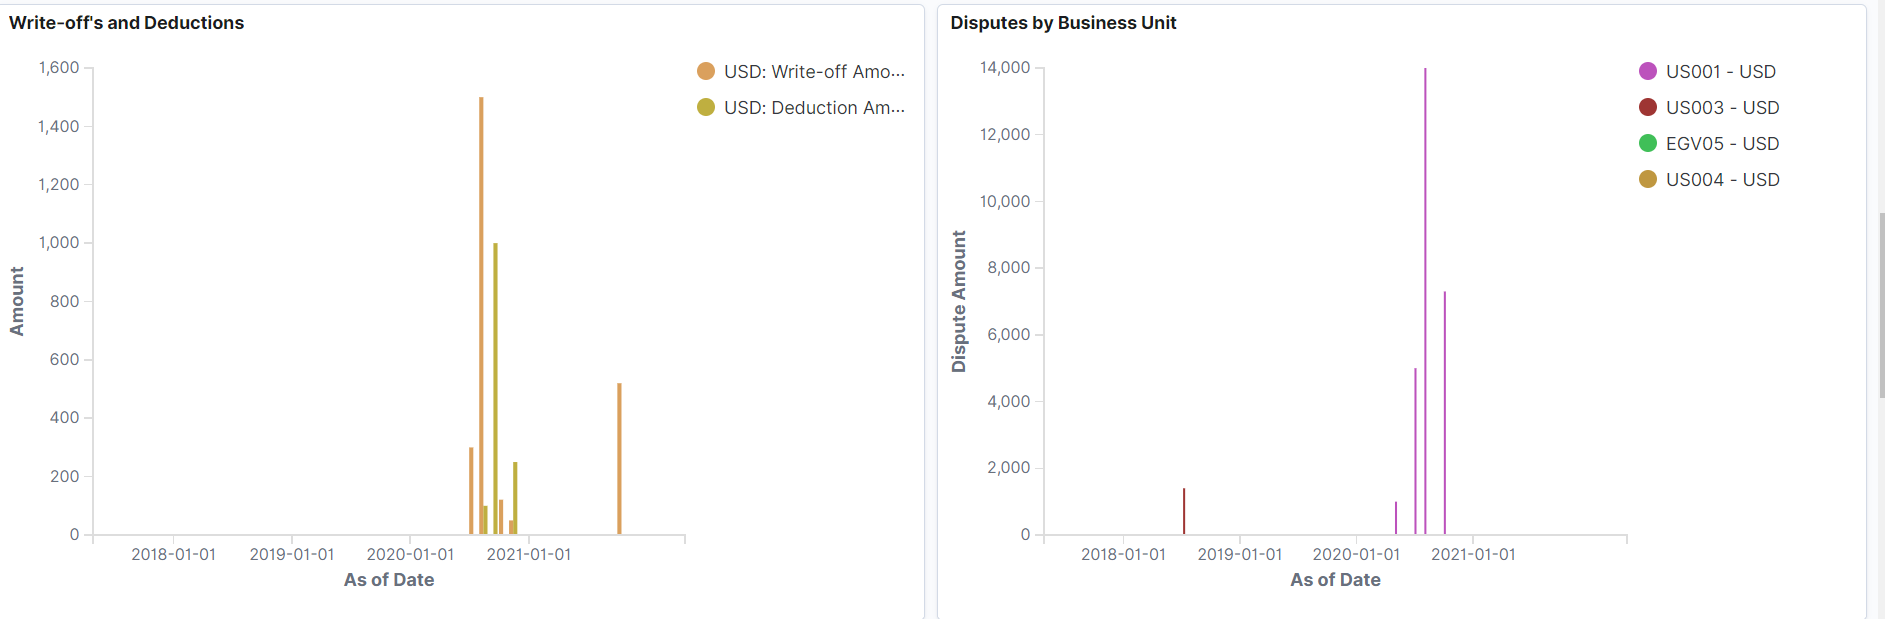
- Write-offs and Deductions visualization displays as of date on X-axis and Amount on Y-axis and helps user analyze and change policies to prevent a sudden increase in write-offs and deductions in future.
- Disputes by Business Unit visualization allows users to identify bottlenecks in resolving disputes.
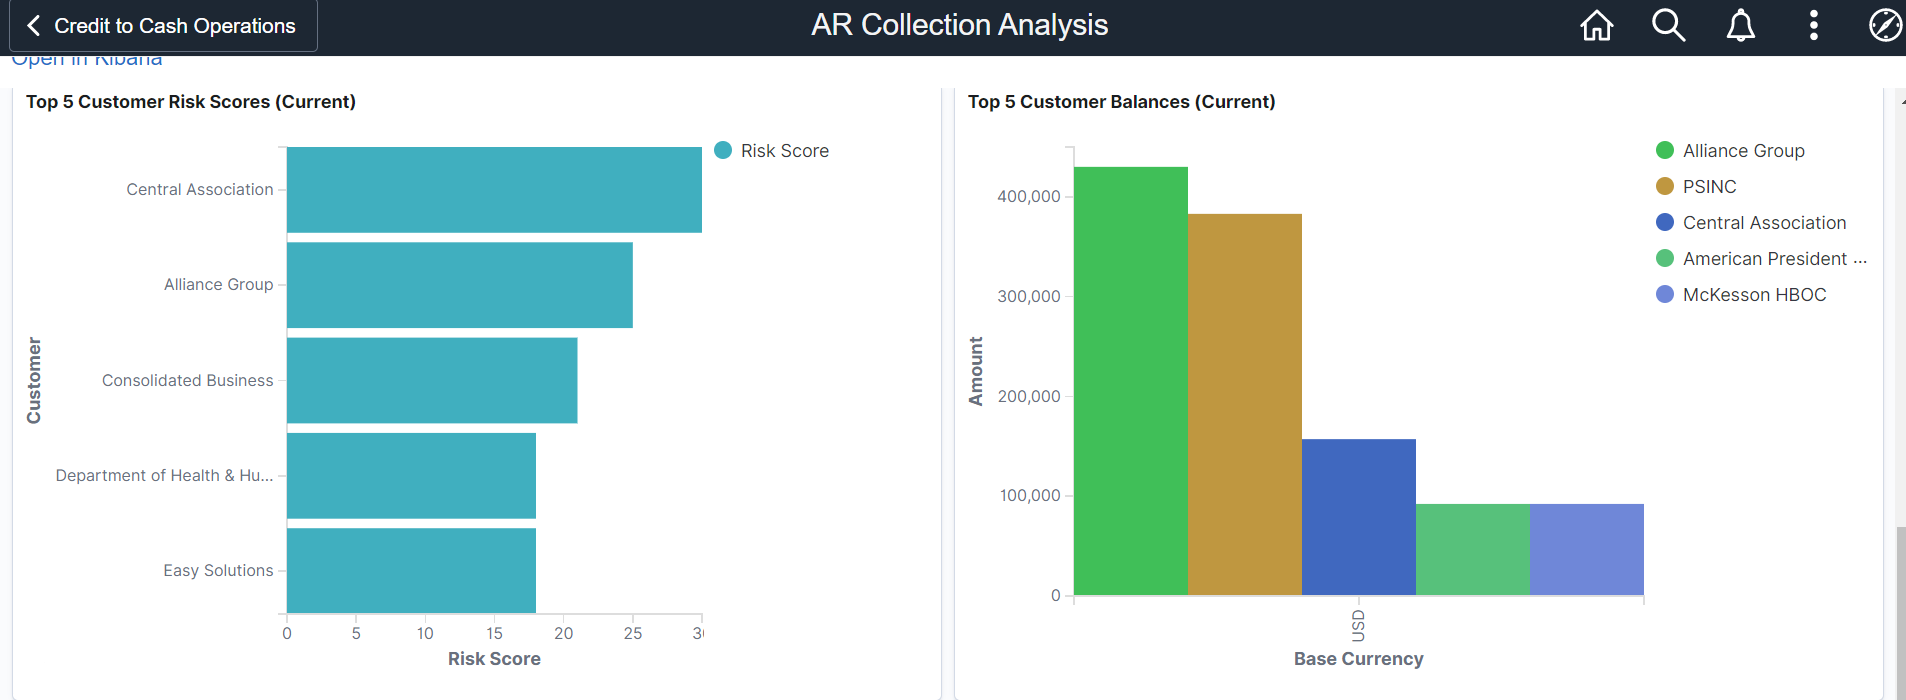
- Top 5 Customer Risk Scores displays risk score on X-axis and customer on Y-axis. With this visualization collection efforts can be prioritized and collectors can focus more on high risk customers.
- Top 5 Customer Balances displays base currency on X-axis and amount on Y-axis.
The Collector Performance Analytics (Figure 2) dashboard helps managers monitor collectors who are responsible for the collection activities. This dashboard displays the following information:
- AR Open vs Closed Items by Collector
- Overdue Balance by Collector & Currency
- Write-offs by Collector
- Credit Memos by Collector
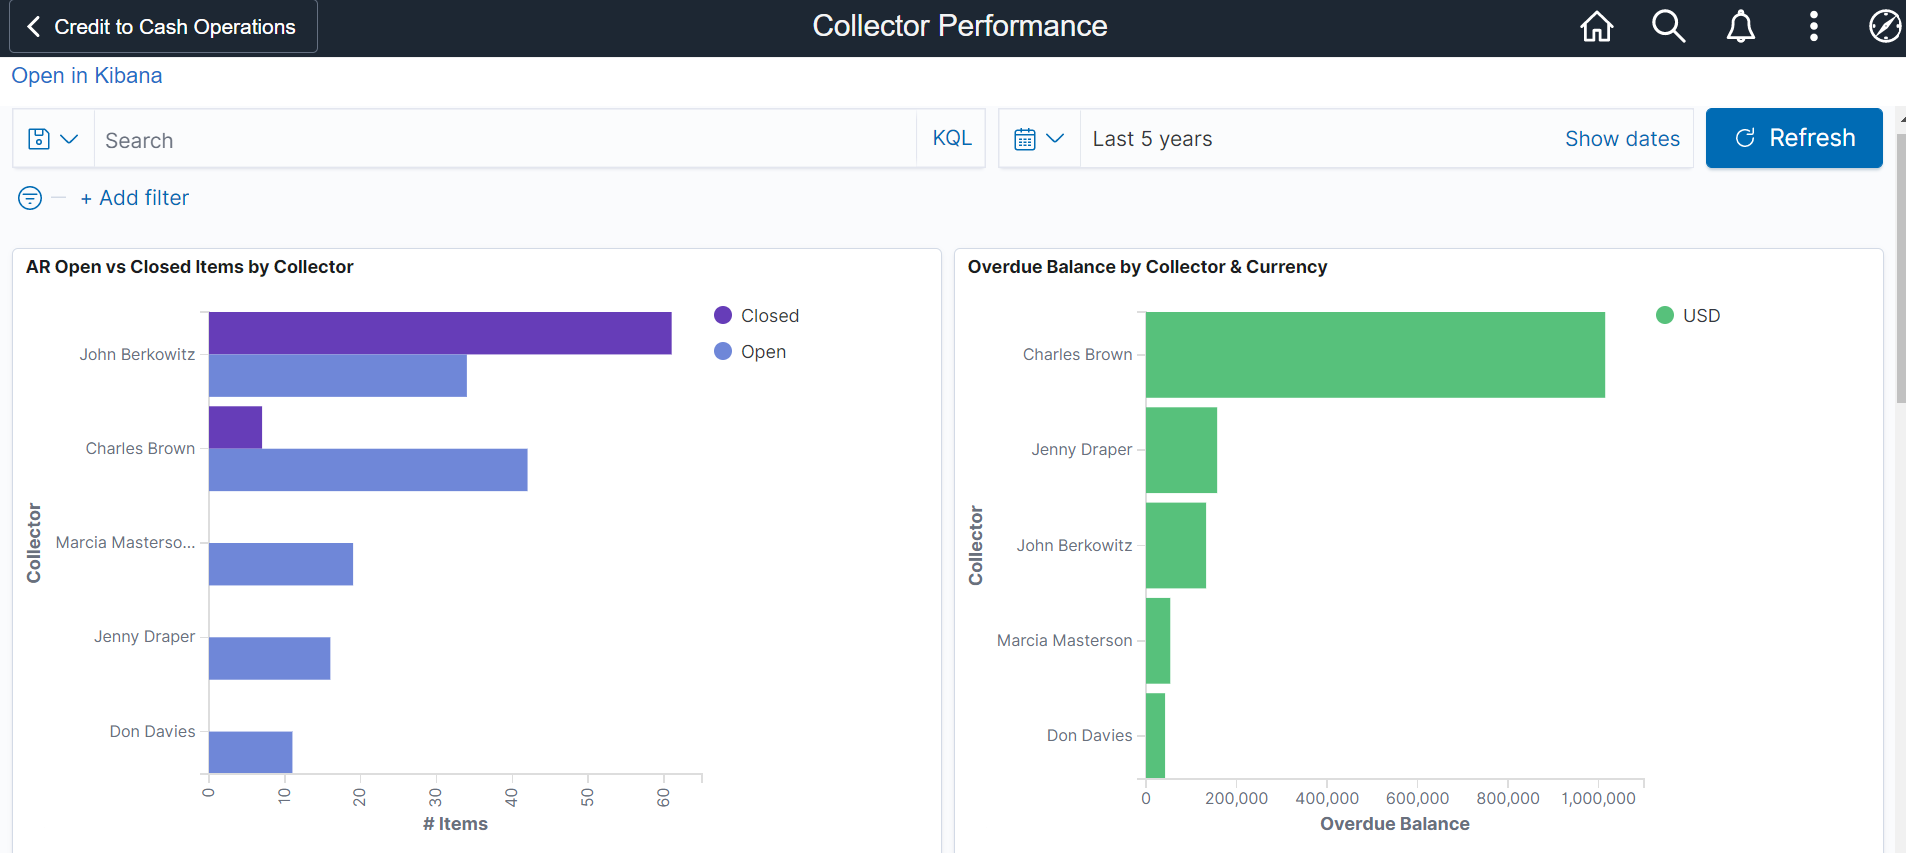
Figure(2) Collector Performance
- With the AR Open vs Closed Items by Collector visualization collectors can quickly view the open items in their queue and take appropriate measures to close transactions faster.
- With Overdue balance visualization a manager can view the overdue balance for each collector and compare collectors based on their outstanding balance.
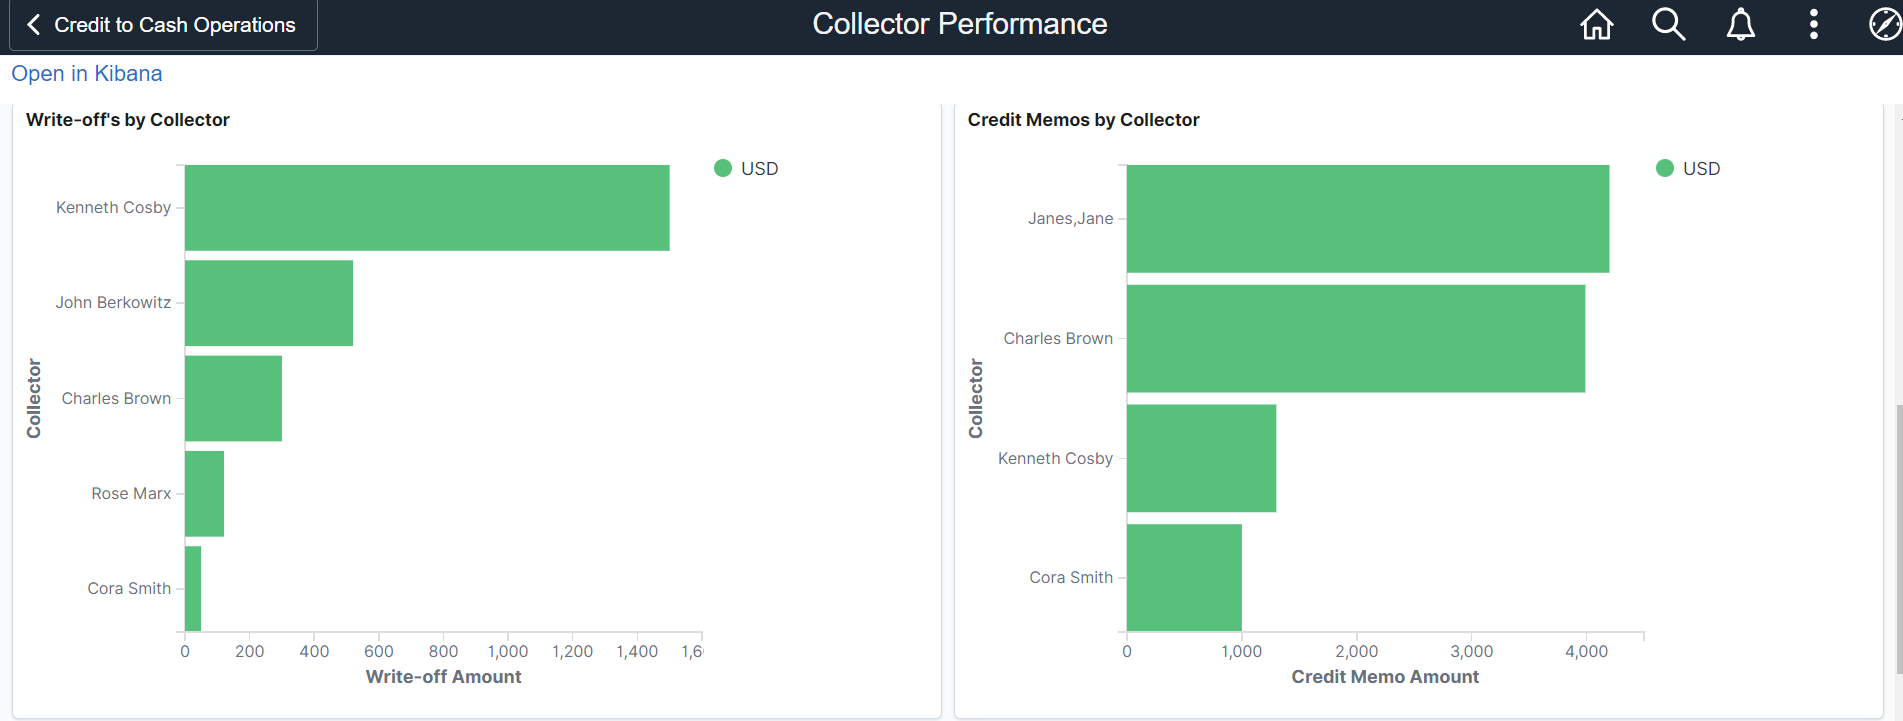
- Write-offs by Collector shows write-off amounts on X-axis vs collectors on Y-axis and shows write-offs collected by collectors.
- Credit Memos by Collector shows credit memo amount on X-axis and collector on Y-axis and shows credit memos issued by collectors.
For further details visit AR Collection Analysis & Collector Performance
