※ 本記事は、Gareth Chapmanによる”Database Performance Tuning – 5 Steps to Resolve Issues“を翻訳したものです。
2024年5月22日
データベースのパフォーマンスチューニングは、データベースの効率を制限する最大の要因を特定し、それを取り除くための活動の集合体です。
通常、これは反復的な作業であり、必要なデータベース・パフォーマンスが得られるまで、1つの要因を潰しては分析し、繰り返し次の要因を潰していく必要があります。
以下のステップバイステップの手順に従って、Oracle Autonomous Health Frameworkを使用したデータベース・パフォーマンスのチューニングを開始してください。 Oracle Autonomous Health Framework.
- データベース・パフォーマンス・チューニングの理解
- データベース・パフォーマンス・チューニングのステップ
データベース・パフォーマンス・チューニングの理解
データベースのパフォーマンスに関する一般的な問題は、2つのカテゴリーに分類されます。
データベース全体のパフォーマンスに影響するものか、クエリ固有のものです。
.
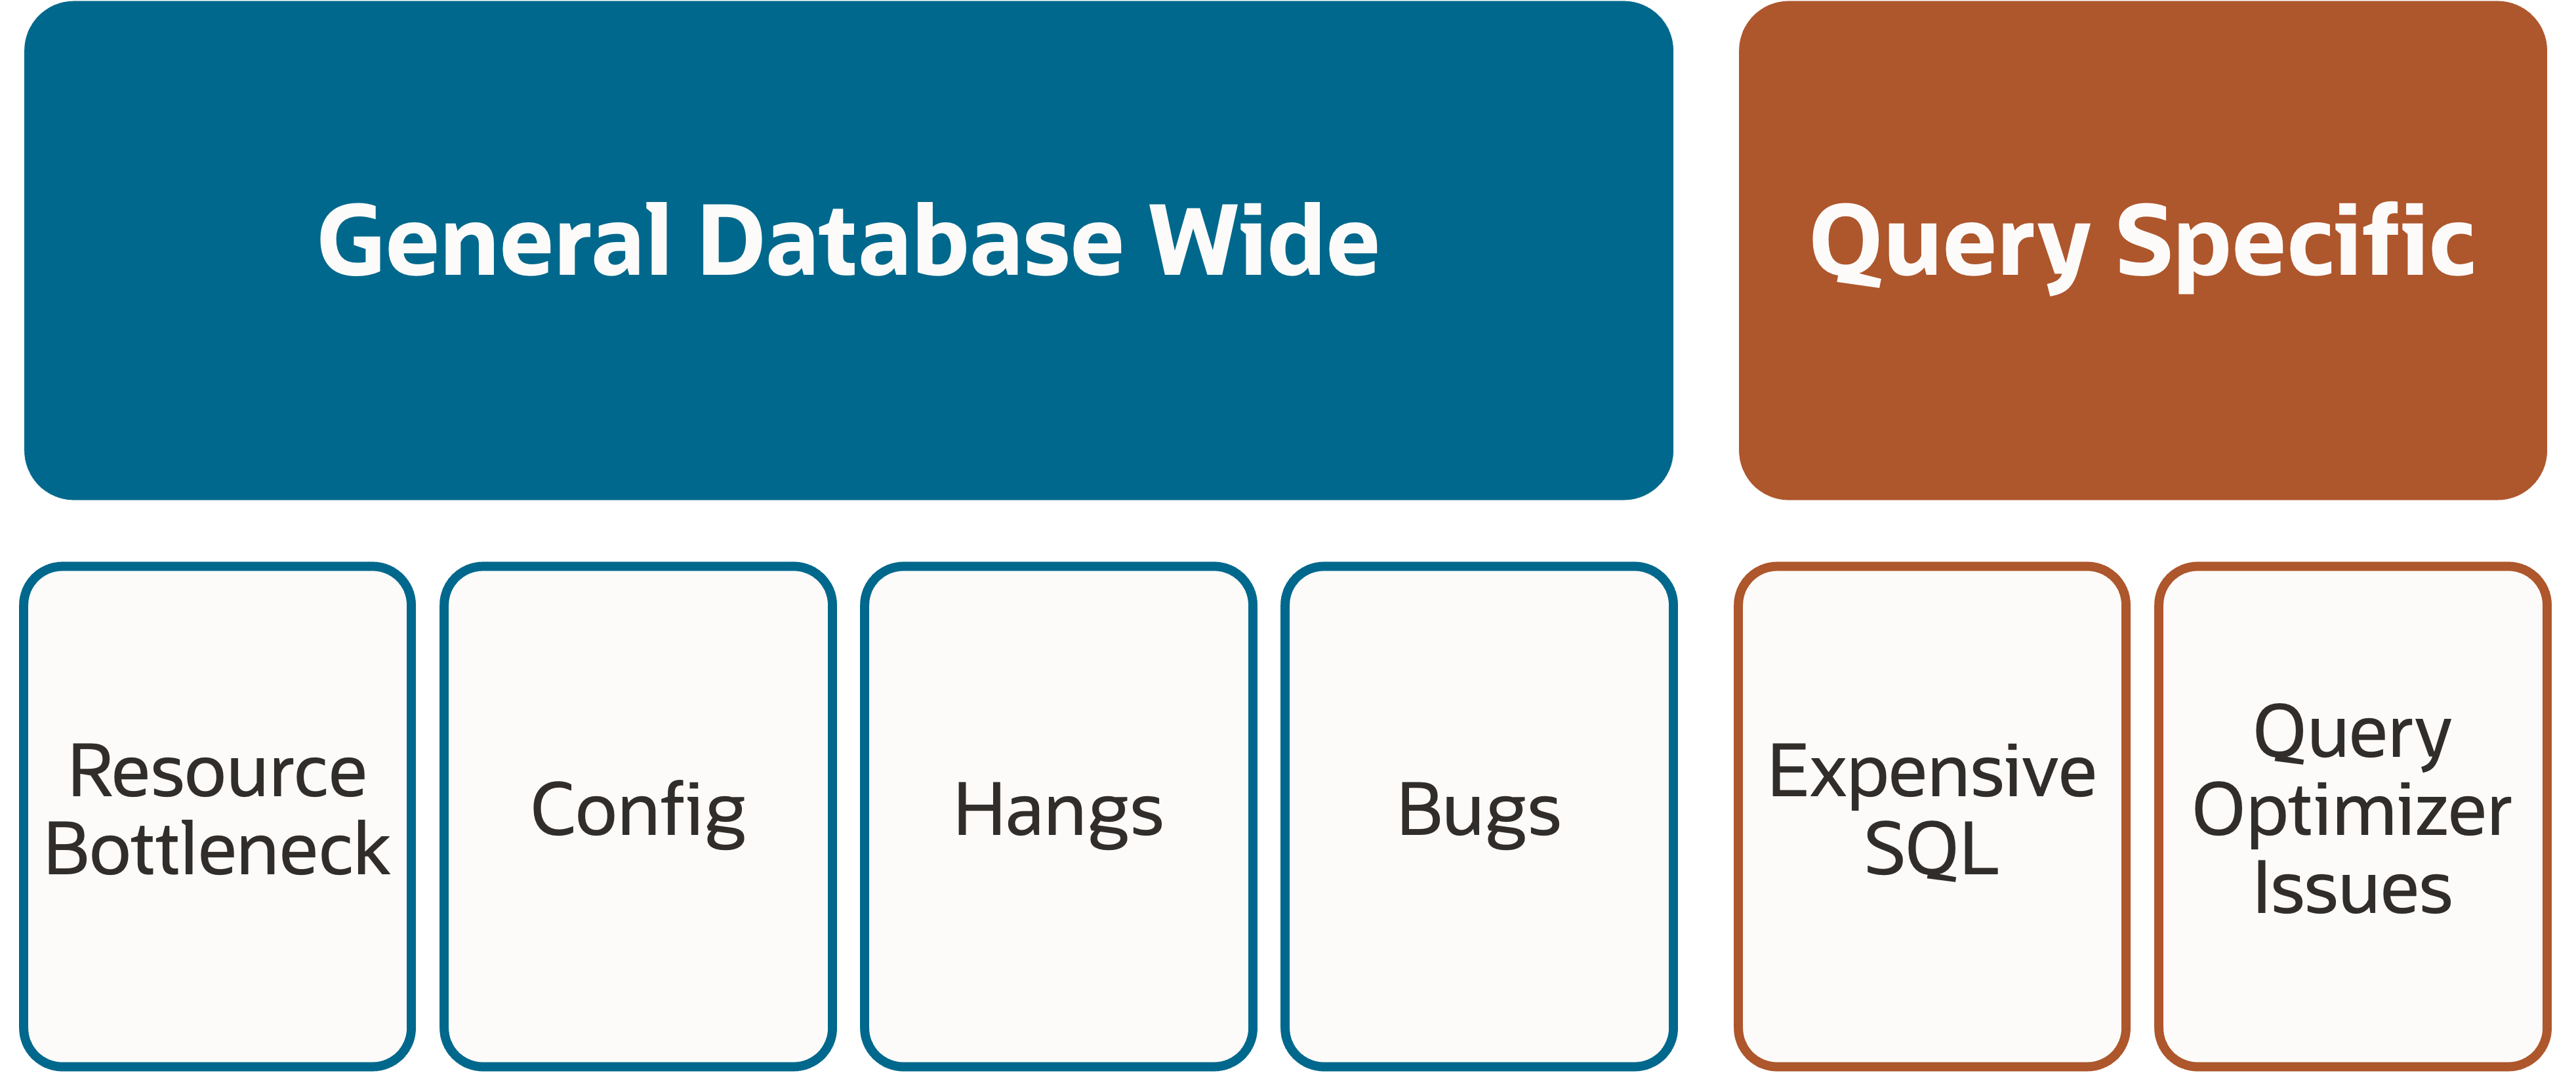
データベース全体の問題は、以下のような原因によって引き起こされます:
- CPU、IO、メモリ、ネットワーク、プロセスなど、何らかのリソースのボトルネック
- 何らかのデータベースの設定ミス
- 何らかのデータベースハング
- バグ
クエリ固有の問題は、以下のような原因によって引き起こされます:
- クエリの構造上、長時間を要する高価なSQL
- クエリの最適化が不十分 – インデックスの不適切さ、統計情報の古さ、実行計画の予期せぬ変更などが原因となる
データベースのパフォーマンスチューニングを開始する際には、これをメンタルモデルとして使用し、根本原因を絞り込みます。
データベース・パフォーマンス・チューニングのステップ
データベース・パフォーマンス・チューニングの基本的なフローは以下の通りです
- Autonomous Health Frameworkを使ったデータベース・パフォーマンス診断の収集
- Autonomous Health Framework インサイトの使用
- Autonomous Health Frameworkを使用して、ノイジー・ネイバーを理解して影響を防ぐ
- Autonomous Health Framework 診断を使用して、パフォーマンスの低いデータベース・ワークロードを特定してチューニング
- Autonomous Health Frameworkの診断収集を使用して新規SRを起票
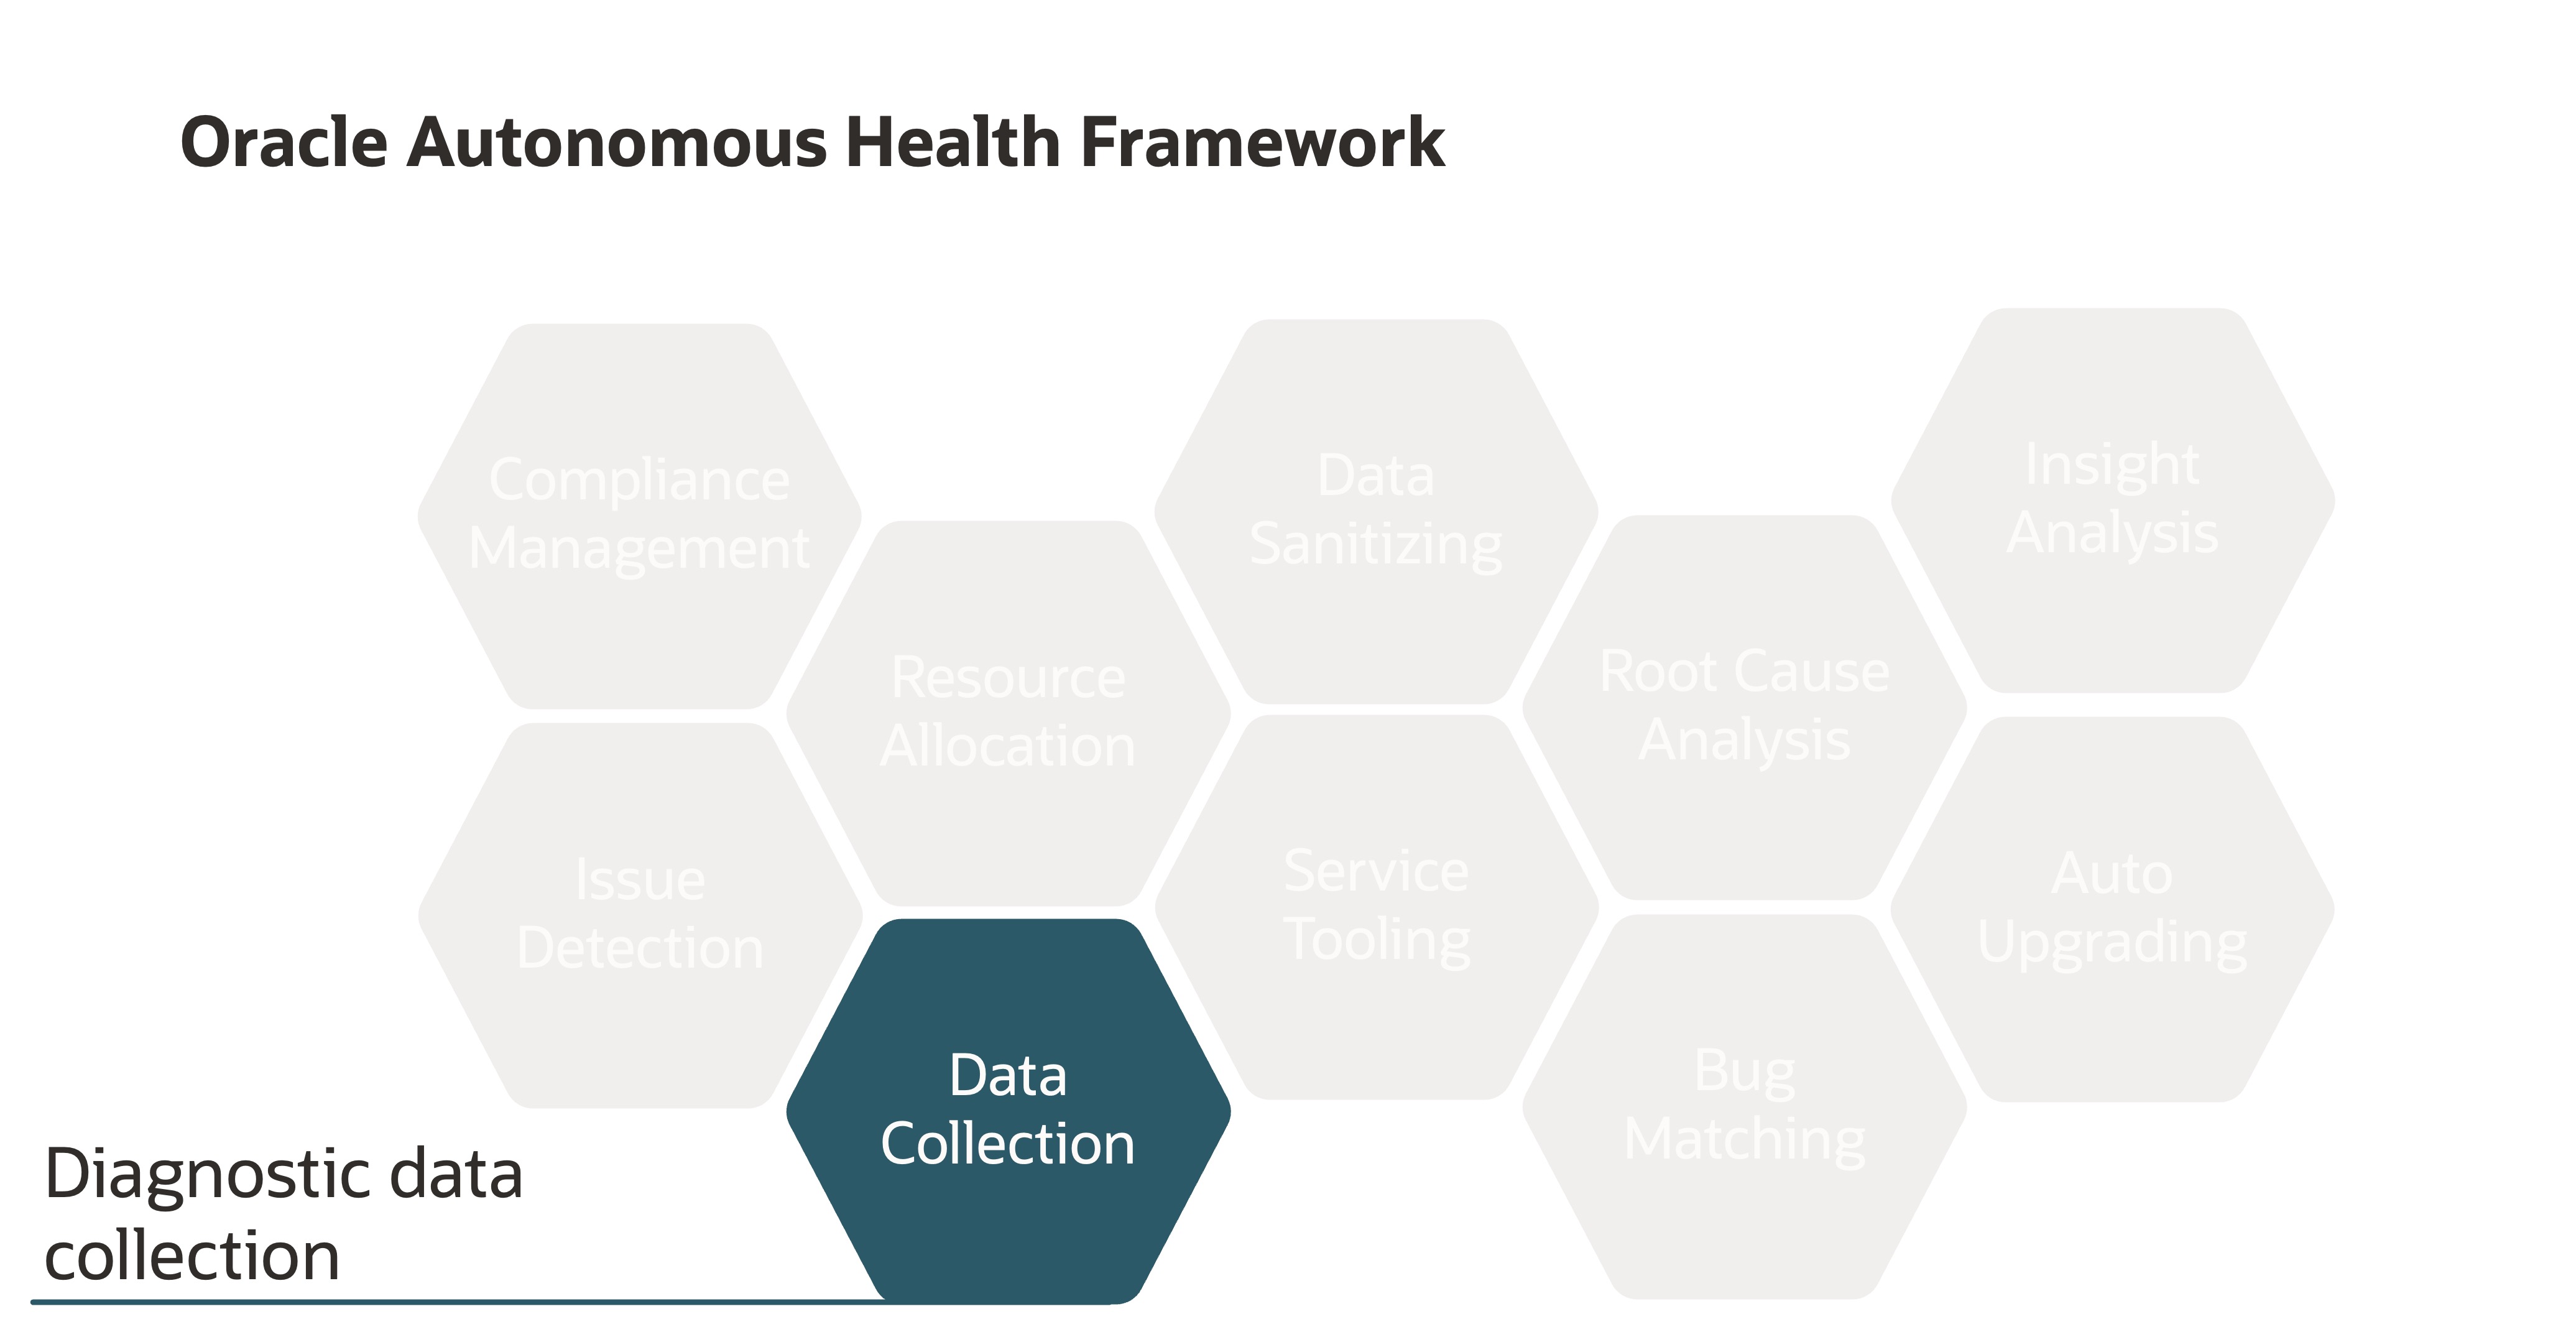
1. Autonomous Health Frameworkを使ったデータベース・パフォーマンス診断の収集
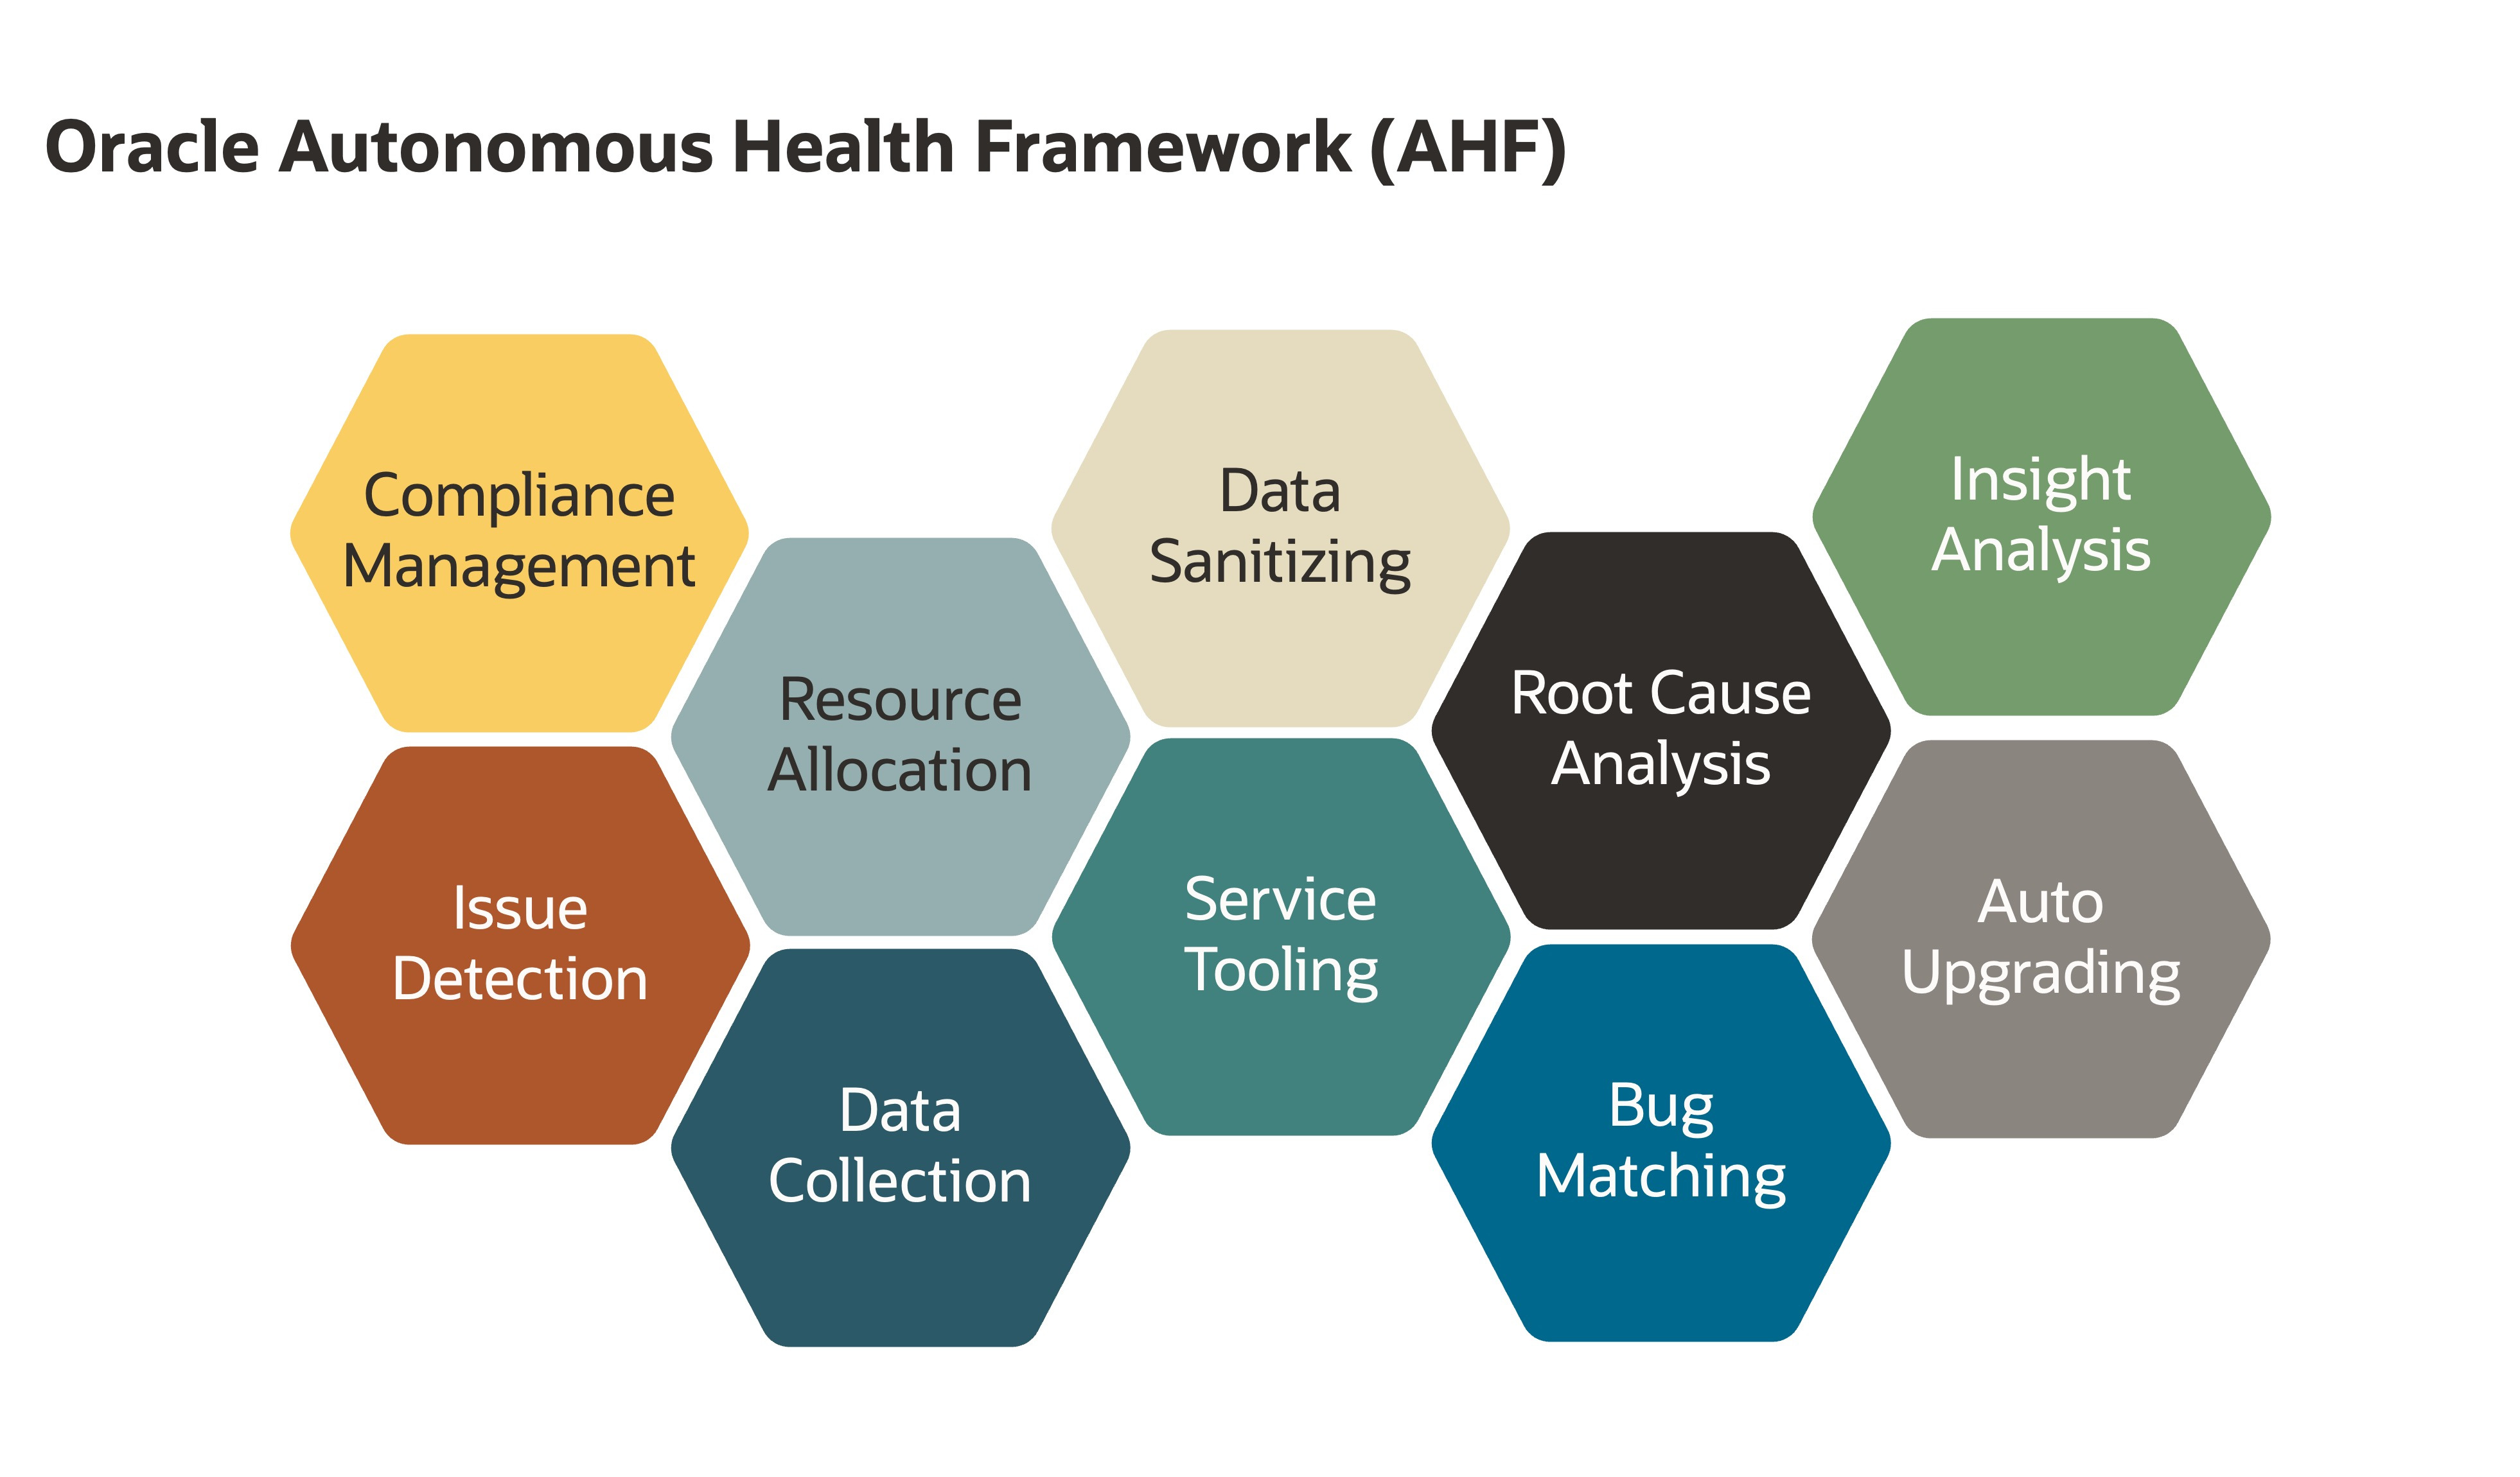
最初のステップでは、Autonomous Health Frameworkを使用して、データベースのパフォーマンス診断コレクションを生成します。
Autonomous Health Frameworkは、データベースの保守を容易にすることを目的とした一連の機能を提供します。
Autonomous Databaseの実行を維持するためにOracleがクラウドで使用するのと同じテクノロジであり、既存のソフトウェア・サポート契約の一部として追加コストなしで利用できます。
My Oracle Supportにログインし、Autonomous Health Framework – Including Trace File Analyzer and Orachk/Exachk (Doc ID 2550798.1)からダウンロード可能です。
Autonomous Health Frameworkは、様々なタイプの診断収集を収集でき、問題固有のSRDCはその1つです。
Autonomous Health Frameworkの前に、Oracle Supportから、データベース・パフォーマンス・チューニングのためのSRDCまたはサービス・リクエスト・データ収集の一環として、様々なステップを実行するように求められた場合があります。これは、さまざまなログを収集し、トリミングし、スクリプトを実行することを含み、それを正しく実行する方法を理解するためには、ビデオを見たり、他の知識文書を読んだりする必要がある。
このSRDCロジックはすべてAutonomous Health Frameworkにパッケージ化されており、1つのコマンドですべてをキャプチャすることができます。
データベース・パフォーマンスの問題が発生したマシンにログインし、Oracleユーザーとしてコマンドを実行:
tfactl diagcollect srdc –dbperf –database <database_name>
Autonomous Health Framework 現在パフォーマンスに問題があるかどうかを確認し、必要な診断をすべて収集できるよう、一連の質問と回答を通じてあなたをガイドします。
例
$ tfactl diagcollect -srdc dbperf -database db23cdb1
Do you have a performance issue now [Y|N] [Y]: Y
Enter duration of the issue in hours [<RETURN>=1h]: 1h
As you have indicated that the performance issue is currently happening,
Performance Reports will be collected for the following periods:
Start time when the performance was bad: 2024-05-01 15:13:32
Stop time when the performance was bad: 2024-05-01 16:13:32
For comparison, it is useful to gather data from another period with similar load where problems are not seen. Typically this is likely to be the same time period on a previous day. To compare to the same time period on a previous day enter the number of days ago you wish to use. [<RETURN> to provide other time range]: 1
Start time when the performance was good 2024-04-30 15:13:32
Stop time when the performance was good 2024-04-30 16:13:32
Has any SQL been identified to contribute to the performance issue?[Y|N]: N
Do you wish to take an AWR Dump as part of this collection? [Y|N]: N

Ending AWR snapshot successfully created.
Found 3 snapshot(s) for Bad Performance time range in  ORCL
Found 3 snapshot(s) for baseline range in  ORCL
"Automatic Workload Repository (AWR) is a licensed feature. Refer to My Oracle Support Document ID 1490798.1 for more information"

Components included in this collection: DATABASE CHMOS CHA OS INSIGHT
Preparing to execute support diagnostic scripts.
 Executing DB Script srdc_db_lfsdiag.sql on db23cdb1 with timeout of 120 seconds...
 Executing DB Script srdc_real_time_addm.sql on db23cdb1 with timeout of 120 seconds...
 Executing DB Script srdc_statsadvisor_report.sql on db23cdb1 with timeout of 300 seconds...
 Executing DB Script collect_logon_logoff_triggers.sql on db23cdb1 with timeout of 300 seconds...
 Executing OS Script get_perfhub_report with timeout of 600 seconds...
Collecting data for all nodes
TFA is using system timezone for collection, All times shown in UTC.
Scanning files from 2024-05-01 15:13:32 UTC to 2024-05-01 16:13:32 UTC
Collection Id : 20240501161522machine1
Detailed Logging at : /u01/app/giusr/oracle.ahf/data/repository/srdc_dbperf_collection_Wed_May_01_16_15_27_UTC_2024_node_all/diagcollect_20240501161522_machine1.log
Waiting up to 120 seconds for collection to start
2024/05/01 16:15:43 UTC : NOTE : Any file or directory name containing the string .com will be renamed to replace .com with dotcom
2024/05/01 16:15:43 UTC : Collection Name : tfa_srdc_dbperf_Wed_May_01_16_15_26_UTC_2024.zip
2024/05/01 16:15:43 UTC : Collecting diagnostics from hosts : [machine1, machine3, machine2, machine4]
2024/05/01 16:15:45 UTC : Getting list of files satisfying time range [05/01/2024 15:13:32, 05/01/2024 16:13:32]
2024/05/01 16:15:45 UTC : Collecting Additional Diagnostic Information...
2024/05/01 16:16:48 UTC : Executing DB Script awr_reports on db23cdb1 with timeout of 3600 seconds...
2024/05/01 16:16:57 UTC : Completed Collection of Additional Diagnostic Information for Insights...
2024/05/01 16:18:56 UTC : Collecting ADR incident files...
2024/05/01 16:20:32 UTC : Executing Applicable ORAchk Validations with timeout of 600 seconds...
2024/05/01 16:24:16 UTC : Executing IPS Incident Package Collection(s)...
2024/05/01 16:24:25 UTC : No ADR Incidents for db23cdb1 covering period "2024-05-01 15:13:32" to "2024-05-01 16:13:32" were generated, IPS Pack will not be collected.
2024/05/01 16:24:25 UTC : Executing SQL Script db_feature_usage.sql on db23cdb1 with timeout of 600 seconds...
2024/05/01 16:24:25 UTC : Executing Collection for OS with timeout of 1800 seconds...
2024/05/01 16:24:39 UTC : Completed Collection of Additional Diagnostic Information...
2024/05/01 16:24:47 UTC : Completed Local Collection
2024/05/01 16:24:47 UTC : Not Redacting this Collection ...
2024/05/01 16:24:47 UTC : Remote Collection in Progress...
2024/05/01 16:24:48 UTC : Collection completed on host: machine2
2024/05/01 16:24:48 UTC : Collection completed on host: machine3
2024/05/01 16:24:48 UTC : Collection completed on host: machine4
2024/05/01 16:24:52 UTC : Executing Creation of insights zip with timeout of 900 seconds...
2024/05/01 16:28:49 UTC : Report is generated at : /u01/app/giusr/oracle.ahf/data/repository/srdc_dbperf_collection_Wed_May_01_16_15_27_UTC_2024_node_all/machine1_insights_2024_05_01_16_24_55.zip
2024/05/01 16:28:49 UTC : Finished creation of insights zip with status 0
2024/05/01 16:28:50 UTC : Collection completed on host: machine1
2024/05/01 16:28:49 UTC : Completed collection of zip files.
.-----------------------------------------.
|            Collection Summary           |
+---------------+-----------+------+------+
| Host          | Status    | Size | Time |
+---------------+-----------+------+------+
| machine2 	    | Completed | 13MB | 289s |
| machine3 	    | Completed | 12MB | 332s |
| machine4 	    | Completed | 13MB | 420s |
| machine1 	    | Completed | 17MB | 544s |
'---------------+-----------+------+------'
Logs are being collected to: /u01/app/giusr/oracle.ahf/data/repository/srdc_dbperf_collection_Wed_May_01_16_15_27_UTC_2024_node_all
/u01/app/giusr/oracle.ahf/data/repository/srdc_dbperf_collection_Wed_May_01_16_15_27_UTC_2024_node_all/machine1.tfa_srdc_dbperf_Wed_May_01_16_15_26_UTC_2024.zip
/u01/app/giusr/oracle.ahf/data/repository/srdc_dbperf_collection_Wed_May_01_16_15_27_UTC_2024_node_all/machine2.tfa_srdc_dbperf_Wed_May_01_16_15_26_UTC_2024.zip
/u01/app/giusr/oracle.ahf/data/repository/srdc_dbperf_collection_Wed_May_01_16_15_27_UTC_2024_node_all/machine3.tfa_srdc_dbperf_Wed_May_01_16_15_26_UTC_2024.zip
/u01/app/giusr/oracle.ahf/data/repository/srdc_dbperf_collection_Wed_May_01_16_15_27_UTC_2024_node_all/machine4.tfa_srdc_dbperf_Wed_May_01_16_15_26_UTC_2024.zip
/u01/app/giusr/oracle.ahf/data/repository/srdc_dbperf_collection_Wed_May_01_16_15_27_UTC_2024_node_all/machine1_insights_2024_05_01_16_24_55.zip
それが終わると、Autonomous Health Frameworkは各マシンのzipファイルにすべてをパッケージします。
この例では、Autonomous Health Frameworkが各マシンのzipを生成していますが、ほとんどの場合、必要なのは収集を実行したマシンのzipだけです。
ステップ2に進みます。Autonomous Health Framework Insightsを使って、推奨事項を見つけます。
2. Autonomous Health Framework インサイトの使用
収集を開始したマシンからウェブブラウザのあるマシンに診断zipを転送し、解凍します。
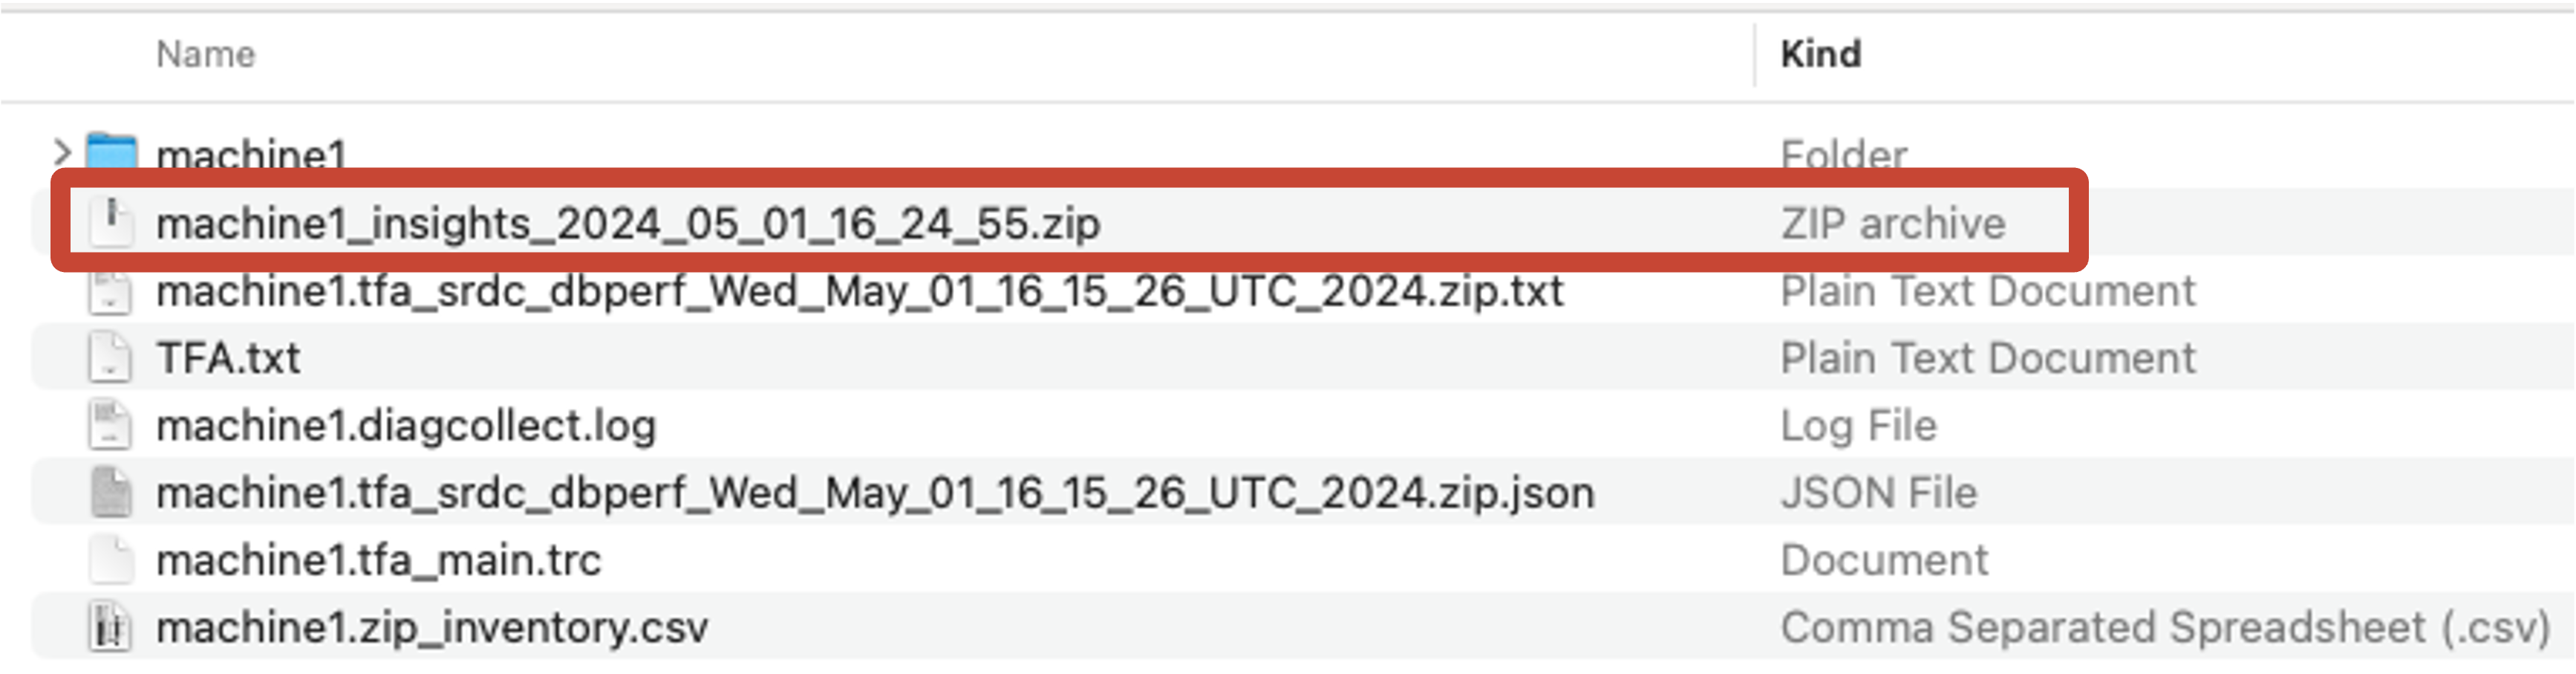
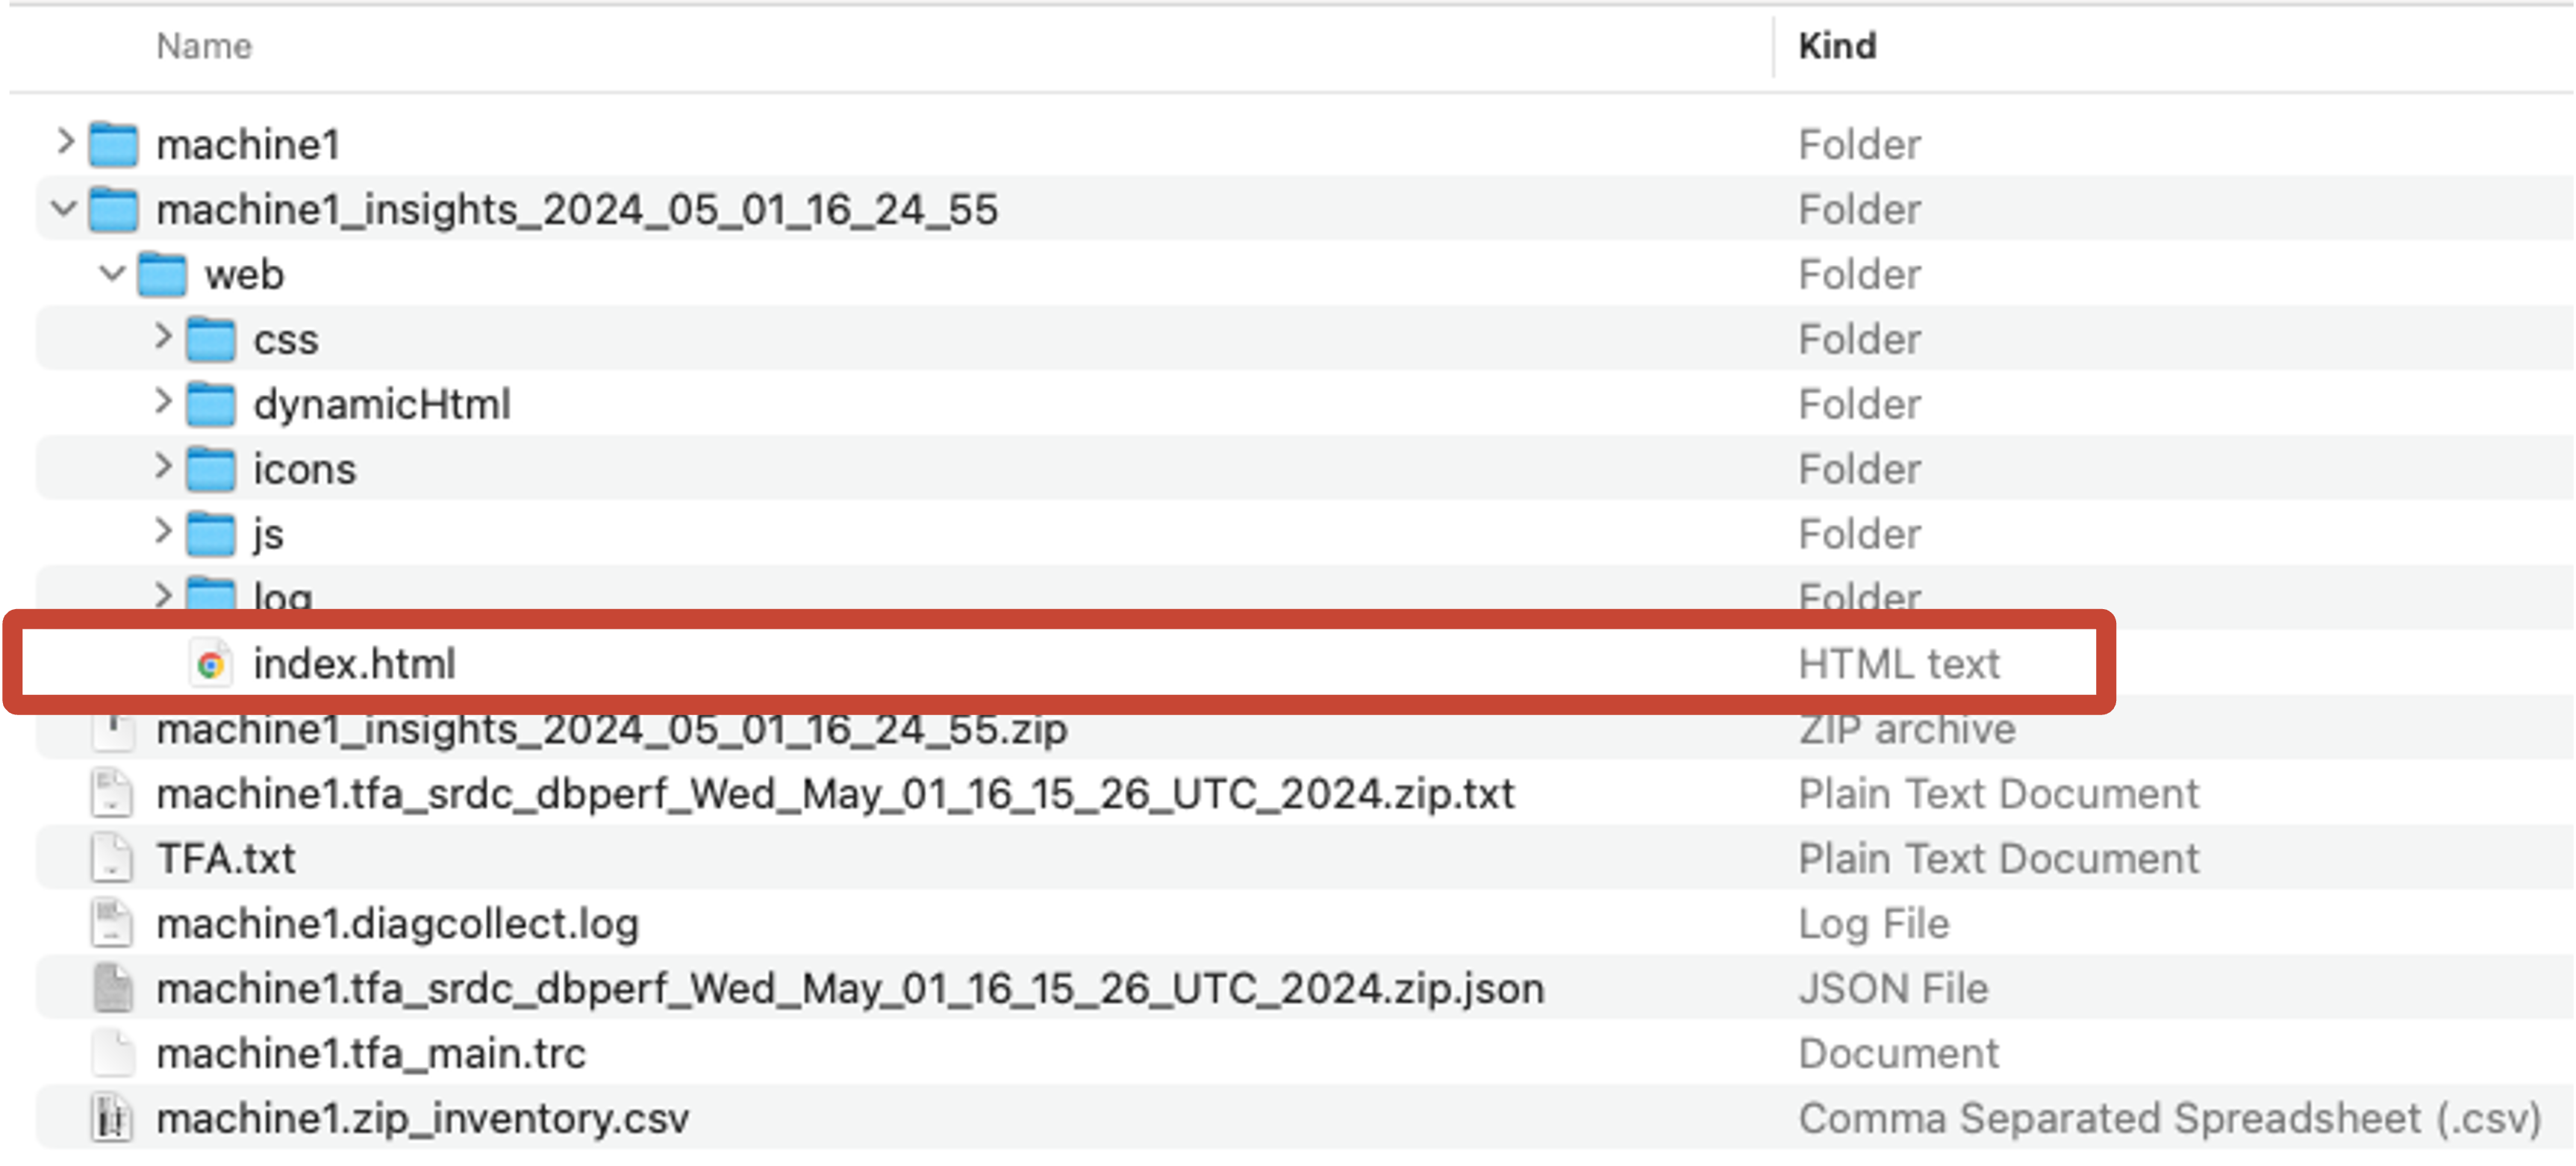
この中に、Autonomous Health Framework Insightsを含む別のzipがあります。
それを取り出し、index.htmlを開いてください。
a. ベストプラクティスと構成を比較
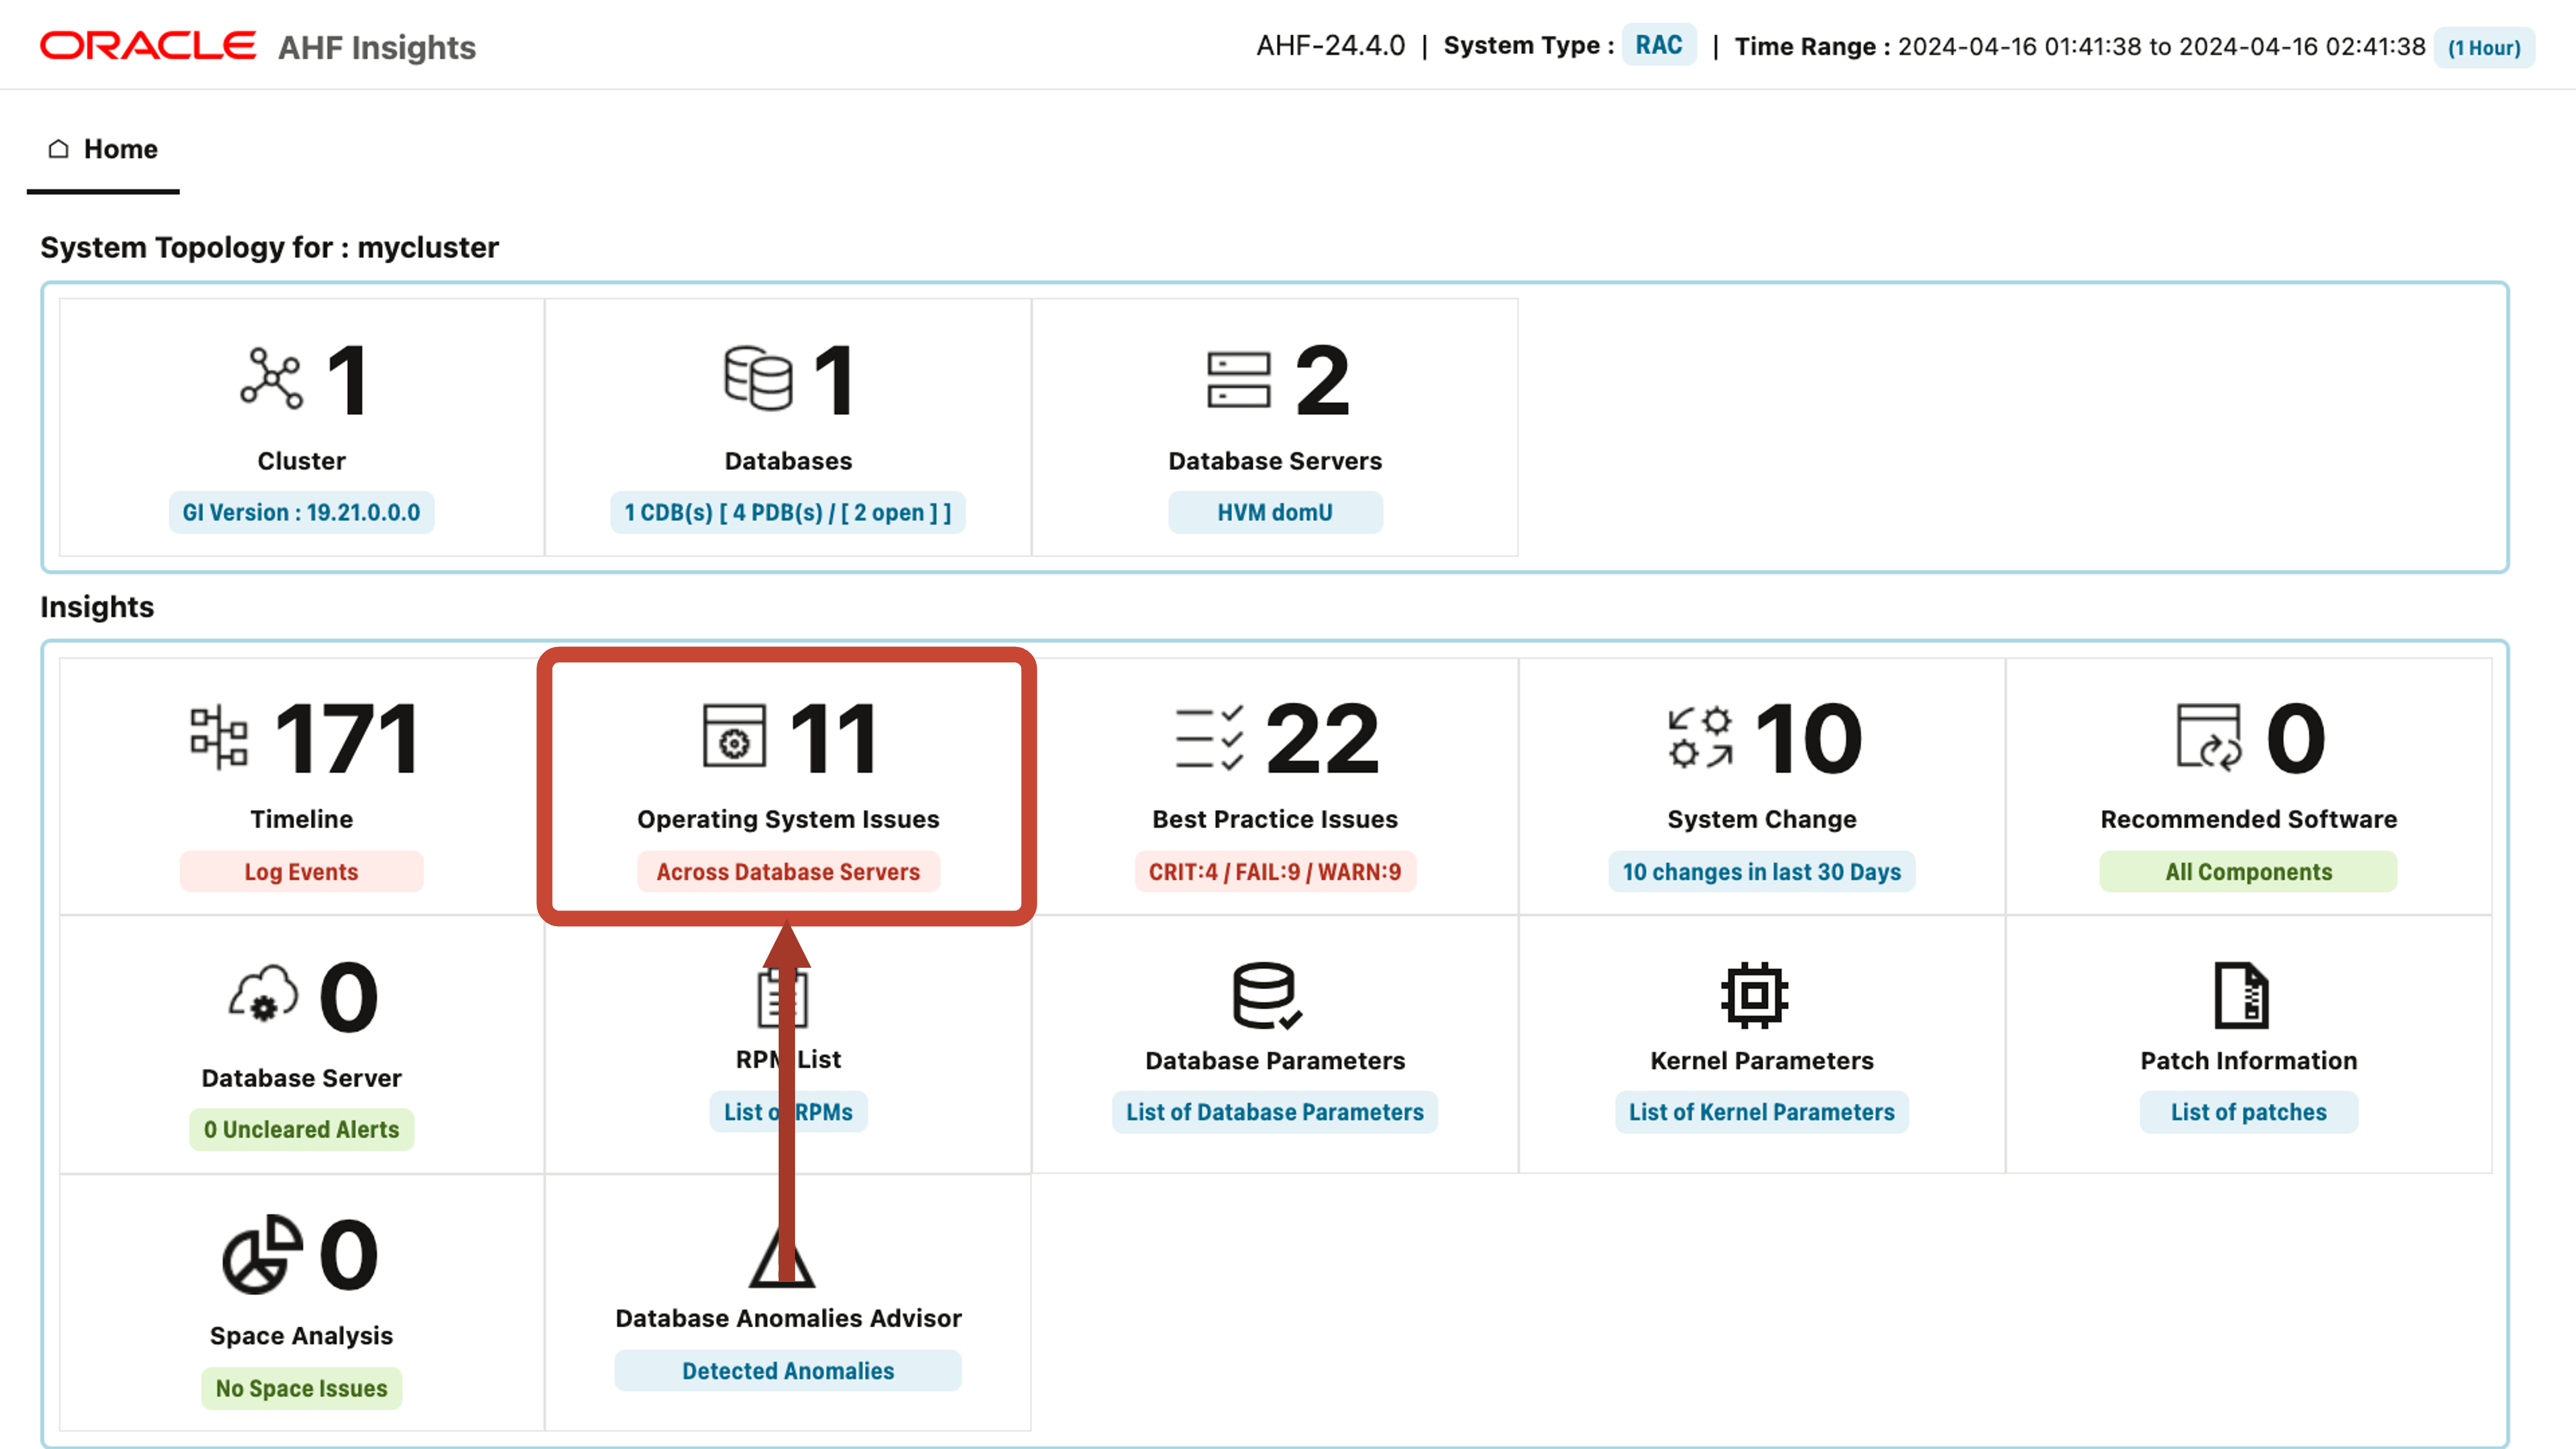
Autonomous Health Framework インサイトは、システム全体を俯瞰することができます。これを使用して問題を発見し、根本原因を掘り下げて解決方法を理解することができます。
まず、オラクルのベスト・プラクティスから外れていないかどうかを確認するために、関連する構成の問題を探します。
ベスト・プラクティスの問題をクリックして、掘り下げていきます。
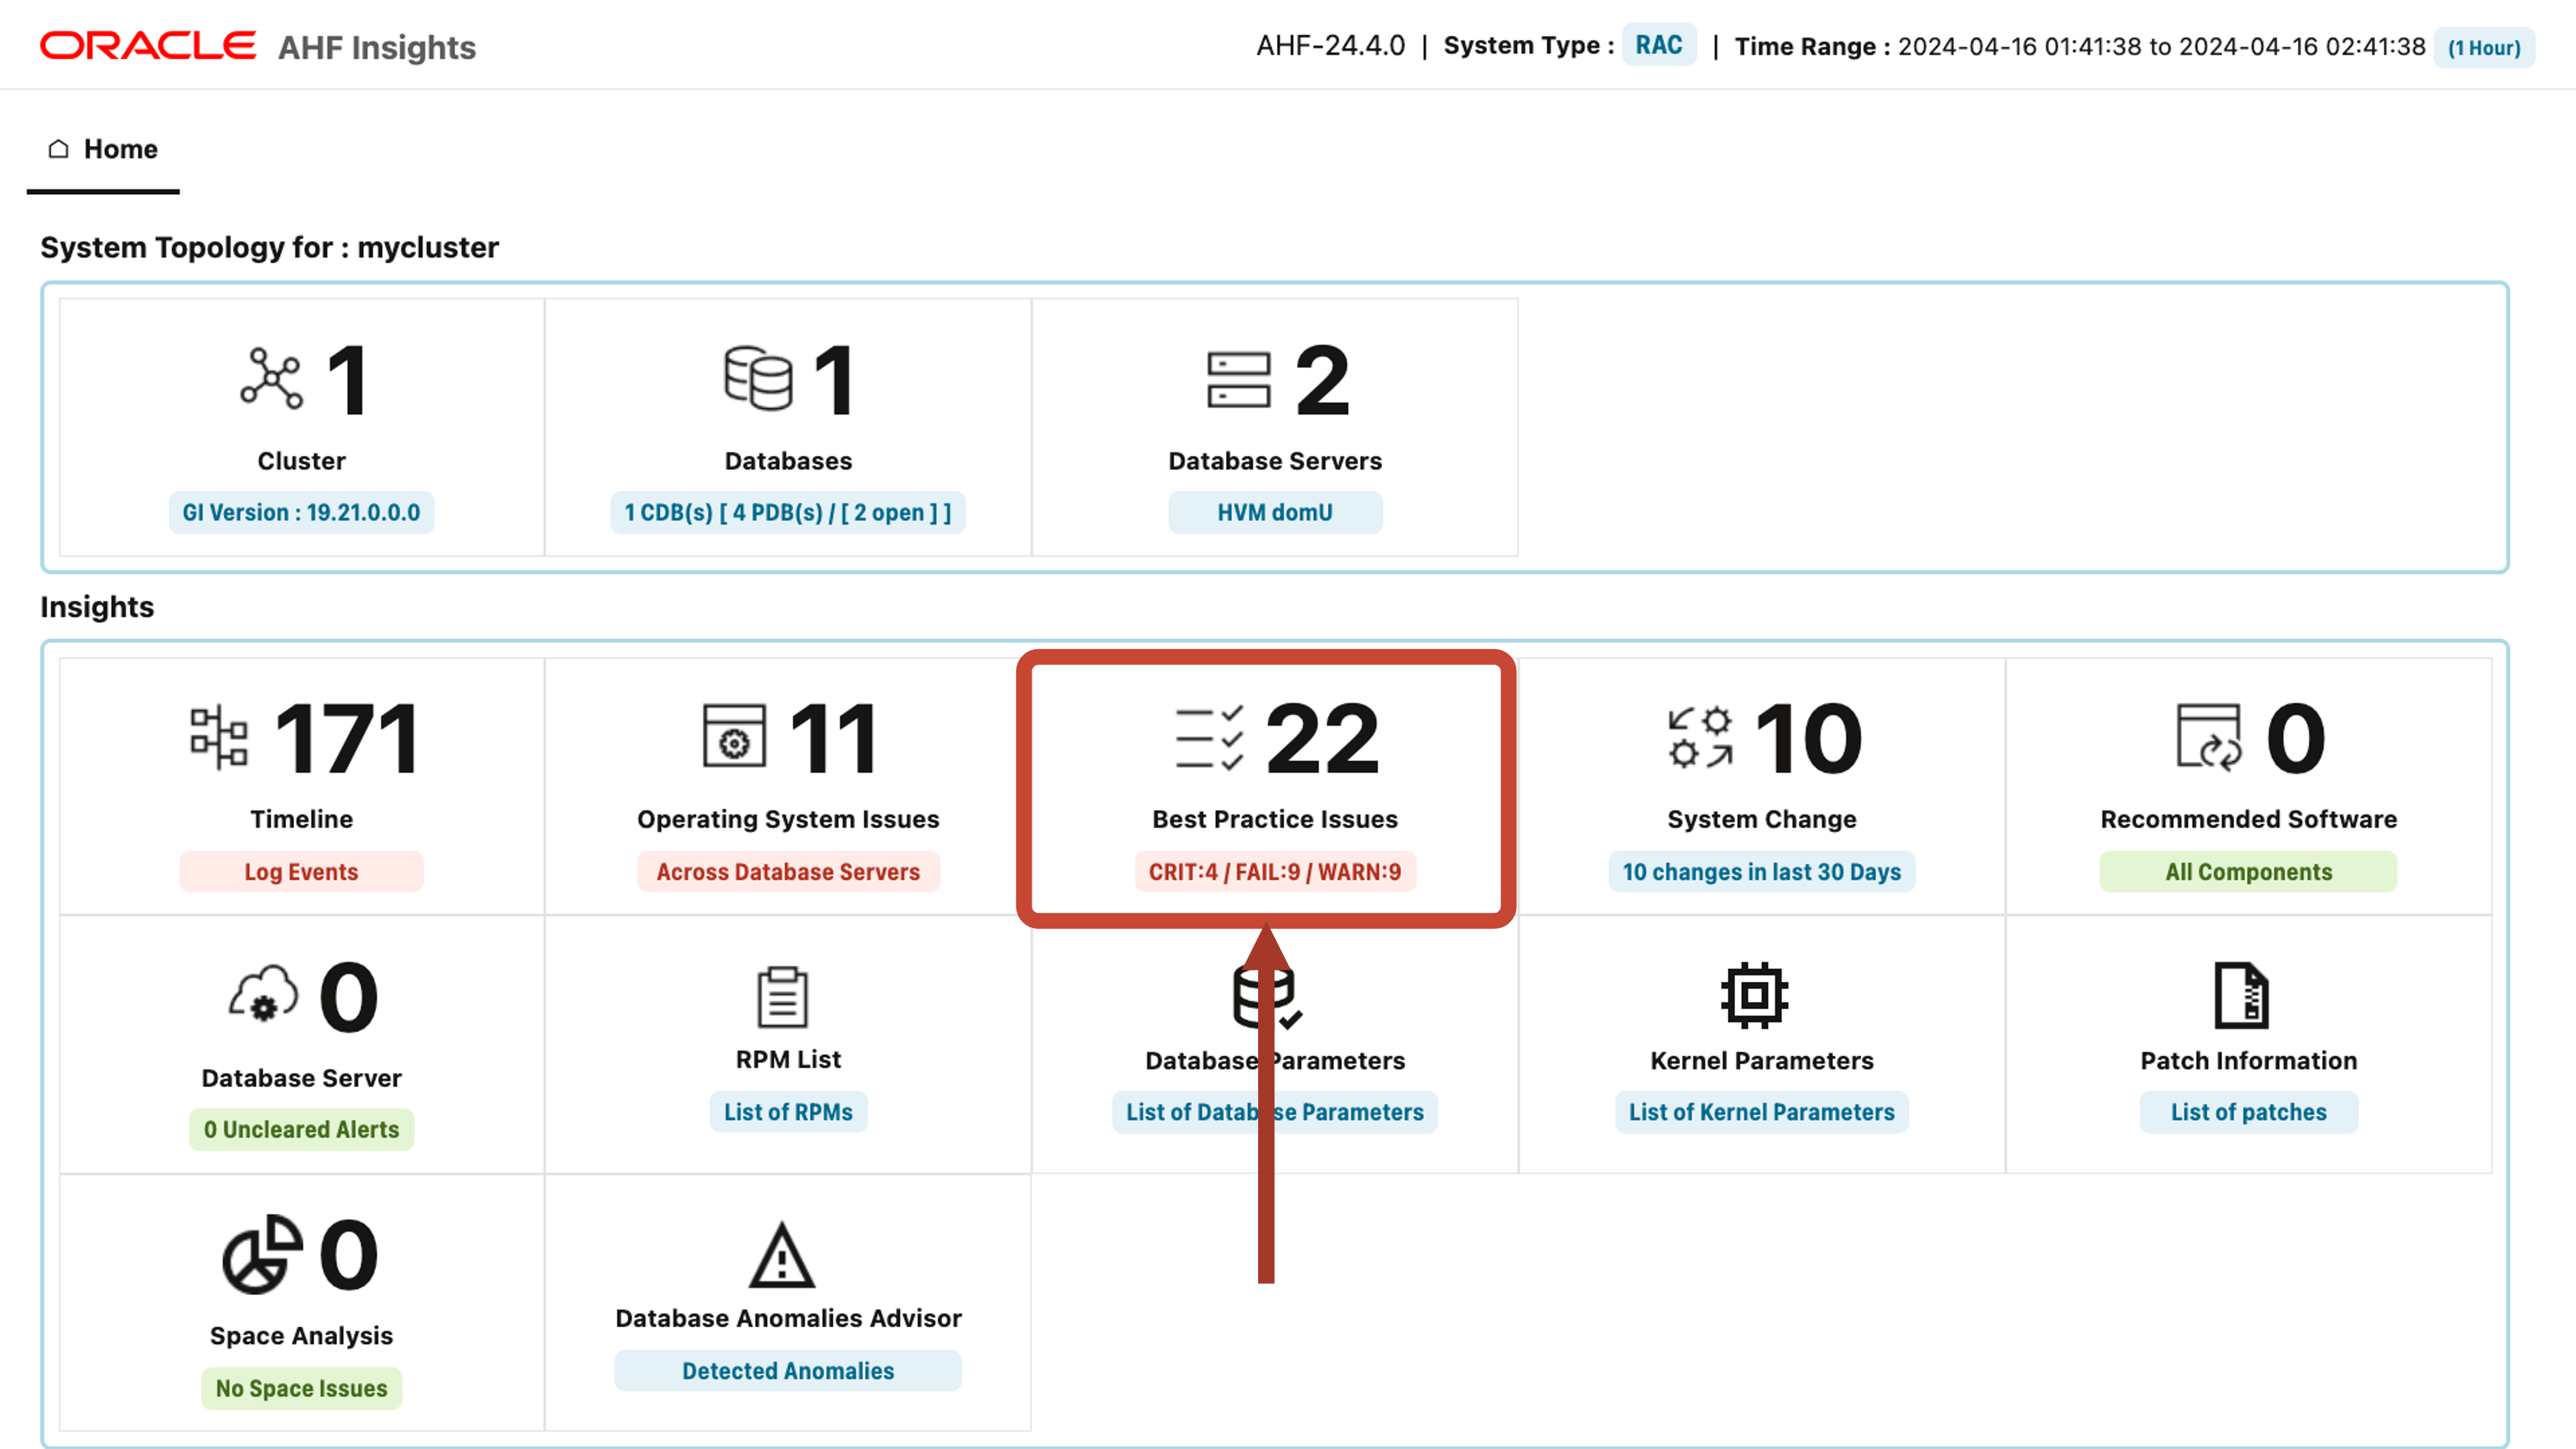
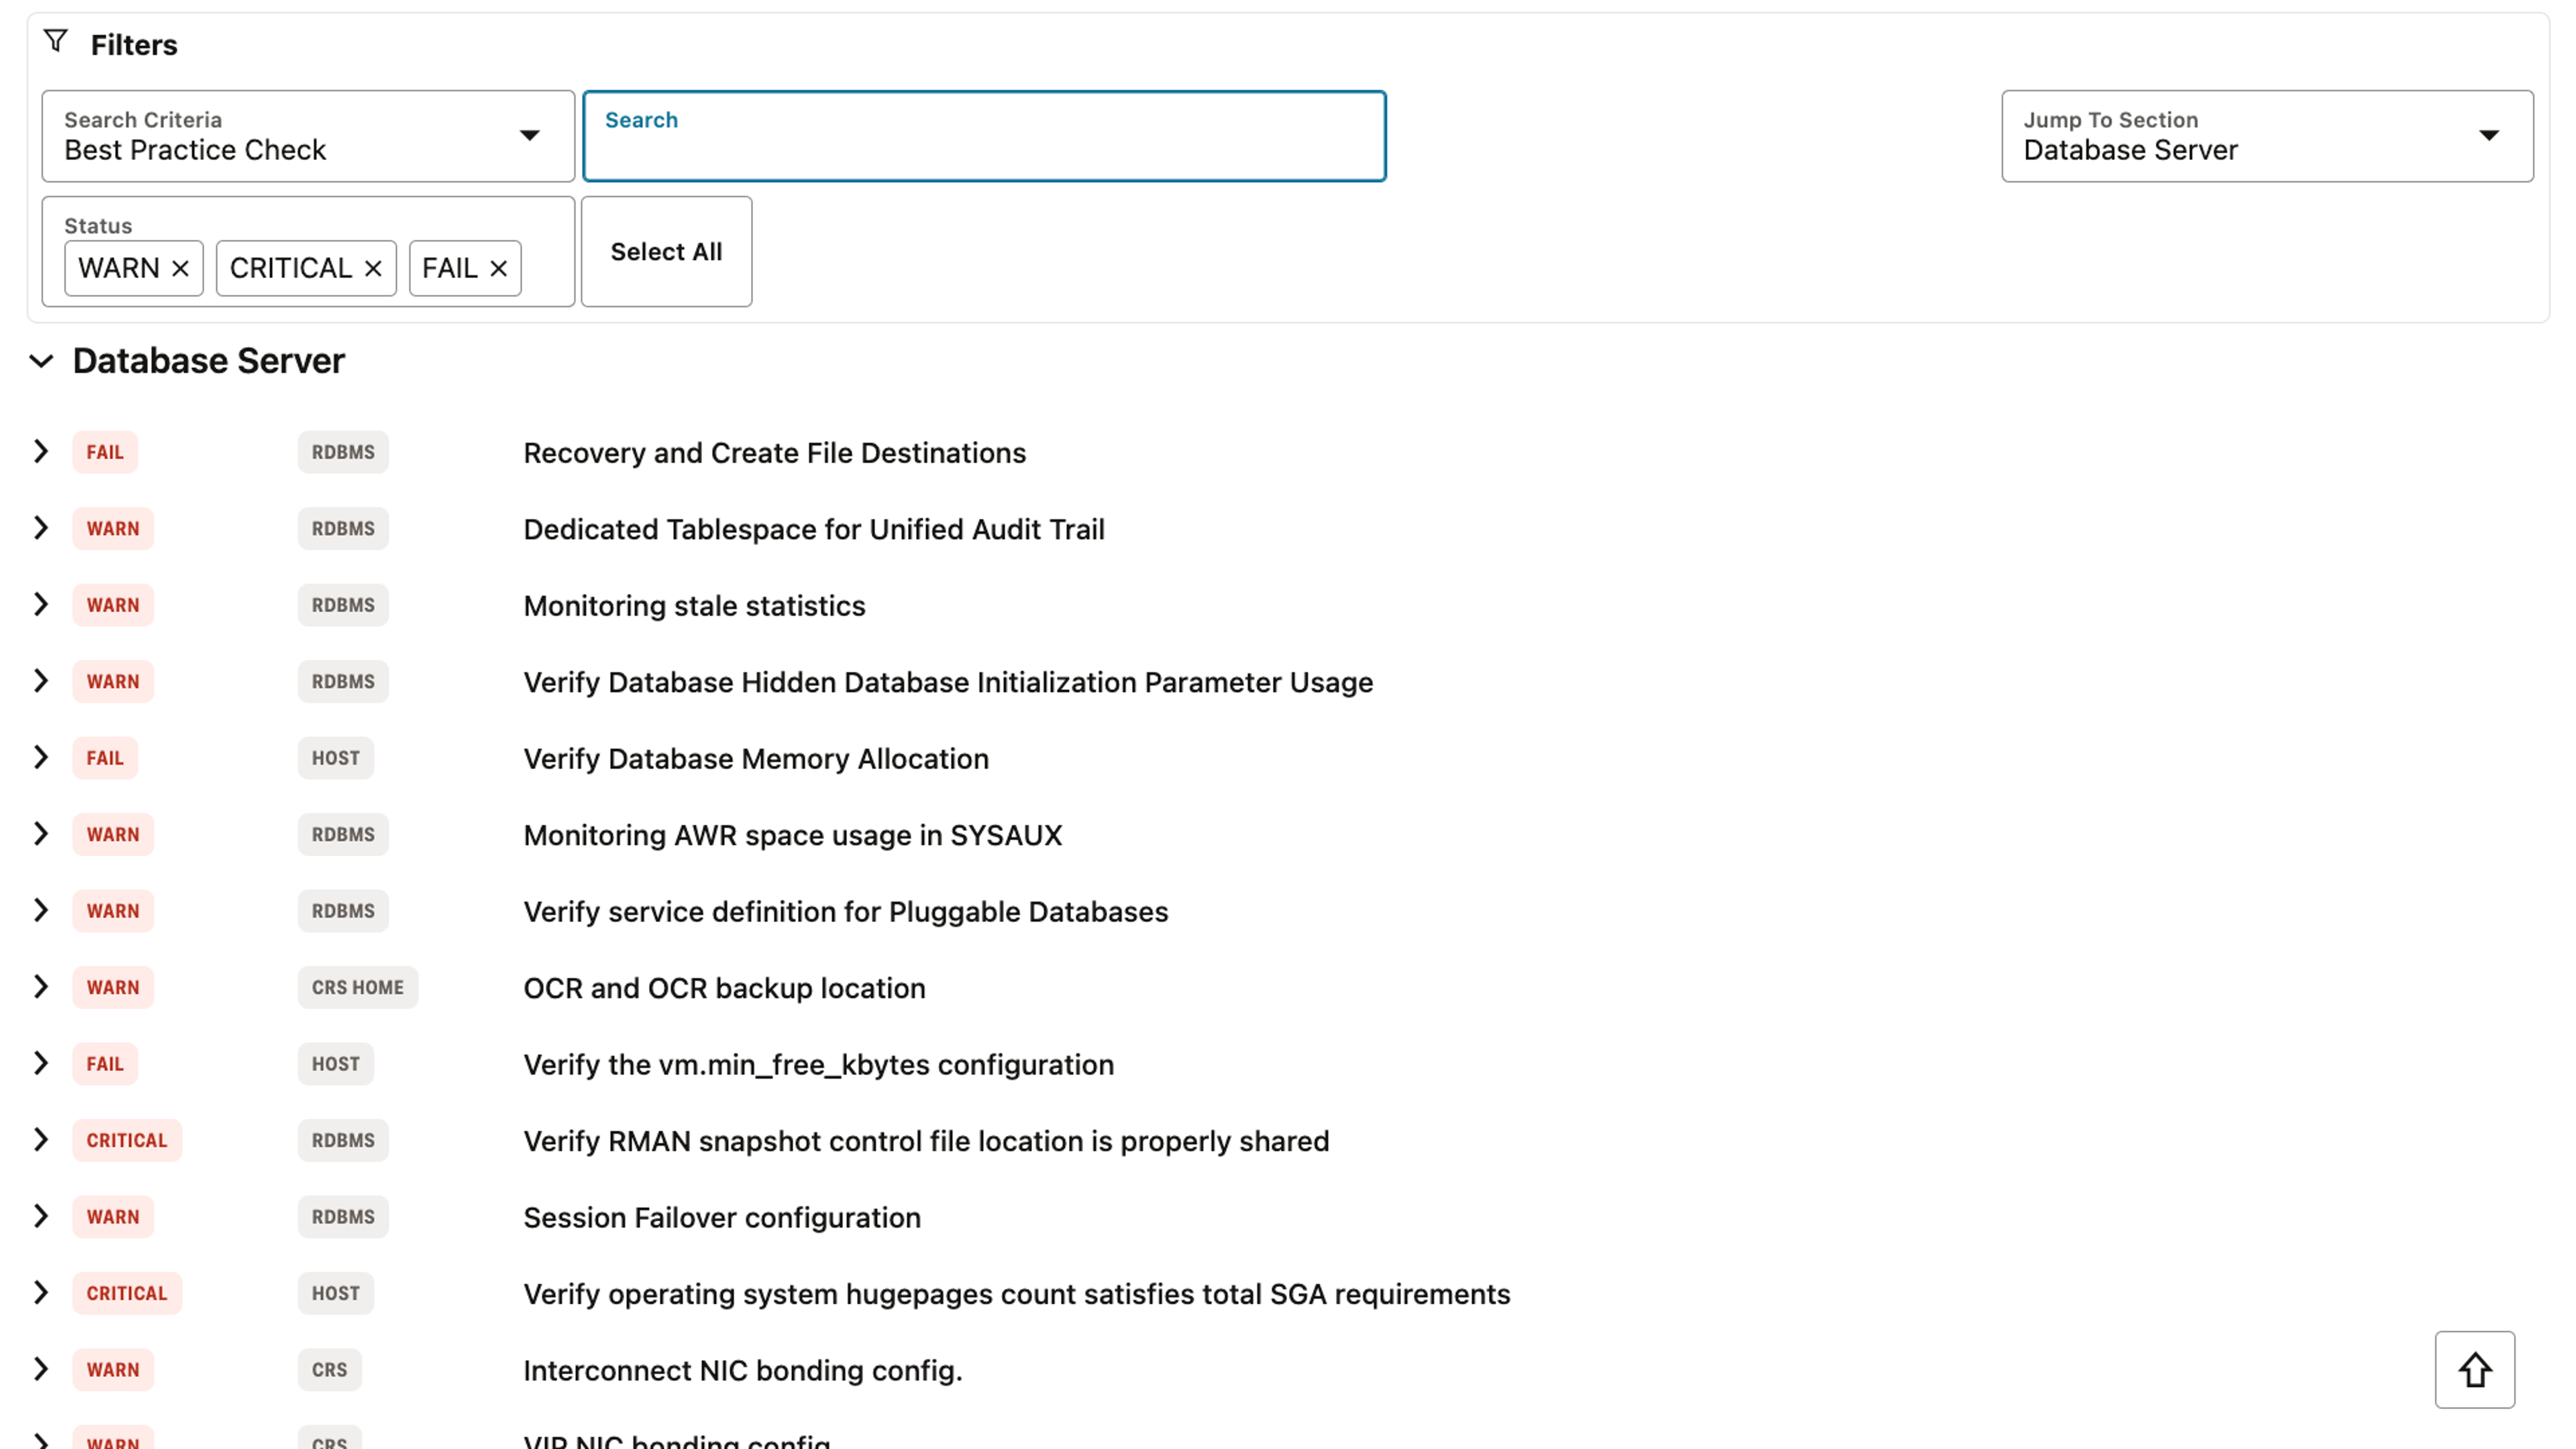
サマリは、システムでベストプラクティスから逸脱している箇所と、相対的な重大度の概要を提供します
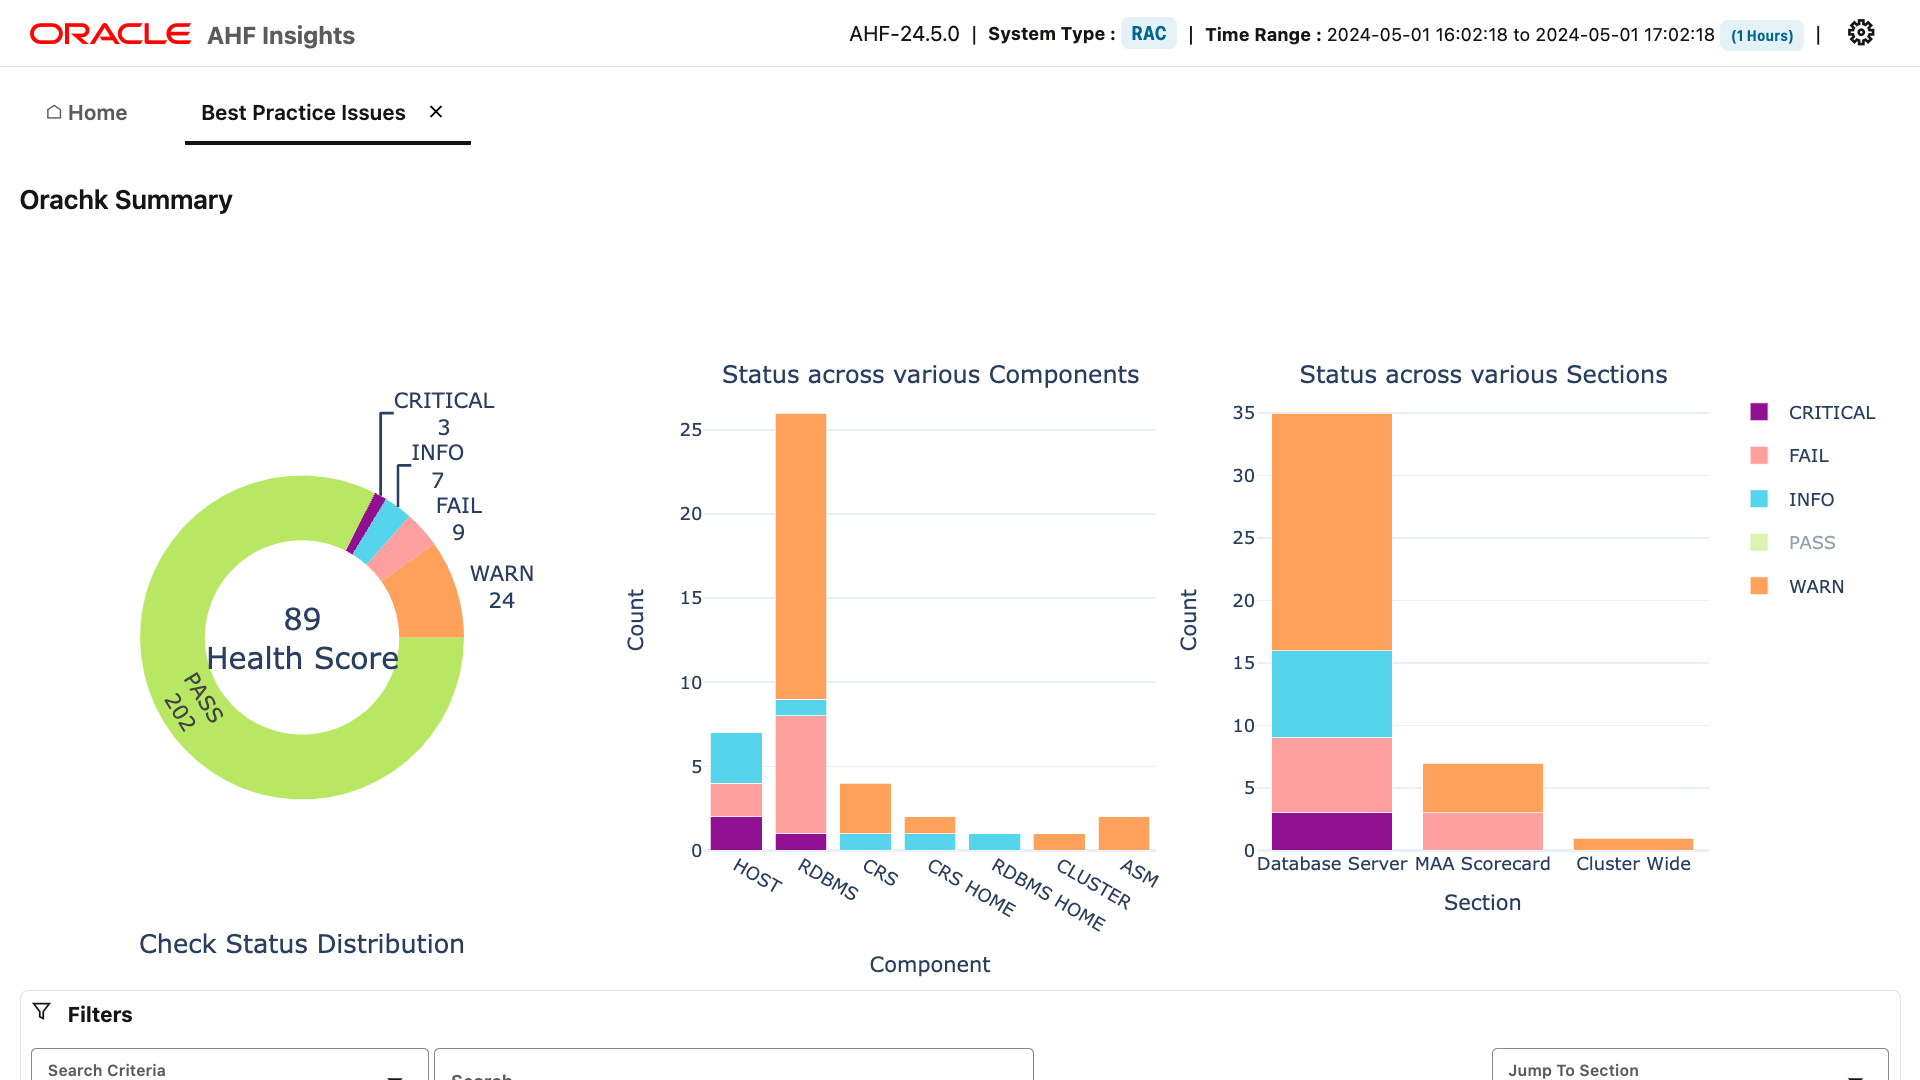
下にスクロールすると、特定のコンフィギュレーションに関する問題が表示されます。
問題のリストに目を通し、関連しそうなものがないか確認してください。
パフォーマンスに関連しそうなものが見つかったら、それを展開して推奨事項を確認してください。
すべてのベストプラクティス・チェックでは、修復ステップとともに、この構成ドリフトの影響とリスクを説明しています。
b.データベースの異常とリソースのボトルネックの発見と修正
次にDatabase Anomalies Advisor.を見ていきましょう。
Autonomous Health Frameworkは、AIを使って異常なイベントを検出し、解決策を提案します。
Slow IO Example Scenario
このシナリオでは、Autonomous Health Frameworkは、データベースとホストのIOが遅いことを示唆する多くの異常なイベントを検出しました。
ここからホーム画面に戻り、オペレーティング・システムのメトリックをみることができます
この例では、Autonomous Health Frameworkが、オラクル・プロセスがDステートでブロックされていることを検出しています。また、いくつかのディスクに長い待機時間があることもわかります。
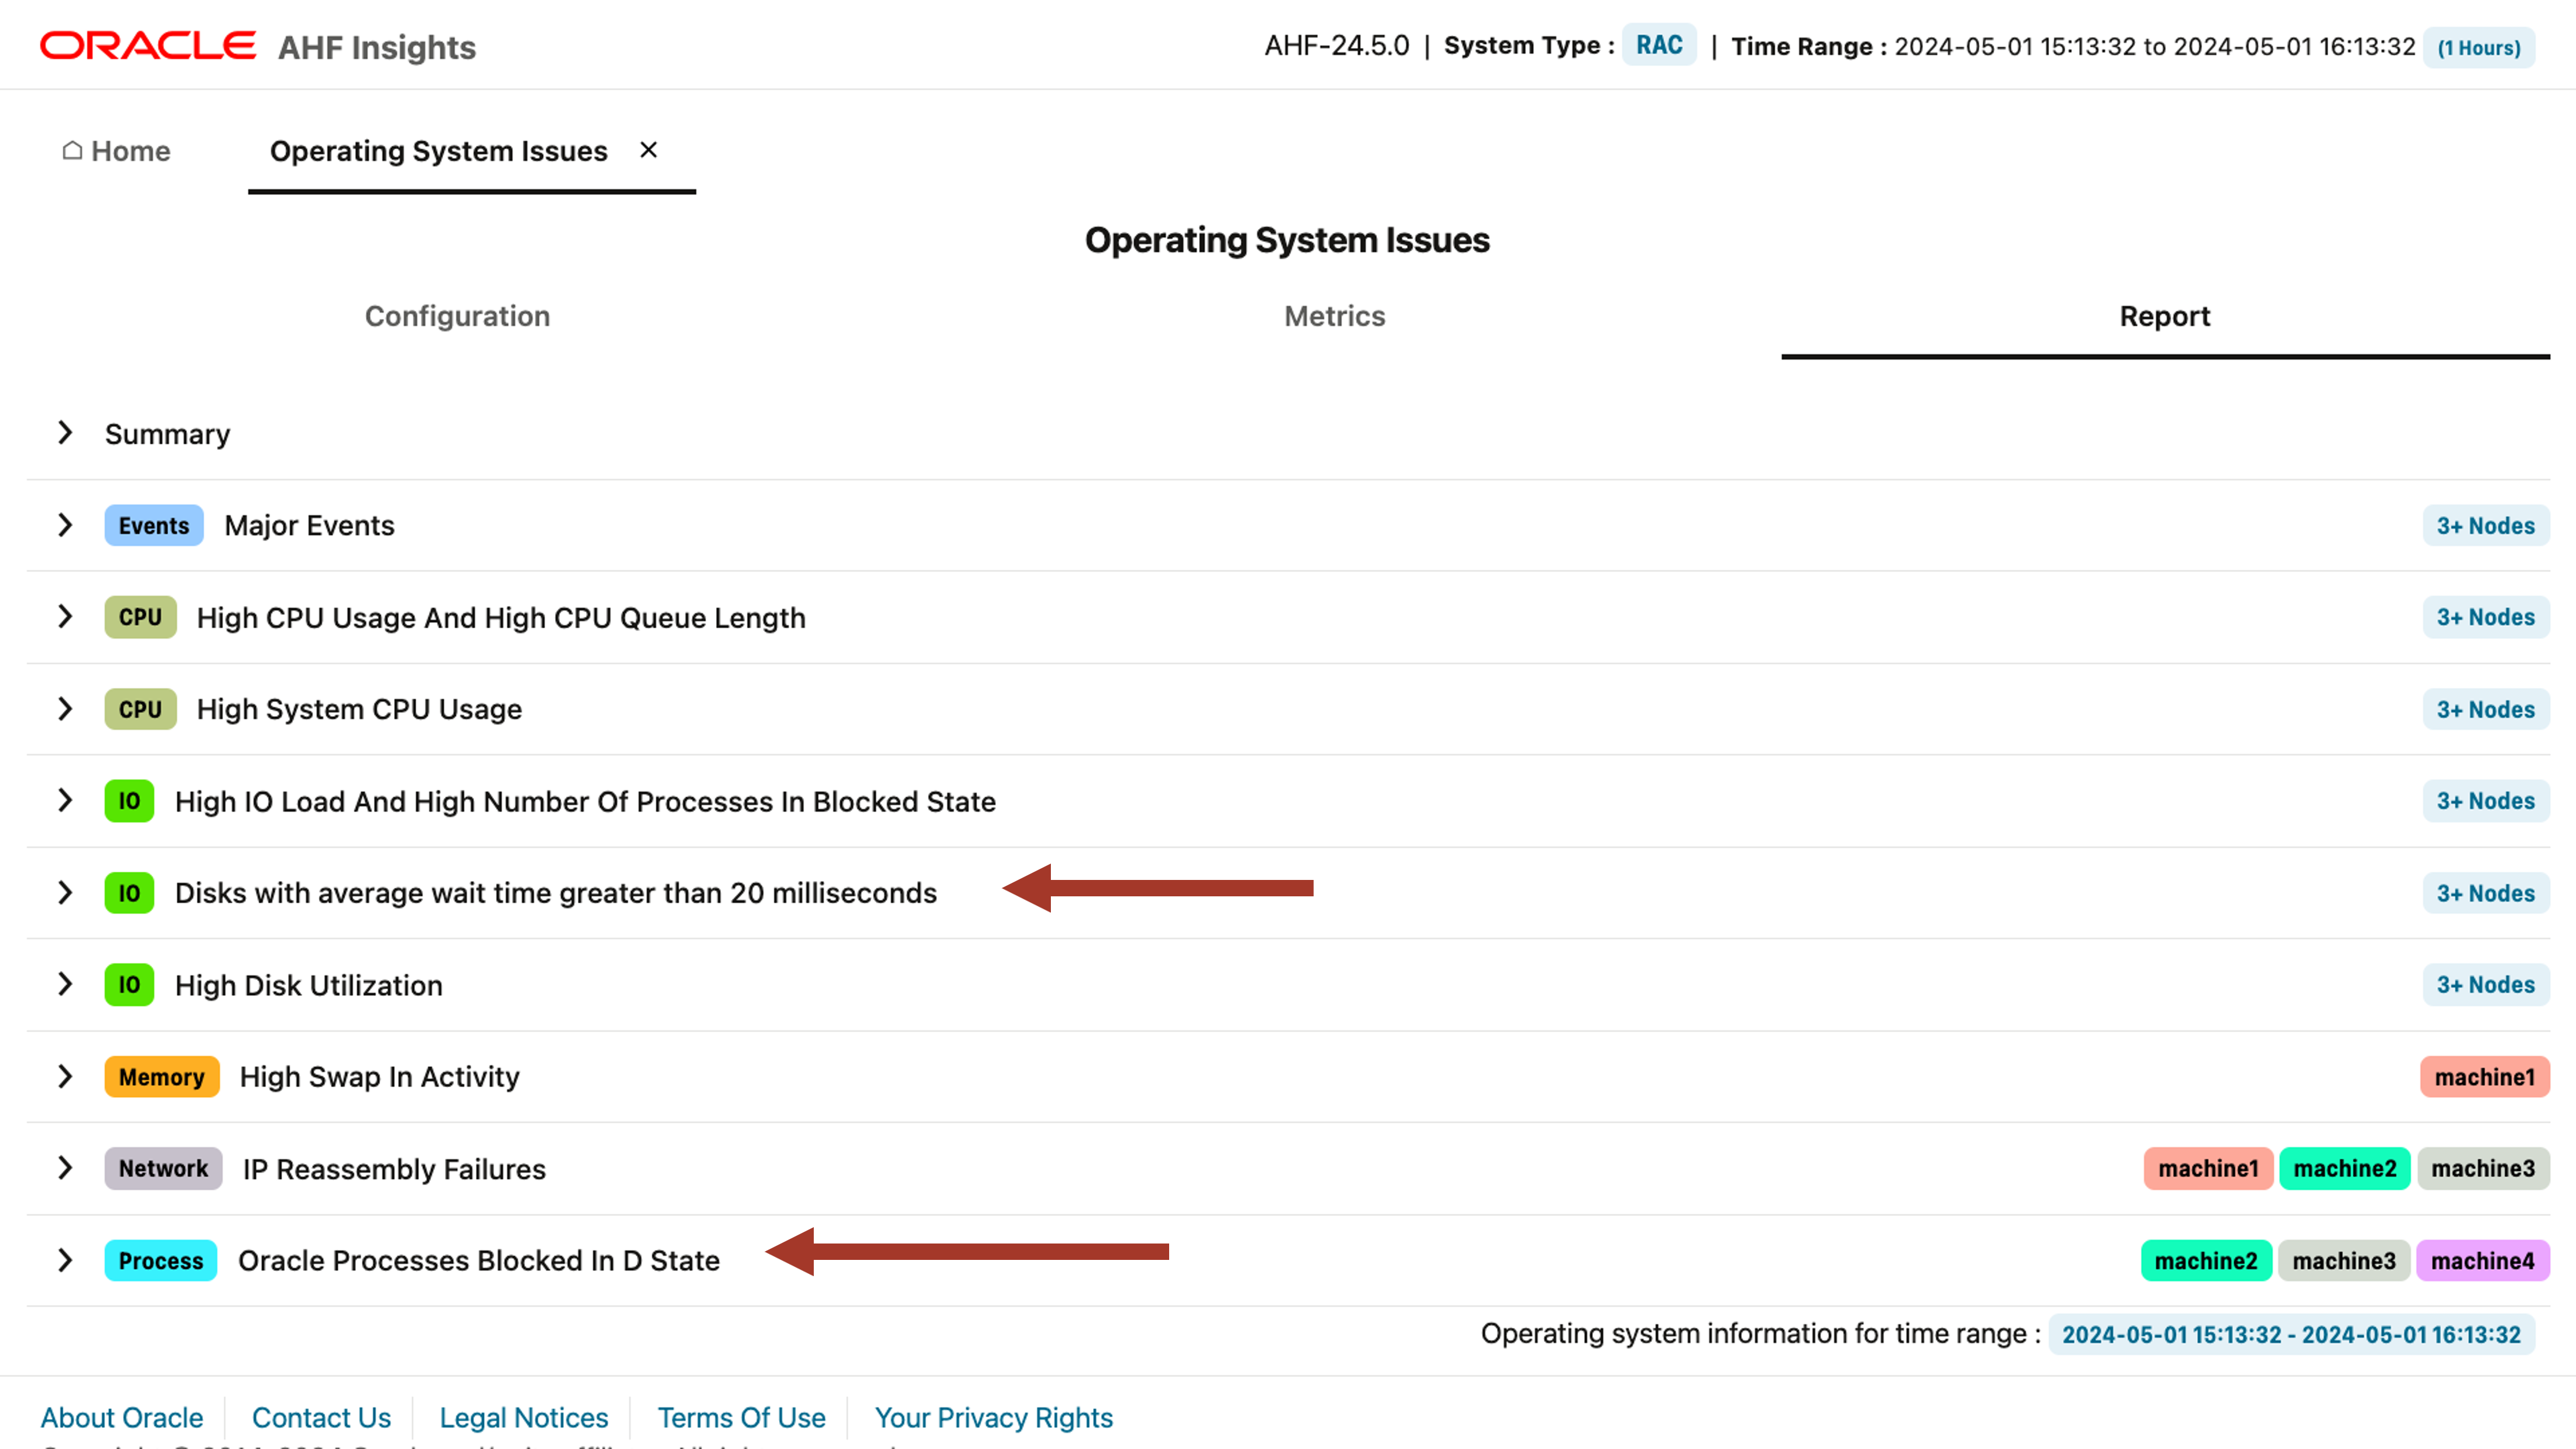
これを拡大すると、平均待ち時間が20ミリ秒を超えるディスクと、IO消費量の上位プロセスを示すグラフがみれます。
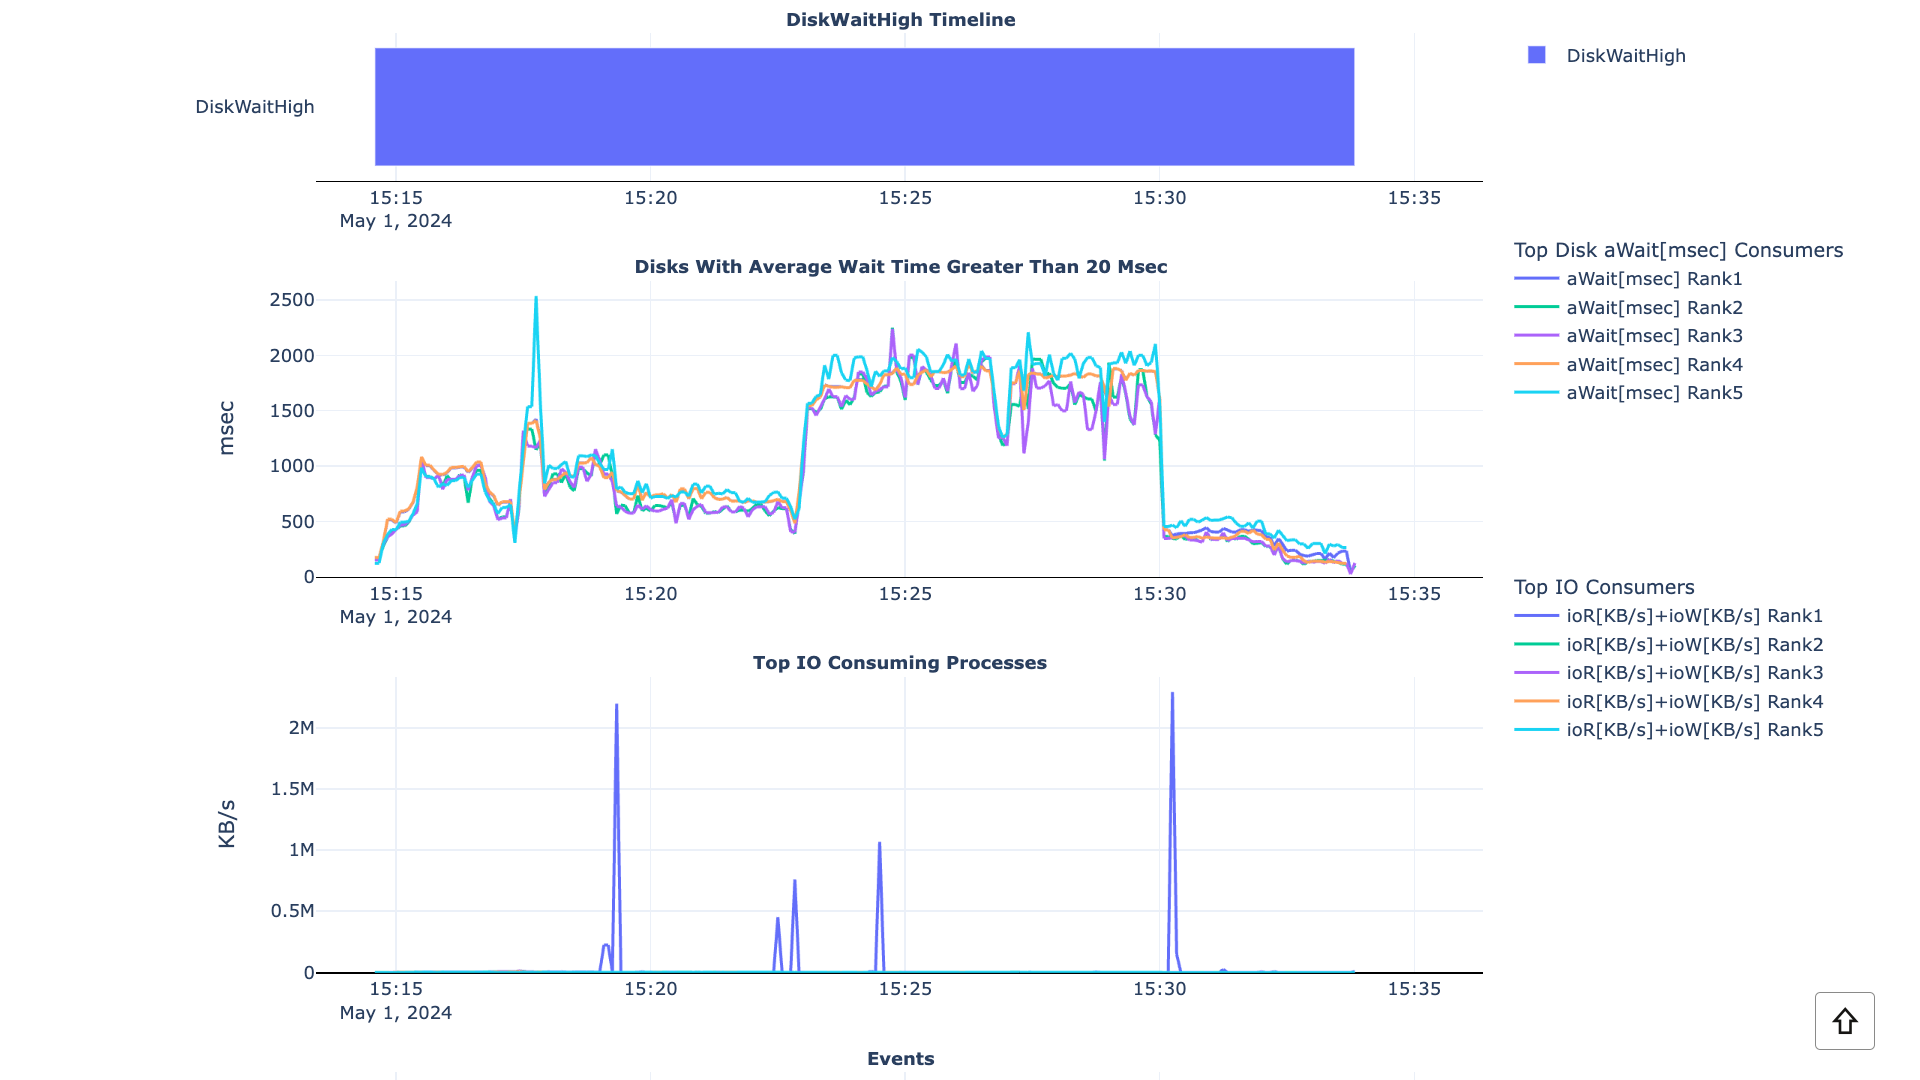
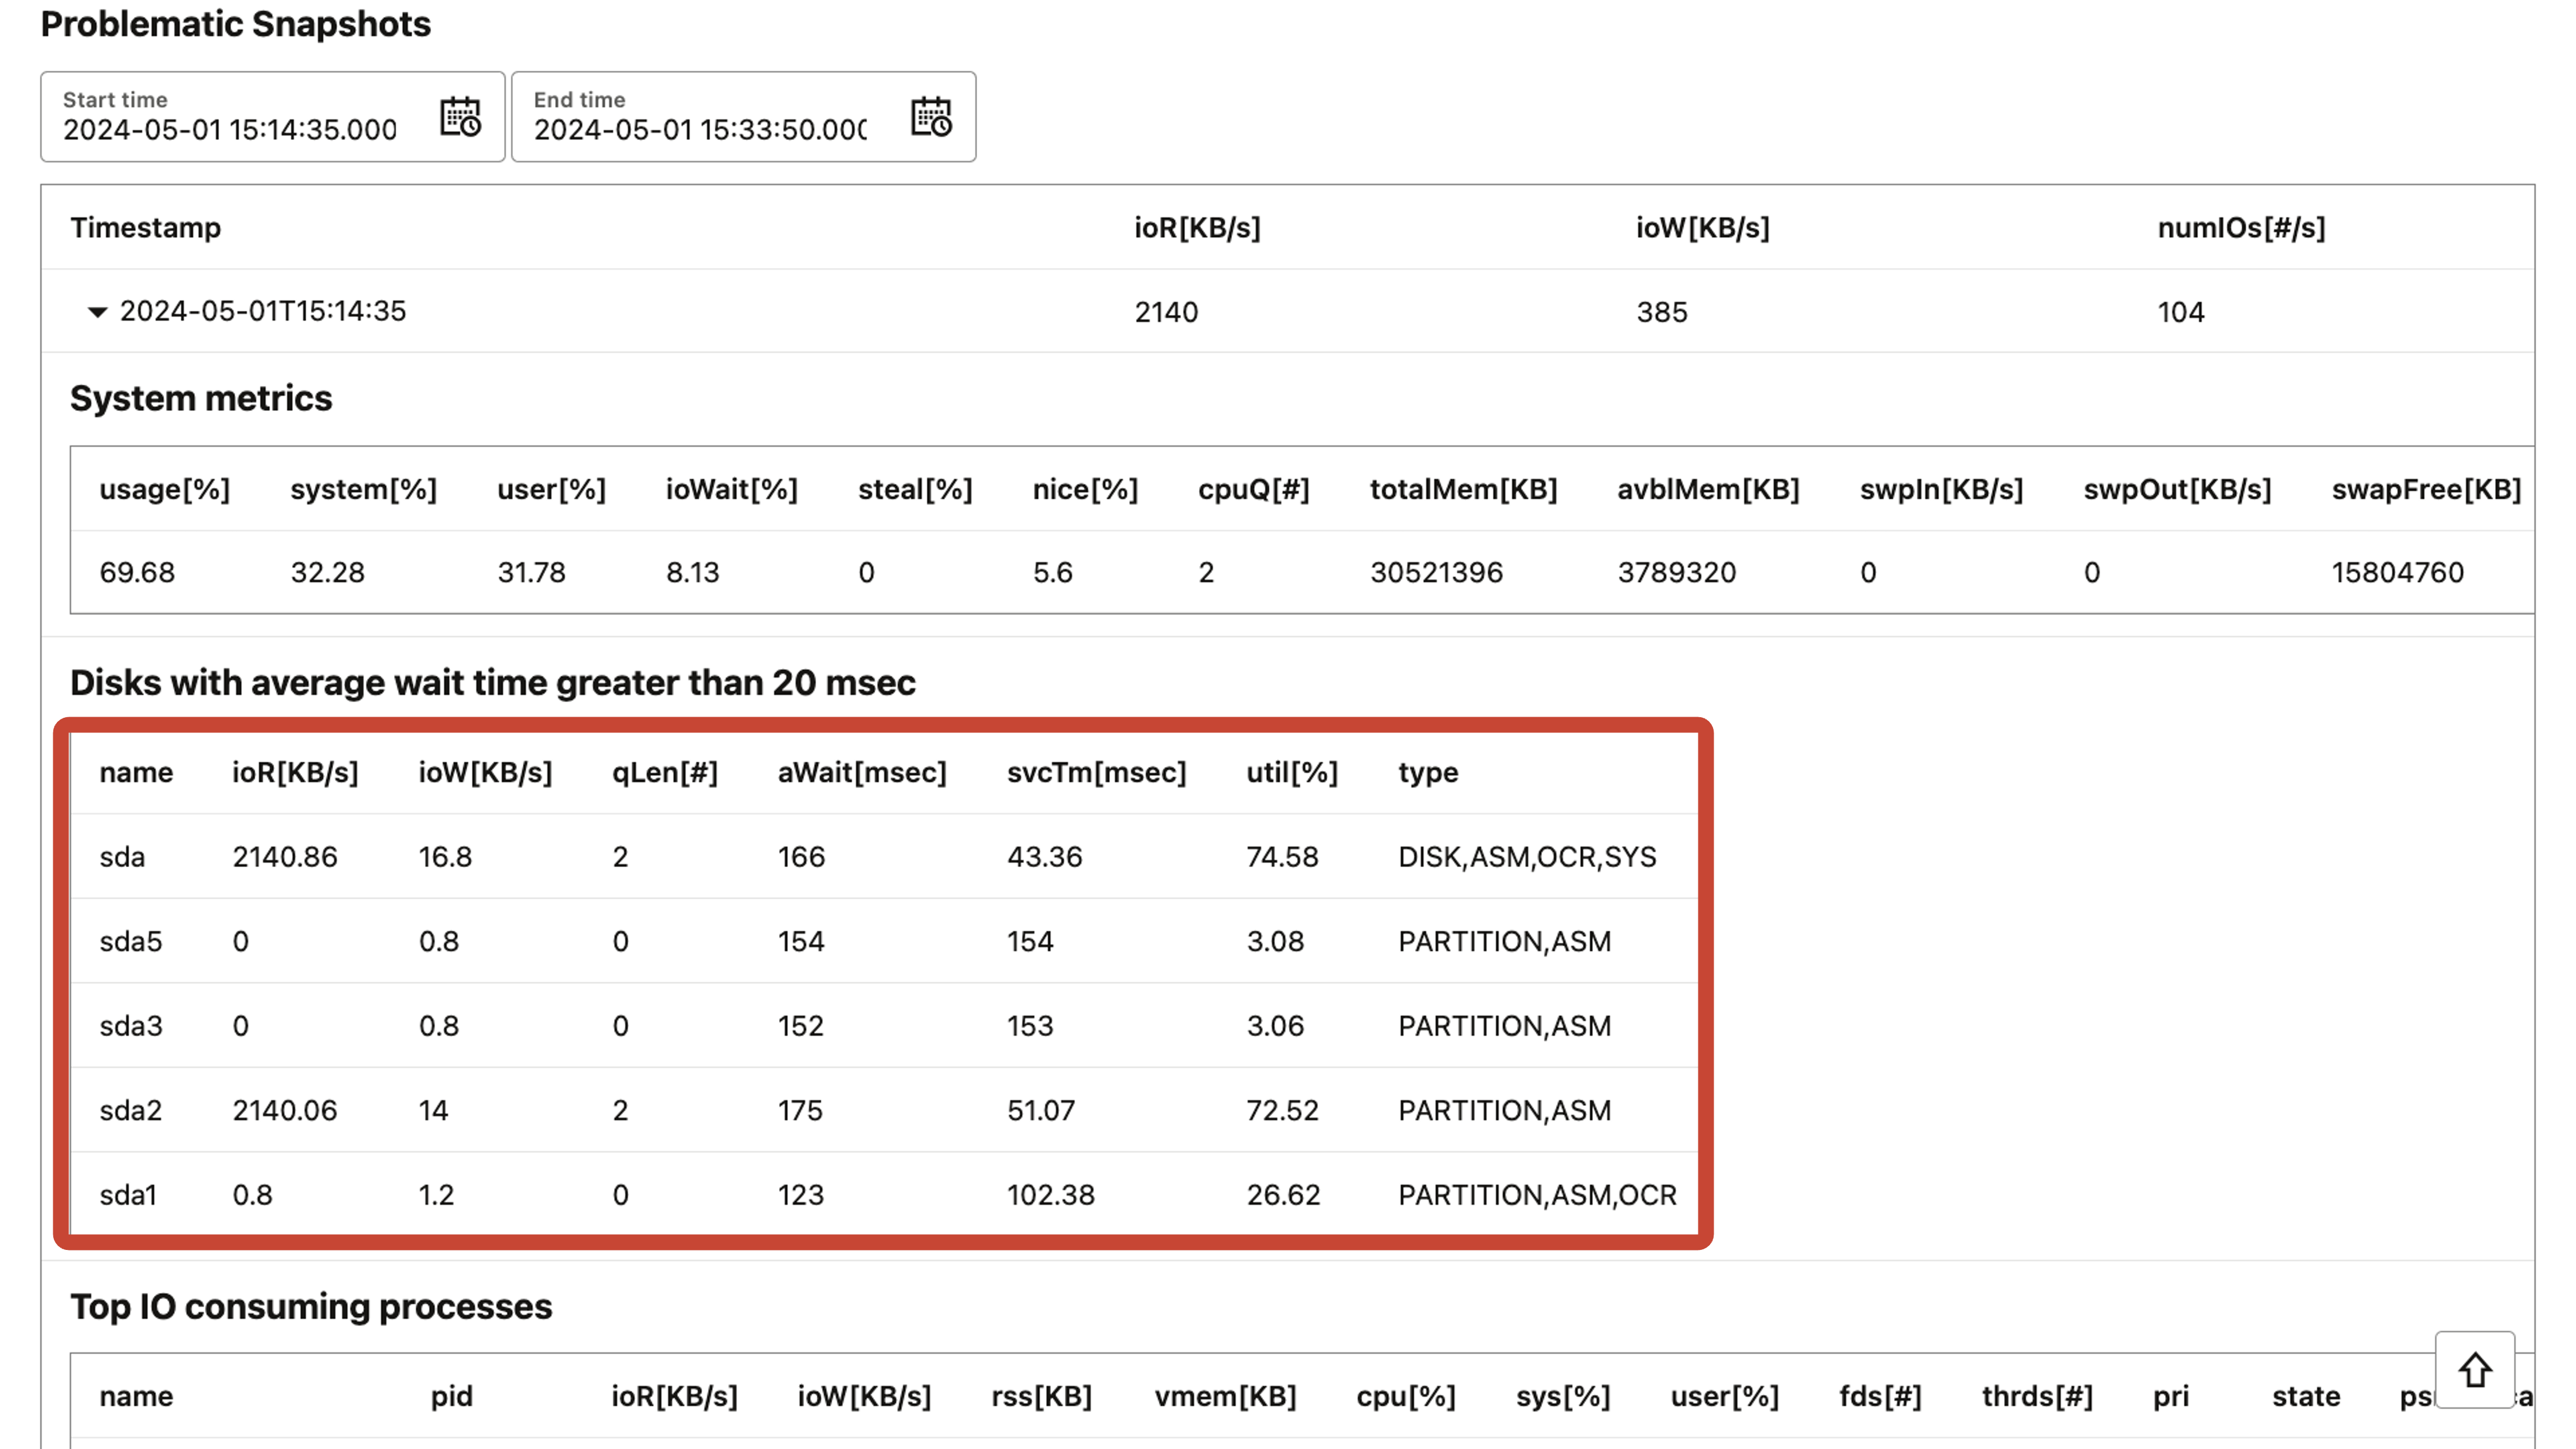
さらに下にスクロールすると、問題のあるスナップショットを見ることができます。
この例はどのディスクが遅いかを示しています。
CPU使用率の高いシナリオ例
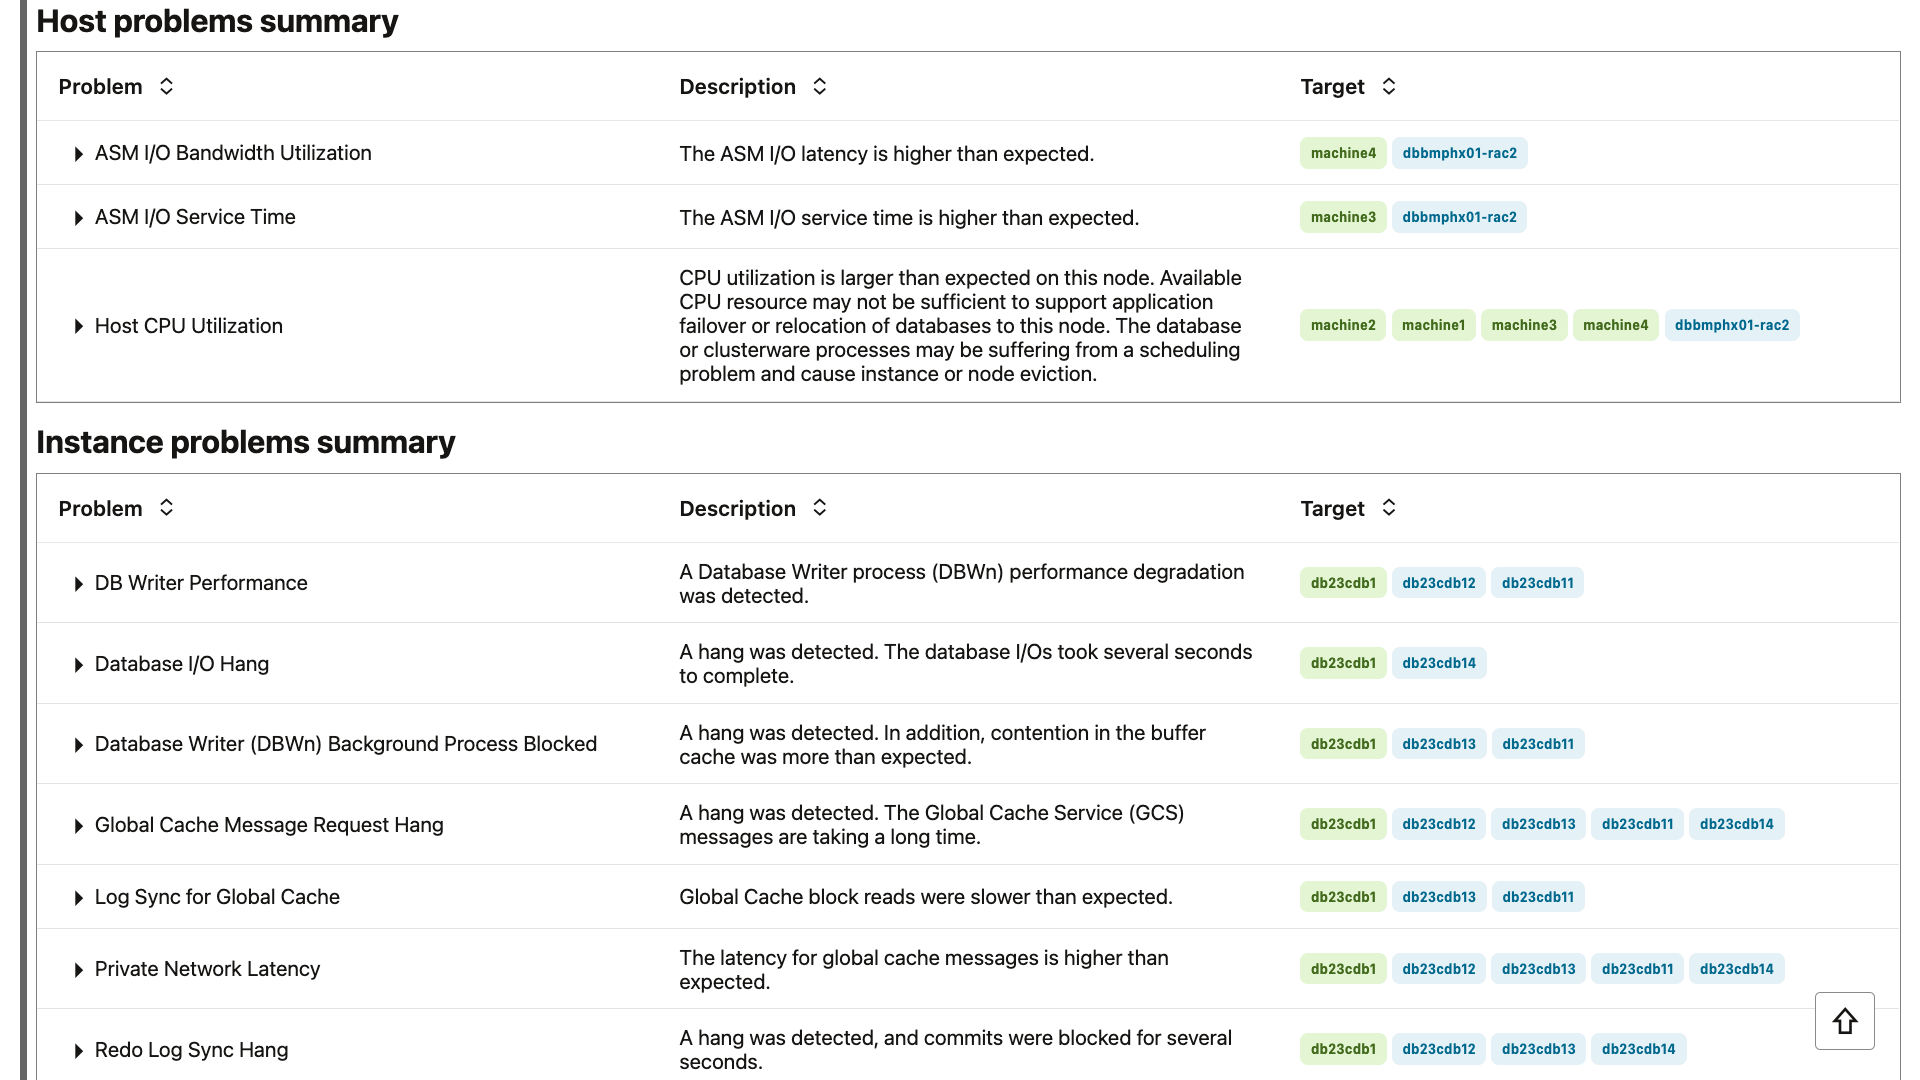
ここでは、Autonomous Health Frameworkによって検出された異常を別のシナリオで見てみましょう。このケースでは、Databaseグローバル・キャッシュ・メッセージのレイテンシが予想よりも高いことがわかります。Autonomous Health Frameworkは、原因と推奨されるアクションを教えてくれます。
これでCPUがボトルネックになっていることがわかりました。
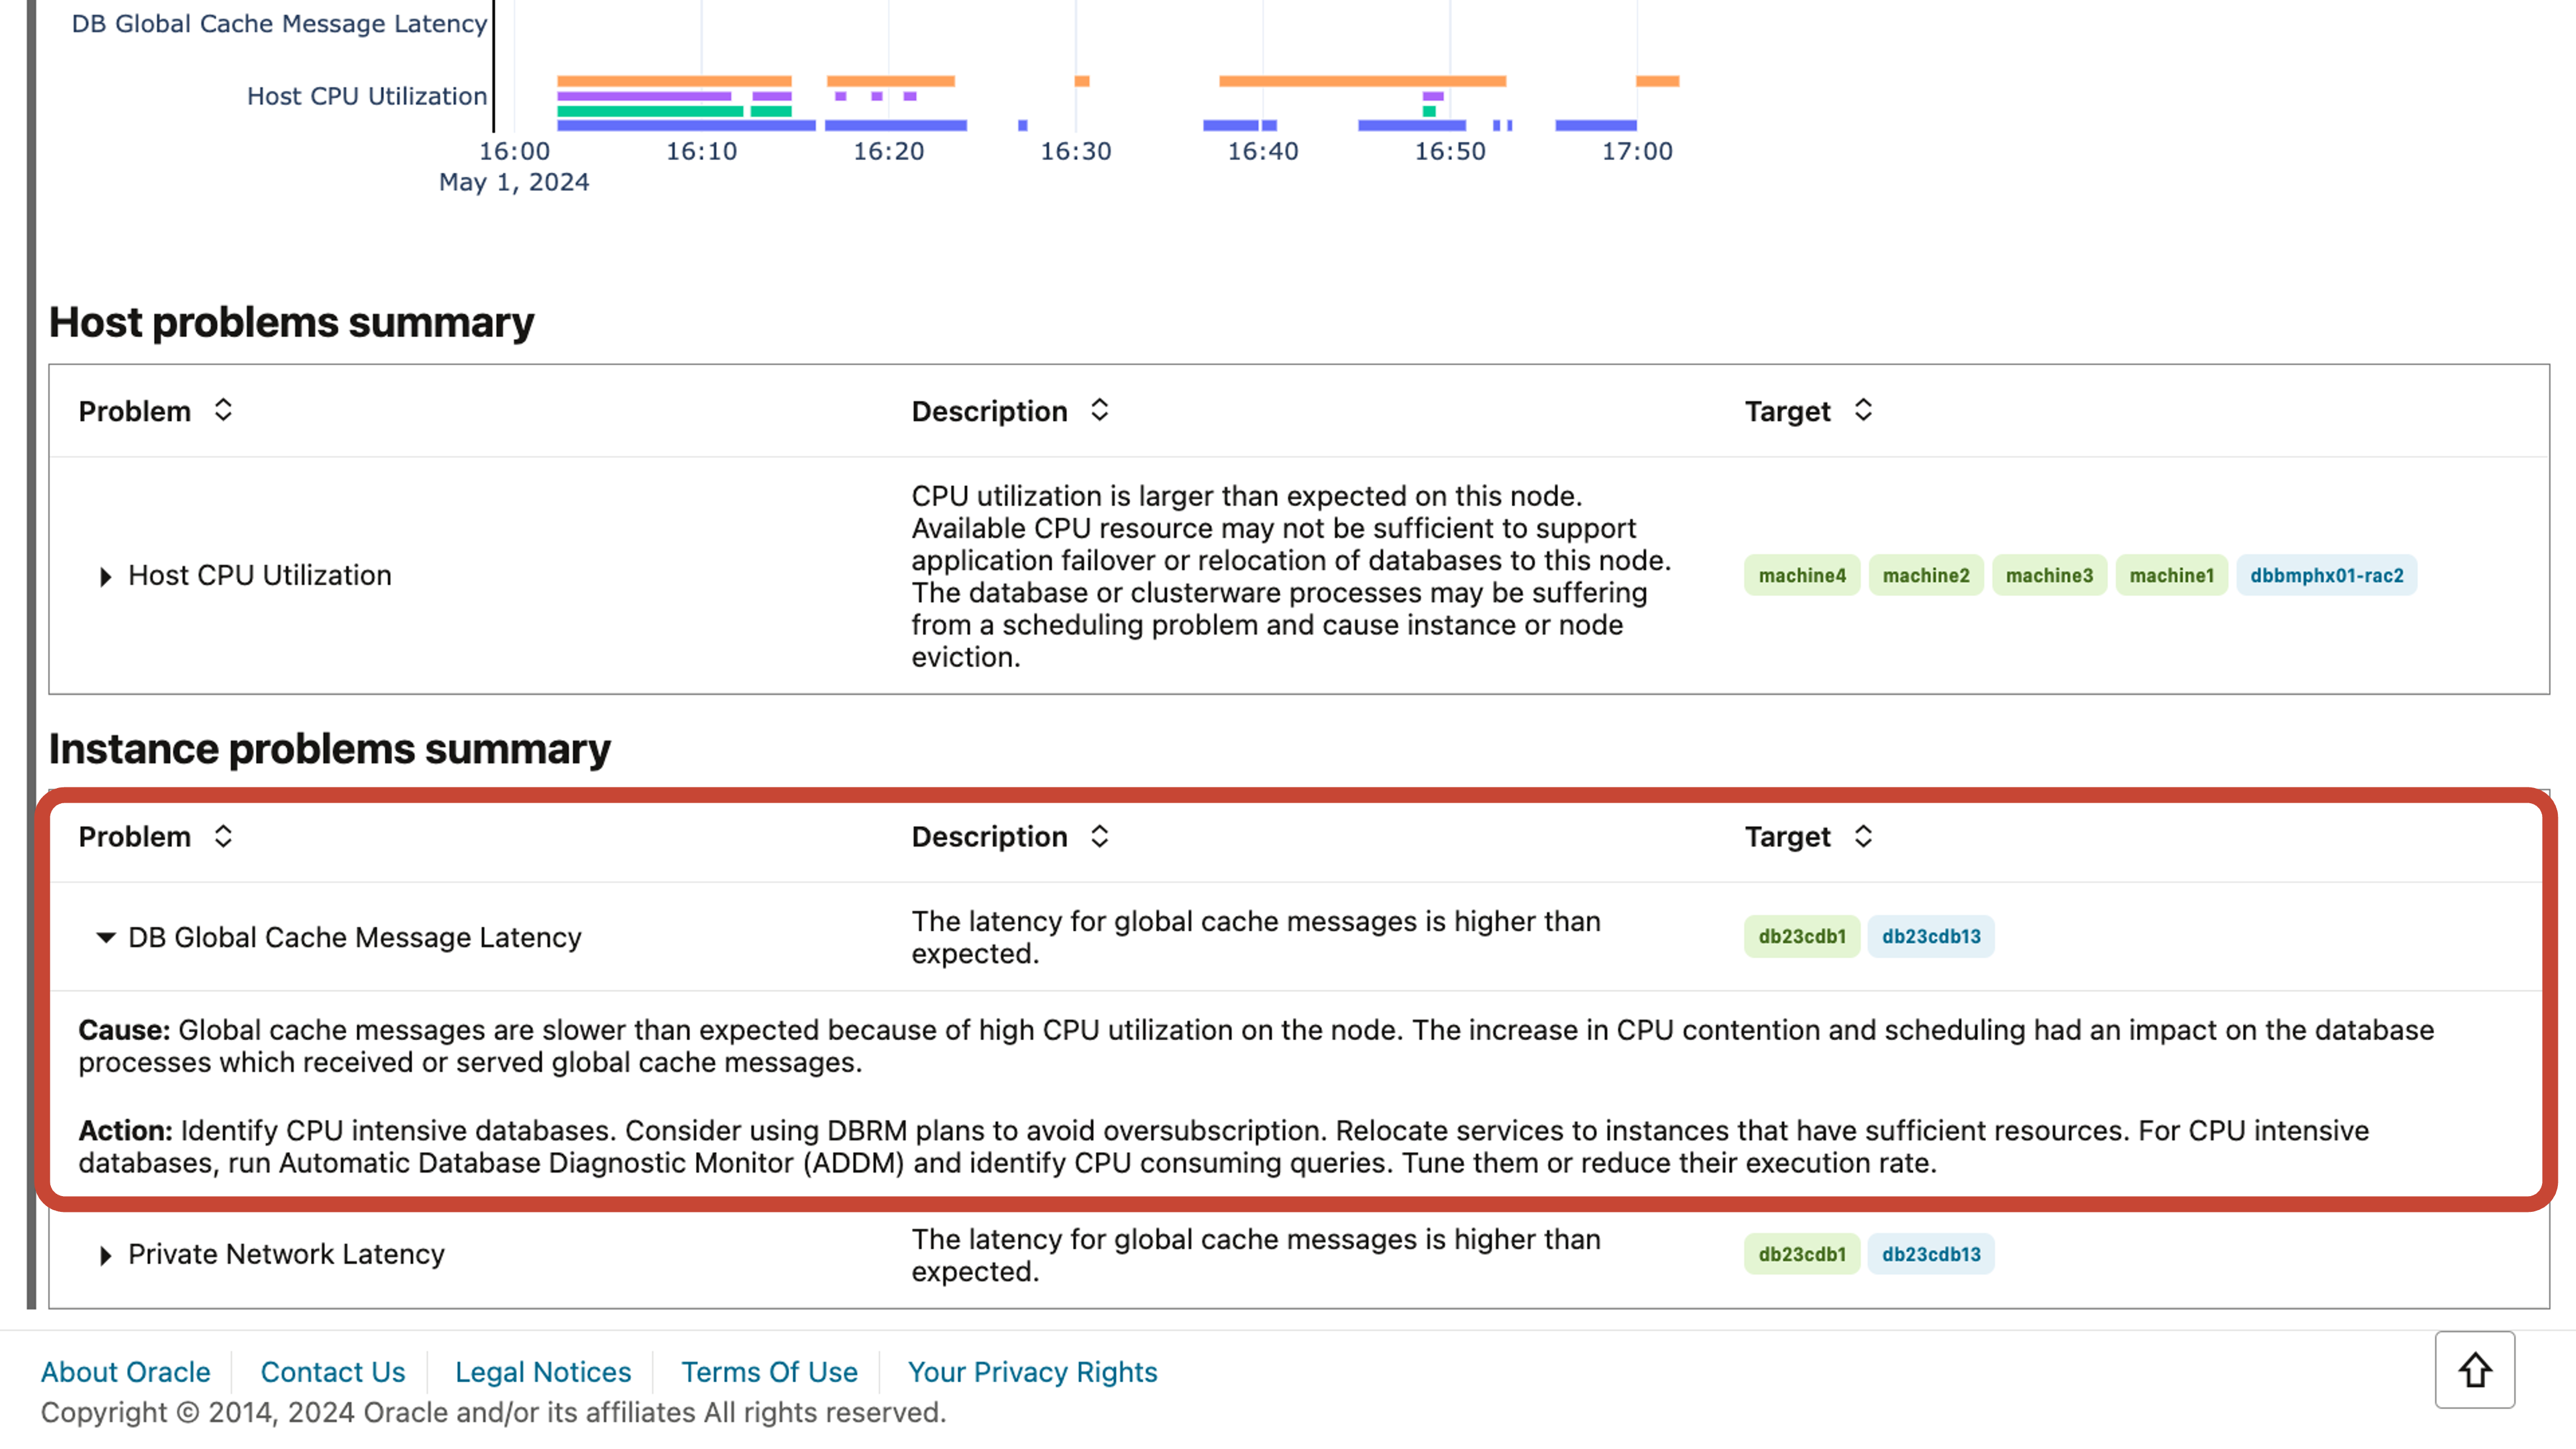
このシナリオでOSの問題レポートページを開くと、CPU使用率が高いというファインディングが表示されます。
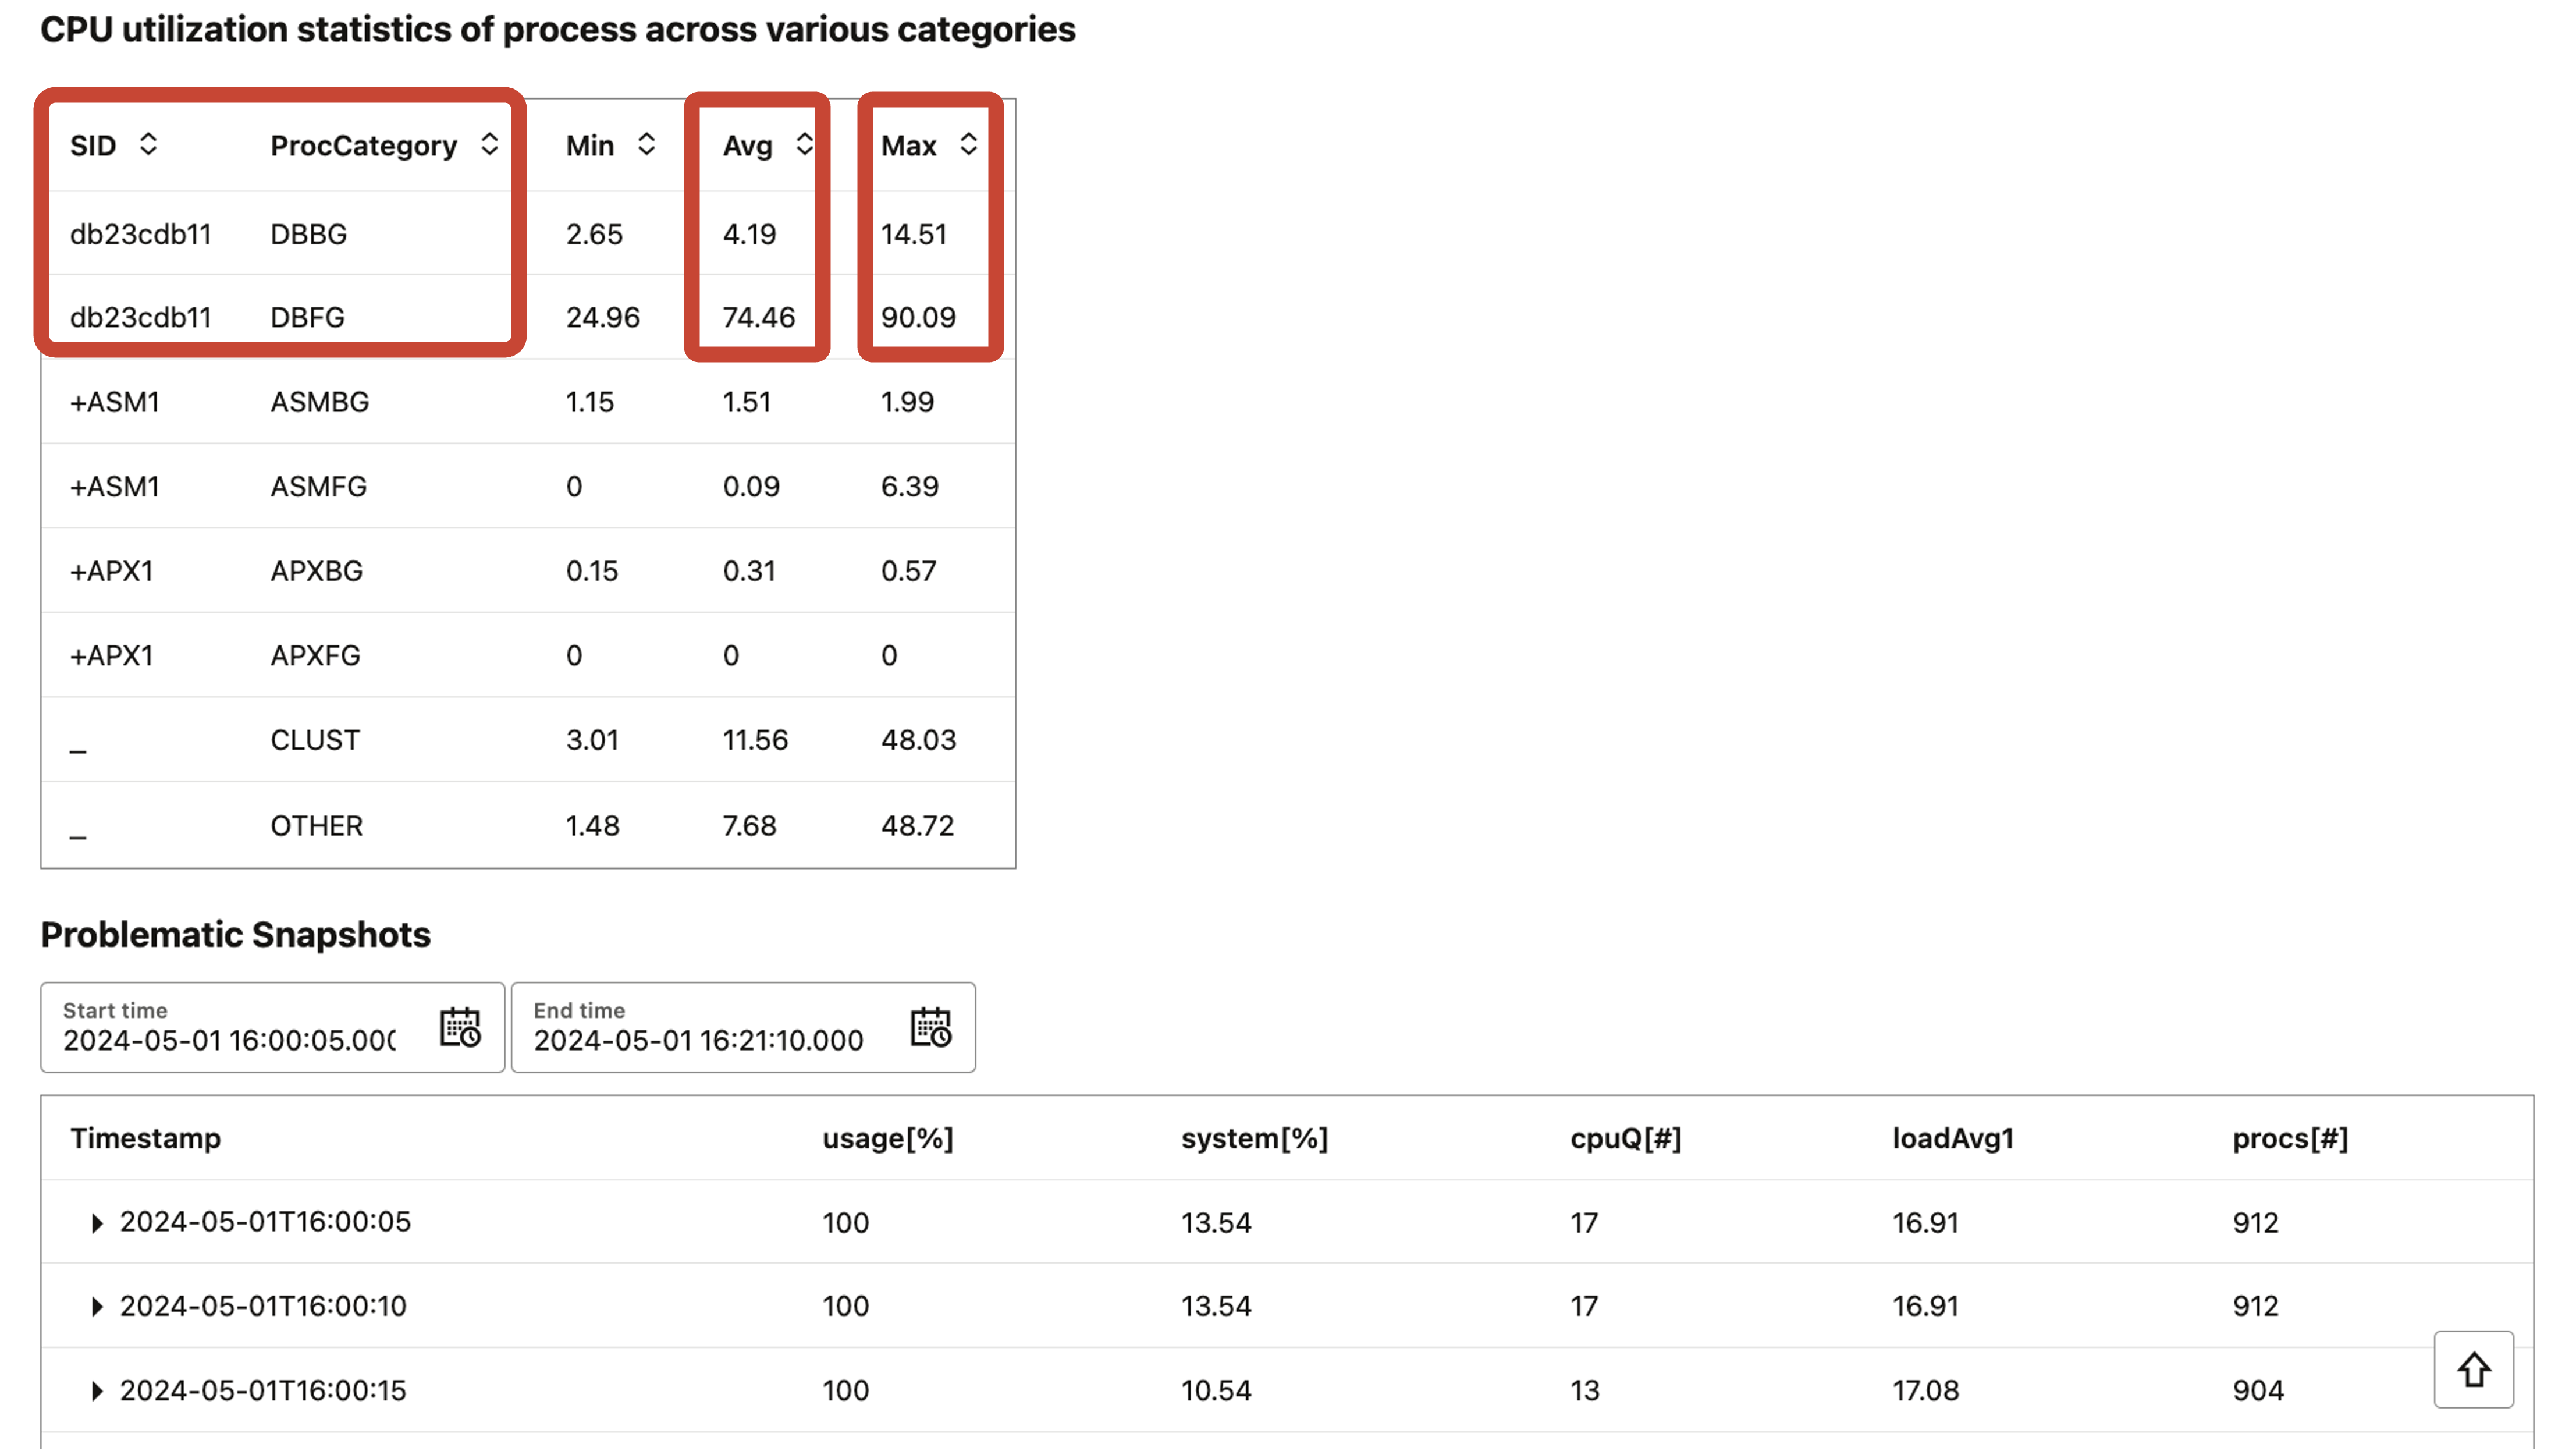
そのファインディングを拡大すると、CPU使用率がいつ高かったかの詳細が表示されます。下にスクロールすると、CPU使用率が時系列でグラフ化されています。
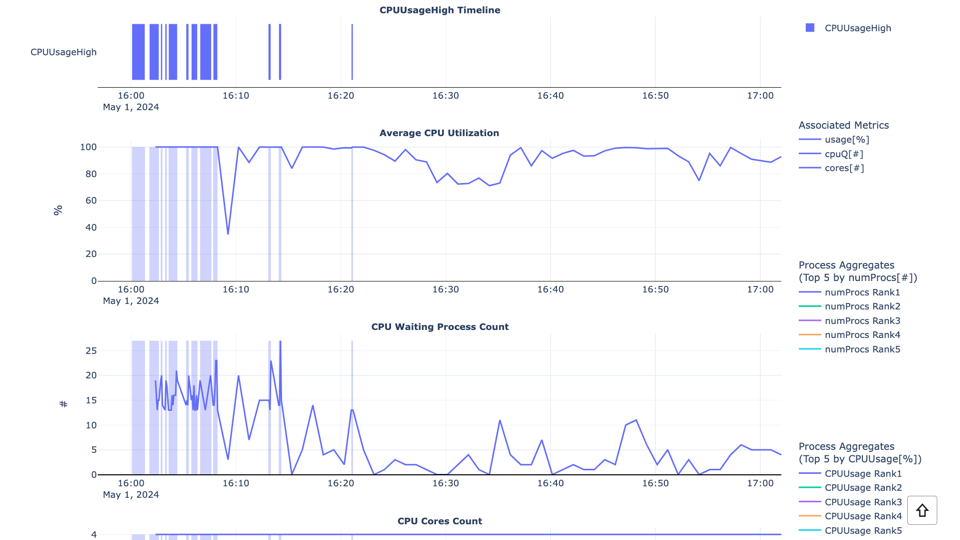
さらに下に進むと、さまざまなプロセスのCPU使用率が表示されます。
データベースのバックグラウンド・プロセスとフォアグラウンド・プロセスが、平均80%以上、最大100%以上のCPUを消費していることがわかります。
3. Autonomous Health Frameworkを使用して、ノイジー・ネイバーを理解して影響を防ぐ
この3番目のステップは、他の複数のデータベースがあるホストでデータベースのパフォーマンス問題が繰り返し発生し、ホストのCPU使用率が70%を超える期間がある場合にのみ適用できます。
このステップでは、ノイジー・ネイバー(noisy neighbors)をチェックします。
一般的な用語では、ノイジー・ネイバーとは、あるサービスがシステム・リソースを予想以上に消費し、他のサービスのパフォーマンスに影響を与えることを指します。
Autonomous Health Frameworkは、CPU使用率に基づいてノイジーな他のデータベースを検出することができます。
Autonomous Health Frameworkは、履歴データのソースとしてOracle Enterprise Managerリポジトリを使用します。そのため、実行時にこのリポジトリに接続するように構成します:
ahf configuration set --type impact --user-name <EM user> --connect-string <EM repository connection string>
リポジトリのパスワードの入力を求められ、Autonomous Health Frameworkが設定を行います。
例:
ahf configuration set --type impact --user-name ahftest --connect-string "//mymachine.acme.com:1521/abcd.acme.com"

Enter EM Repository password:

Re-enter EM Repository password:

Configuration files created in /opt/oracle.ahf/data/mymachine/balance/user_john
これで設定が完了したので、クラスター分析レポートを作成します:
ahf analysis create --type impact --scope cluster --name cluster_name
例:
ahf analysis create --type impact --scope cluster --name mycluster

Starting analysis and collecting data for impact

Report is generated at : /opt/oracle.ahf/data/mymachine/diag/balance/user_john/cluster_160424_154432451_UTC.html
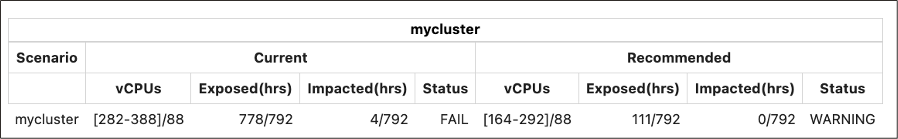
レポートの最初のセクションでは、現在のノイジーネイバーへの露出と影響について、推奨されるCPU_COUNTを設定した場合と比較した場合のサマリーが表示されます。
次のグラフは、過去1ヶ月間の現在のノイジー・ネイバーのステータスと、推奨CPU_COUNTを使用した場合のステータスを示しています。
黒い線は、データベースがノイジー・ネイバーによって影響を受けたことを示しています。
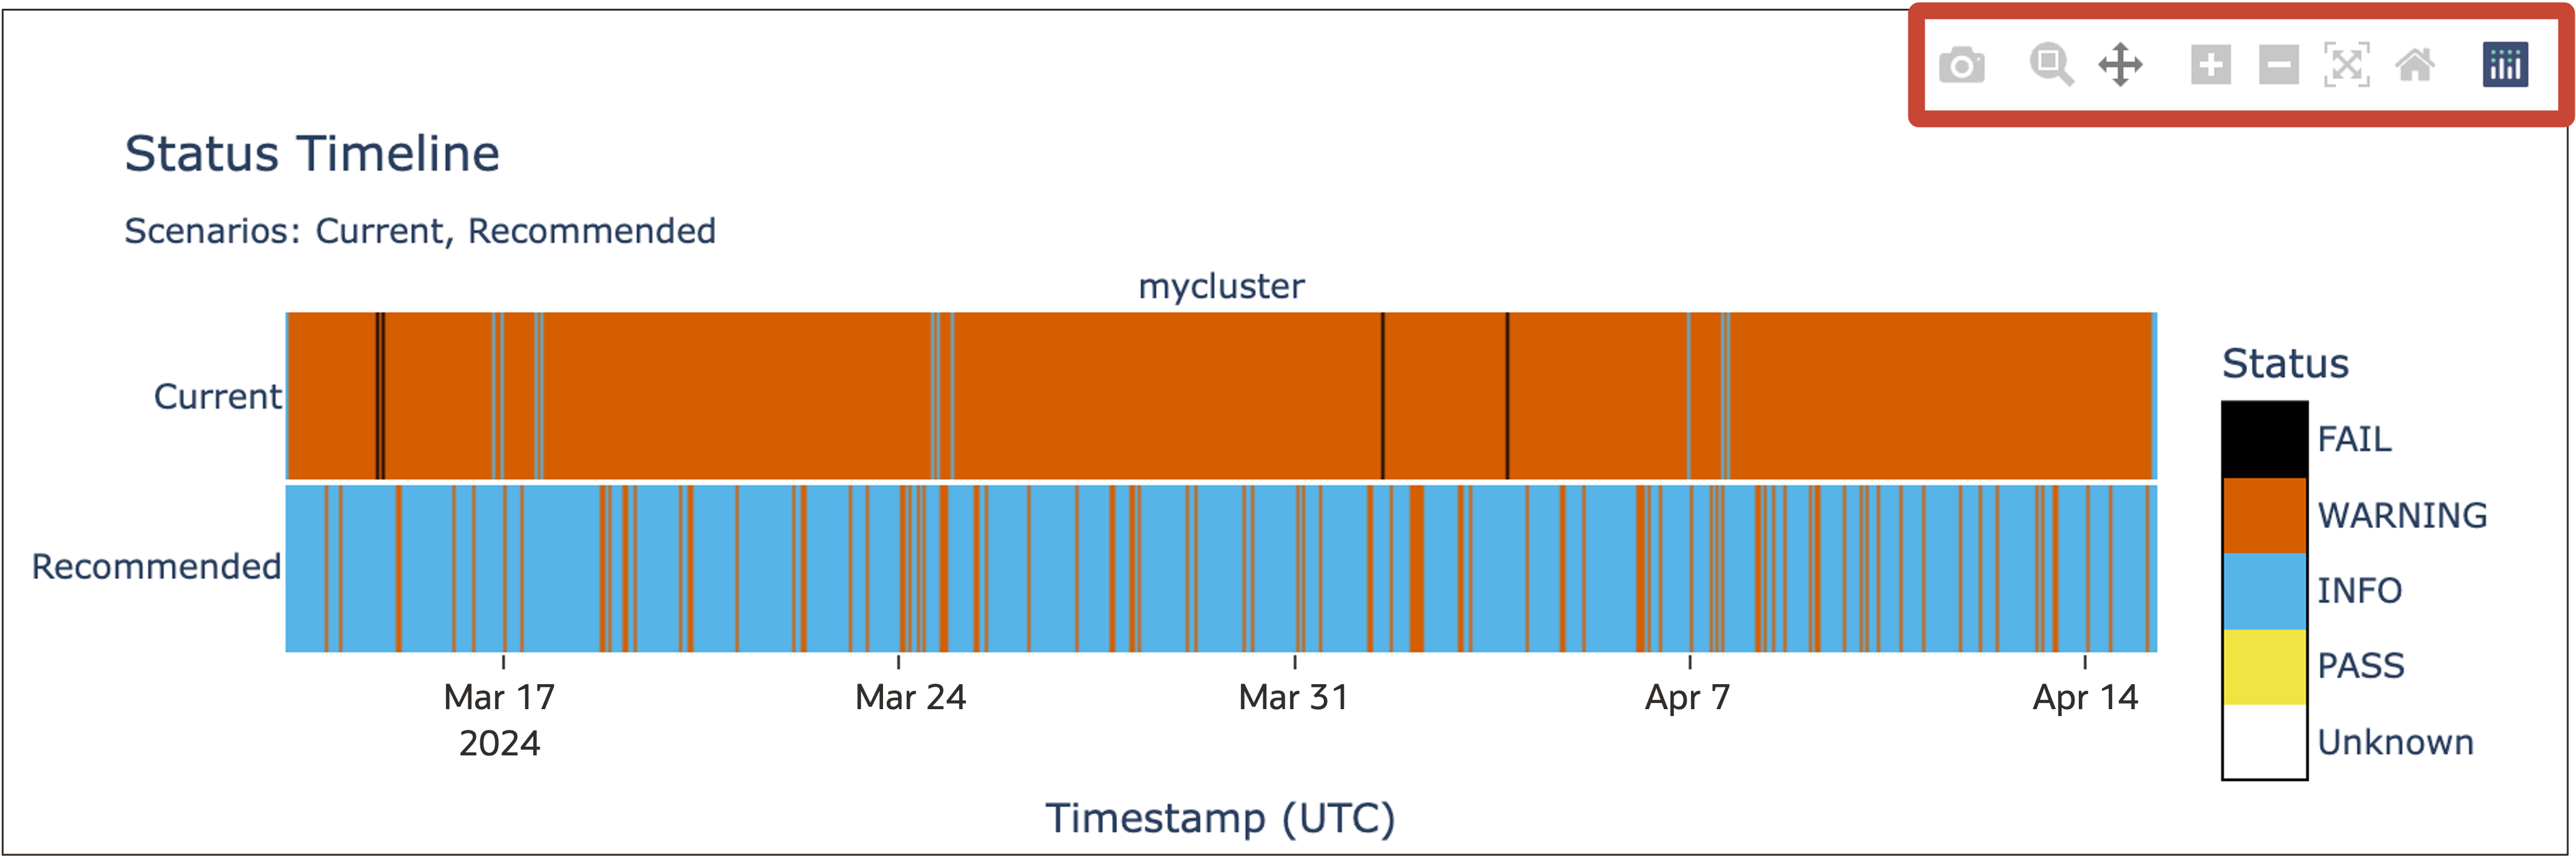
グラフの上にカーソルを置くと、これらのコントロールが表示され、データを拡大したり、パンしたりすることができます。これを使用して、黒い線がパフォーマンスの問題が発生した時期と相関しているかどうかを把握します。
黒い線がデータベースのパフォーマンスが低下した期間と相関している場合は、レポートの残りの部分を使用して、データベースまたはマシン別にさらに掘り下げて、さまざまなデータベース全体でCPU_COUNTに加えるべき変更を理解します。
4. Autonomous Health Framework 診断を使用して、パフォーマンスの低いデータベース・ワークロードを特定してチューニング
この4番目のステップでは、取得した診断をさらに使用して、パフォーマンスの悪いデータベース・ワークロードを特定し、チューニングします。
高い CPU 使用率の例で使用したのと同じコレクションを見ると、perfhub html ファイルが見つかります。
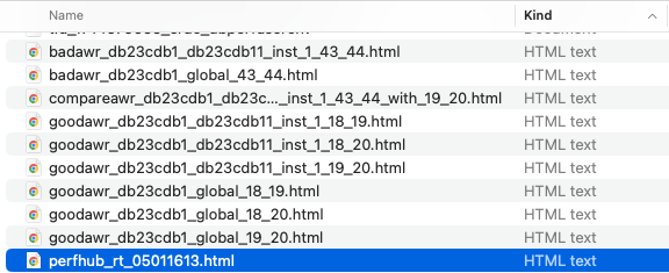
これを開くと、データベースのワークロードに関する詳細が記載された Database Performance Hub レポートが表示されます。
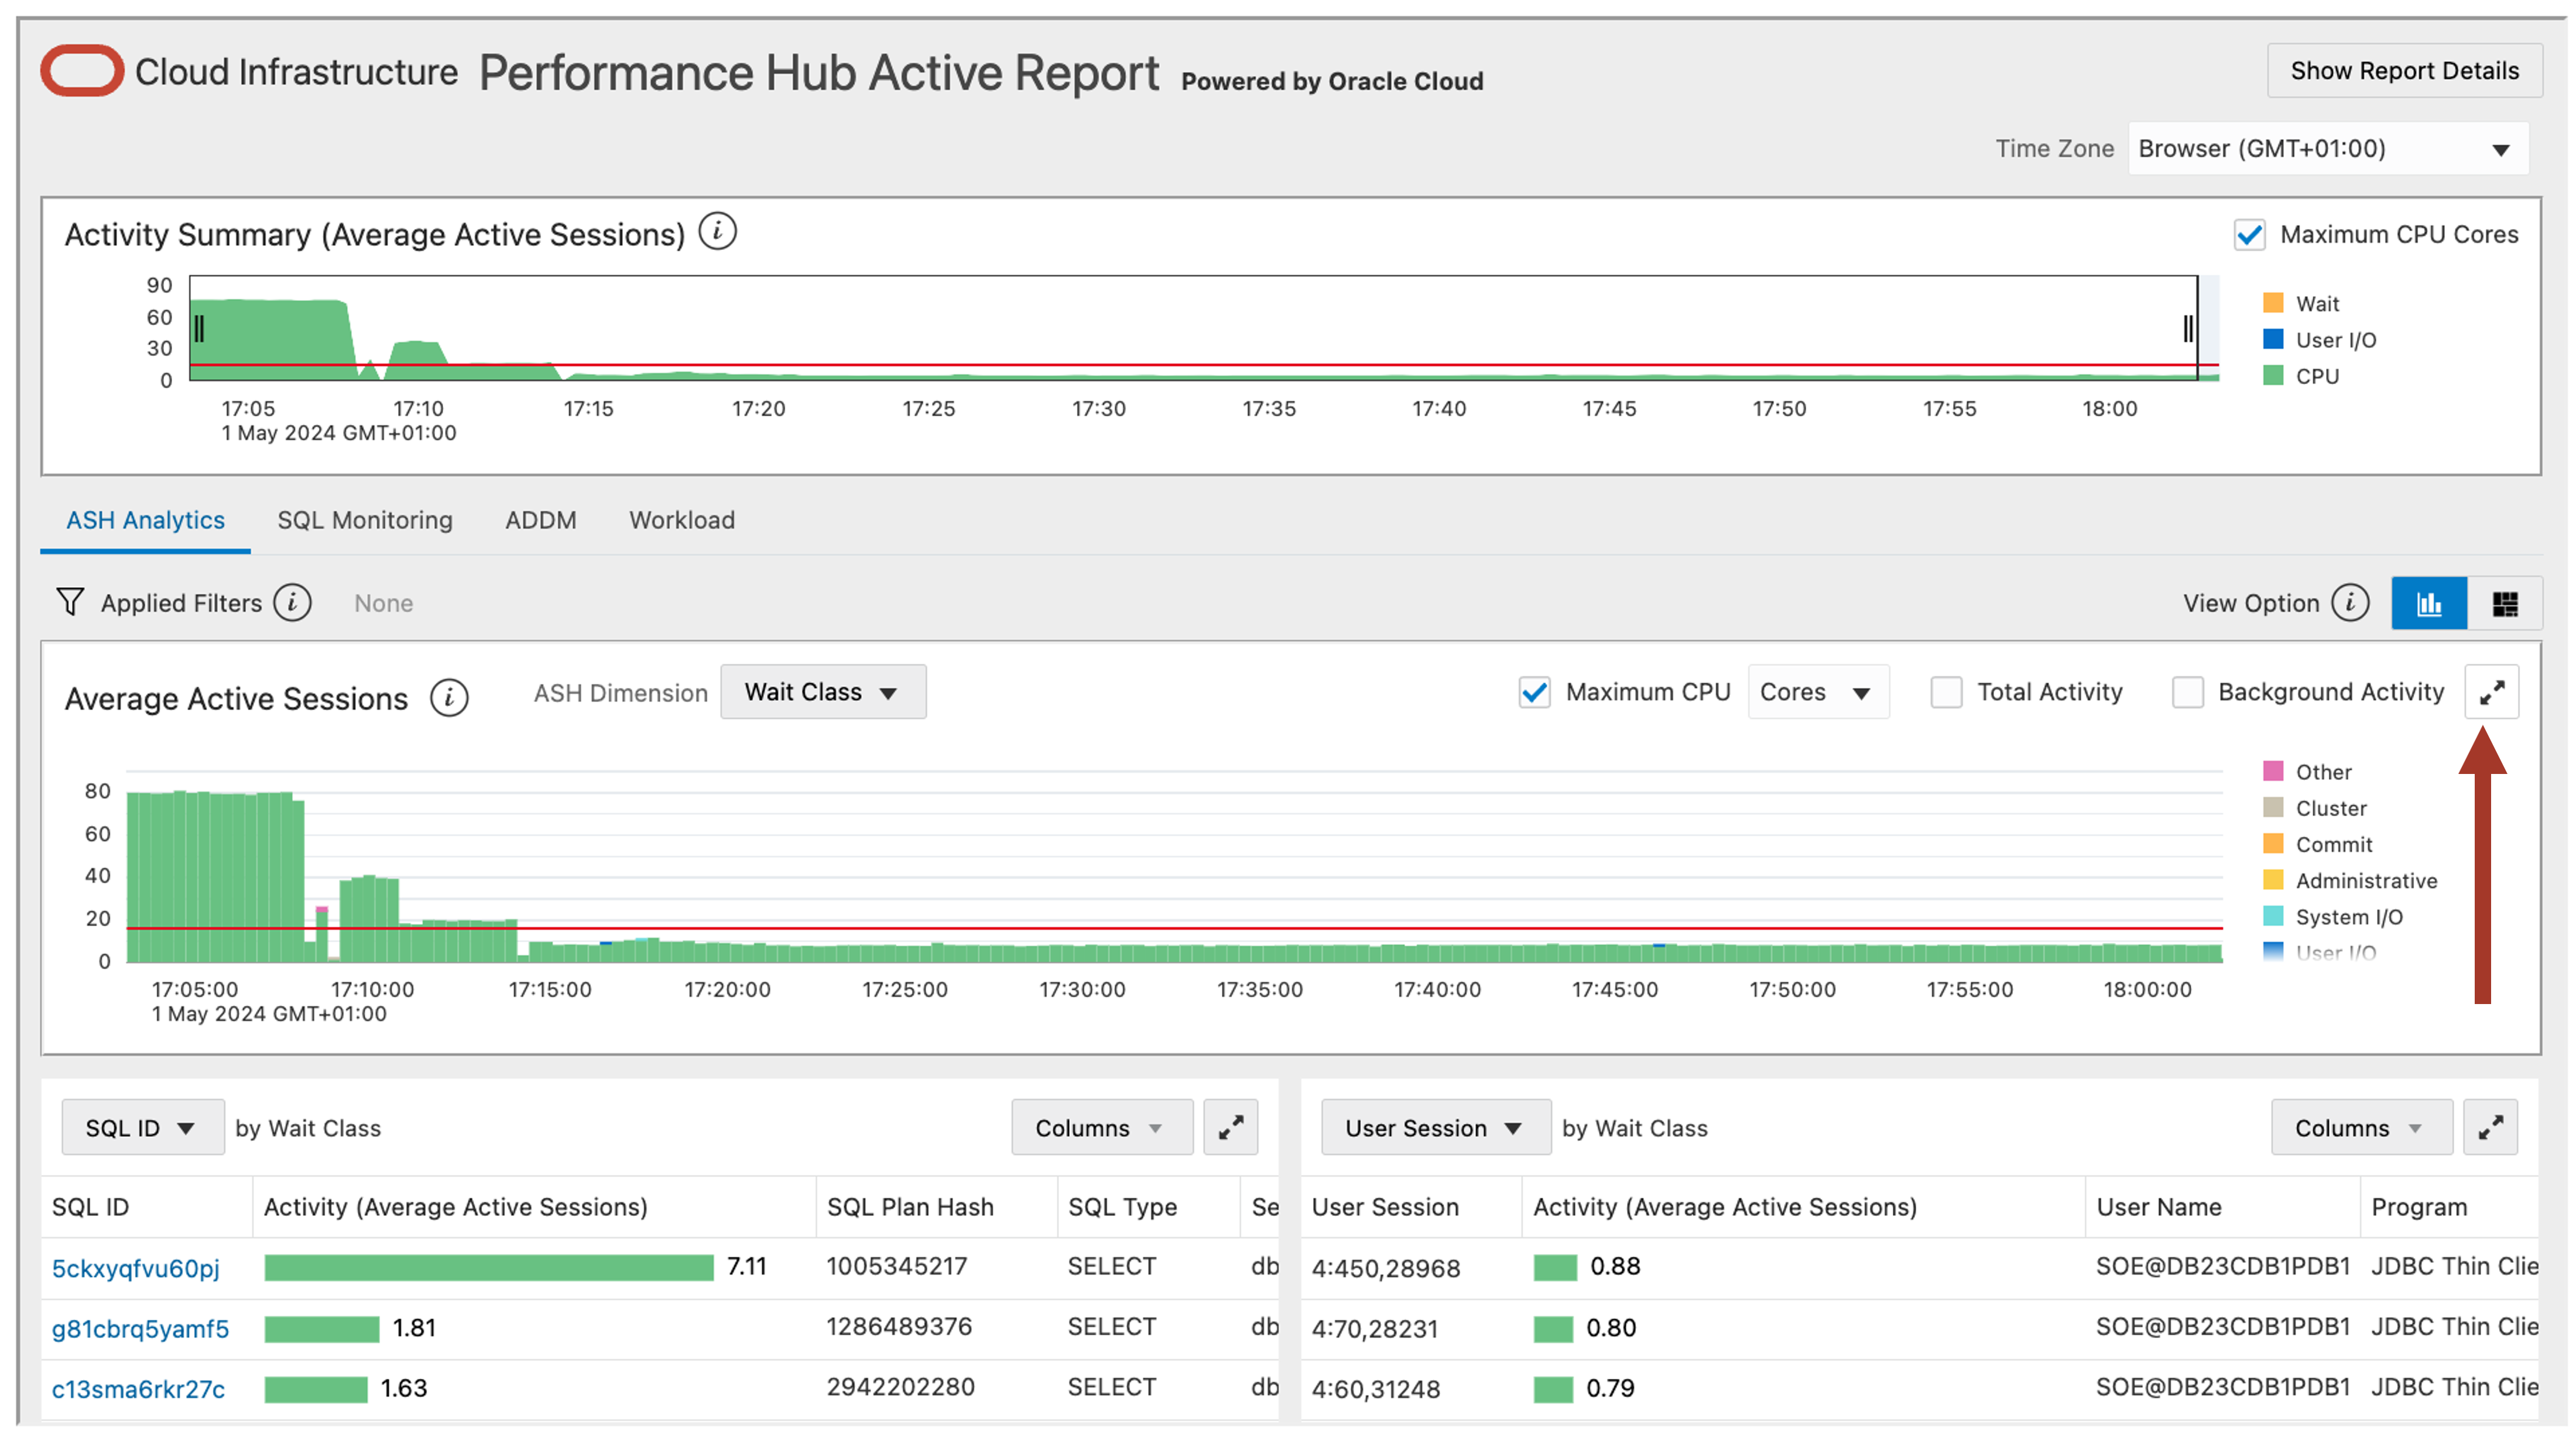
アクティブ・セッションとは、クライアントに代わってアクティブに動作しているセッションのことです。
デフォルトでは、Performance Hub レポートはASH Analytics タブで開きます。
ASHはActive Session Historyの略で、 アクティブなデータベース・セッションをサンプリングするデータベース機能です。
グラフを拡大してよりよく見てください。
ここでは、最も高い待機クラスが CPU であることがわかり、データベースが CPU バインドされていることがわかります
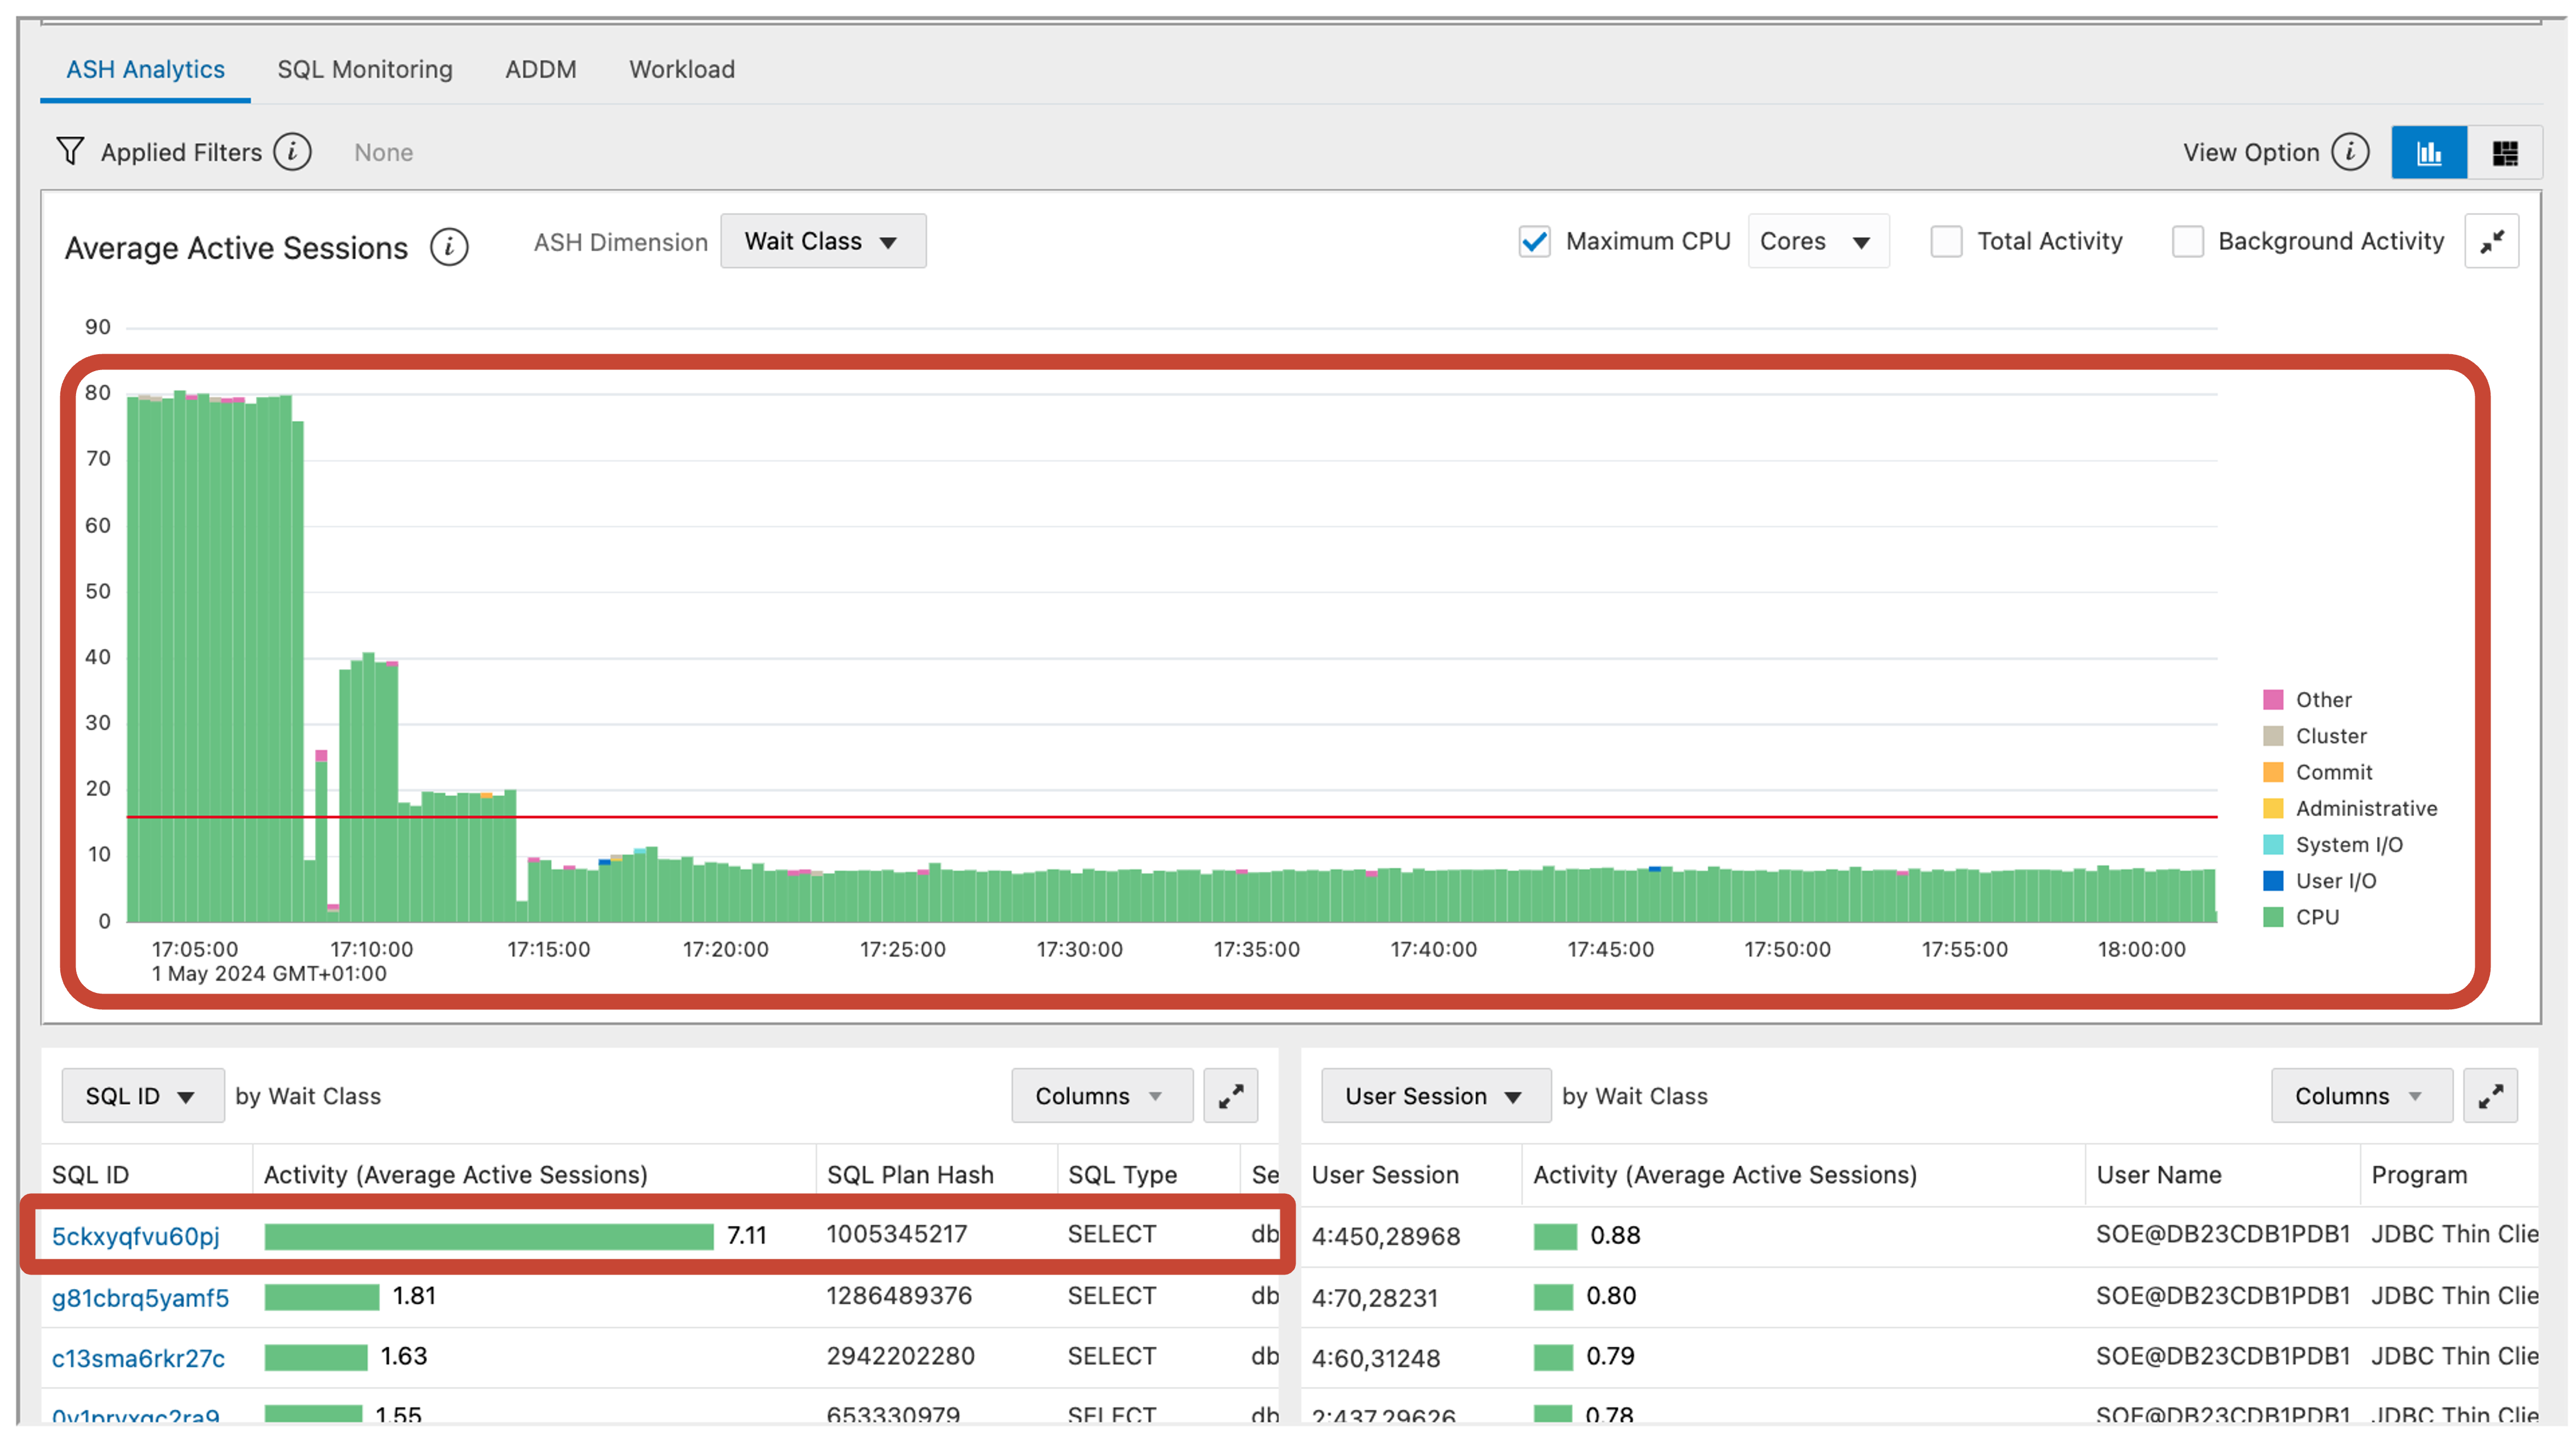
待ちクラス別のSQLグラフを見ると、チューニングの候補となるSQLを特定することができる。
もう一度グラフを折りたたんで、ADDMタブを見てみましょう。
ADDMは Automatic Database Diagnostic Monitor(自動データベース診断モニター)の略です。
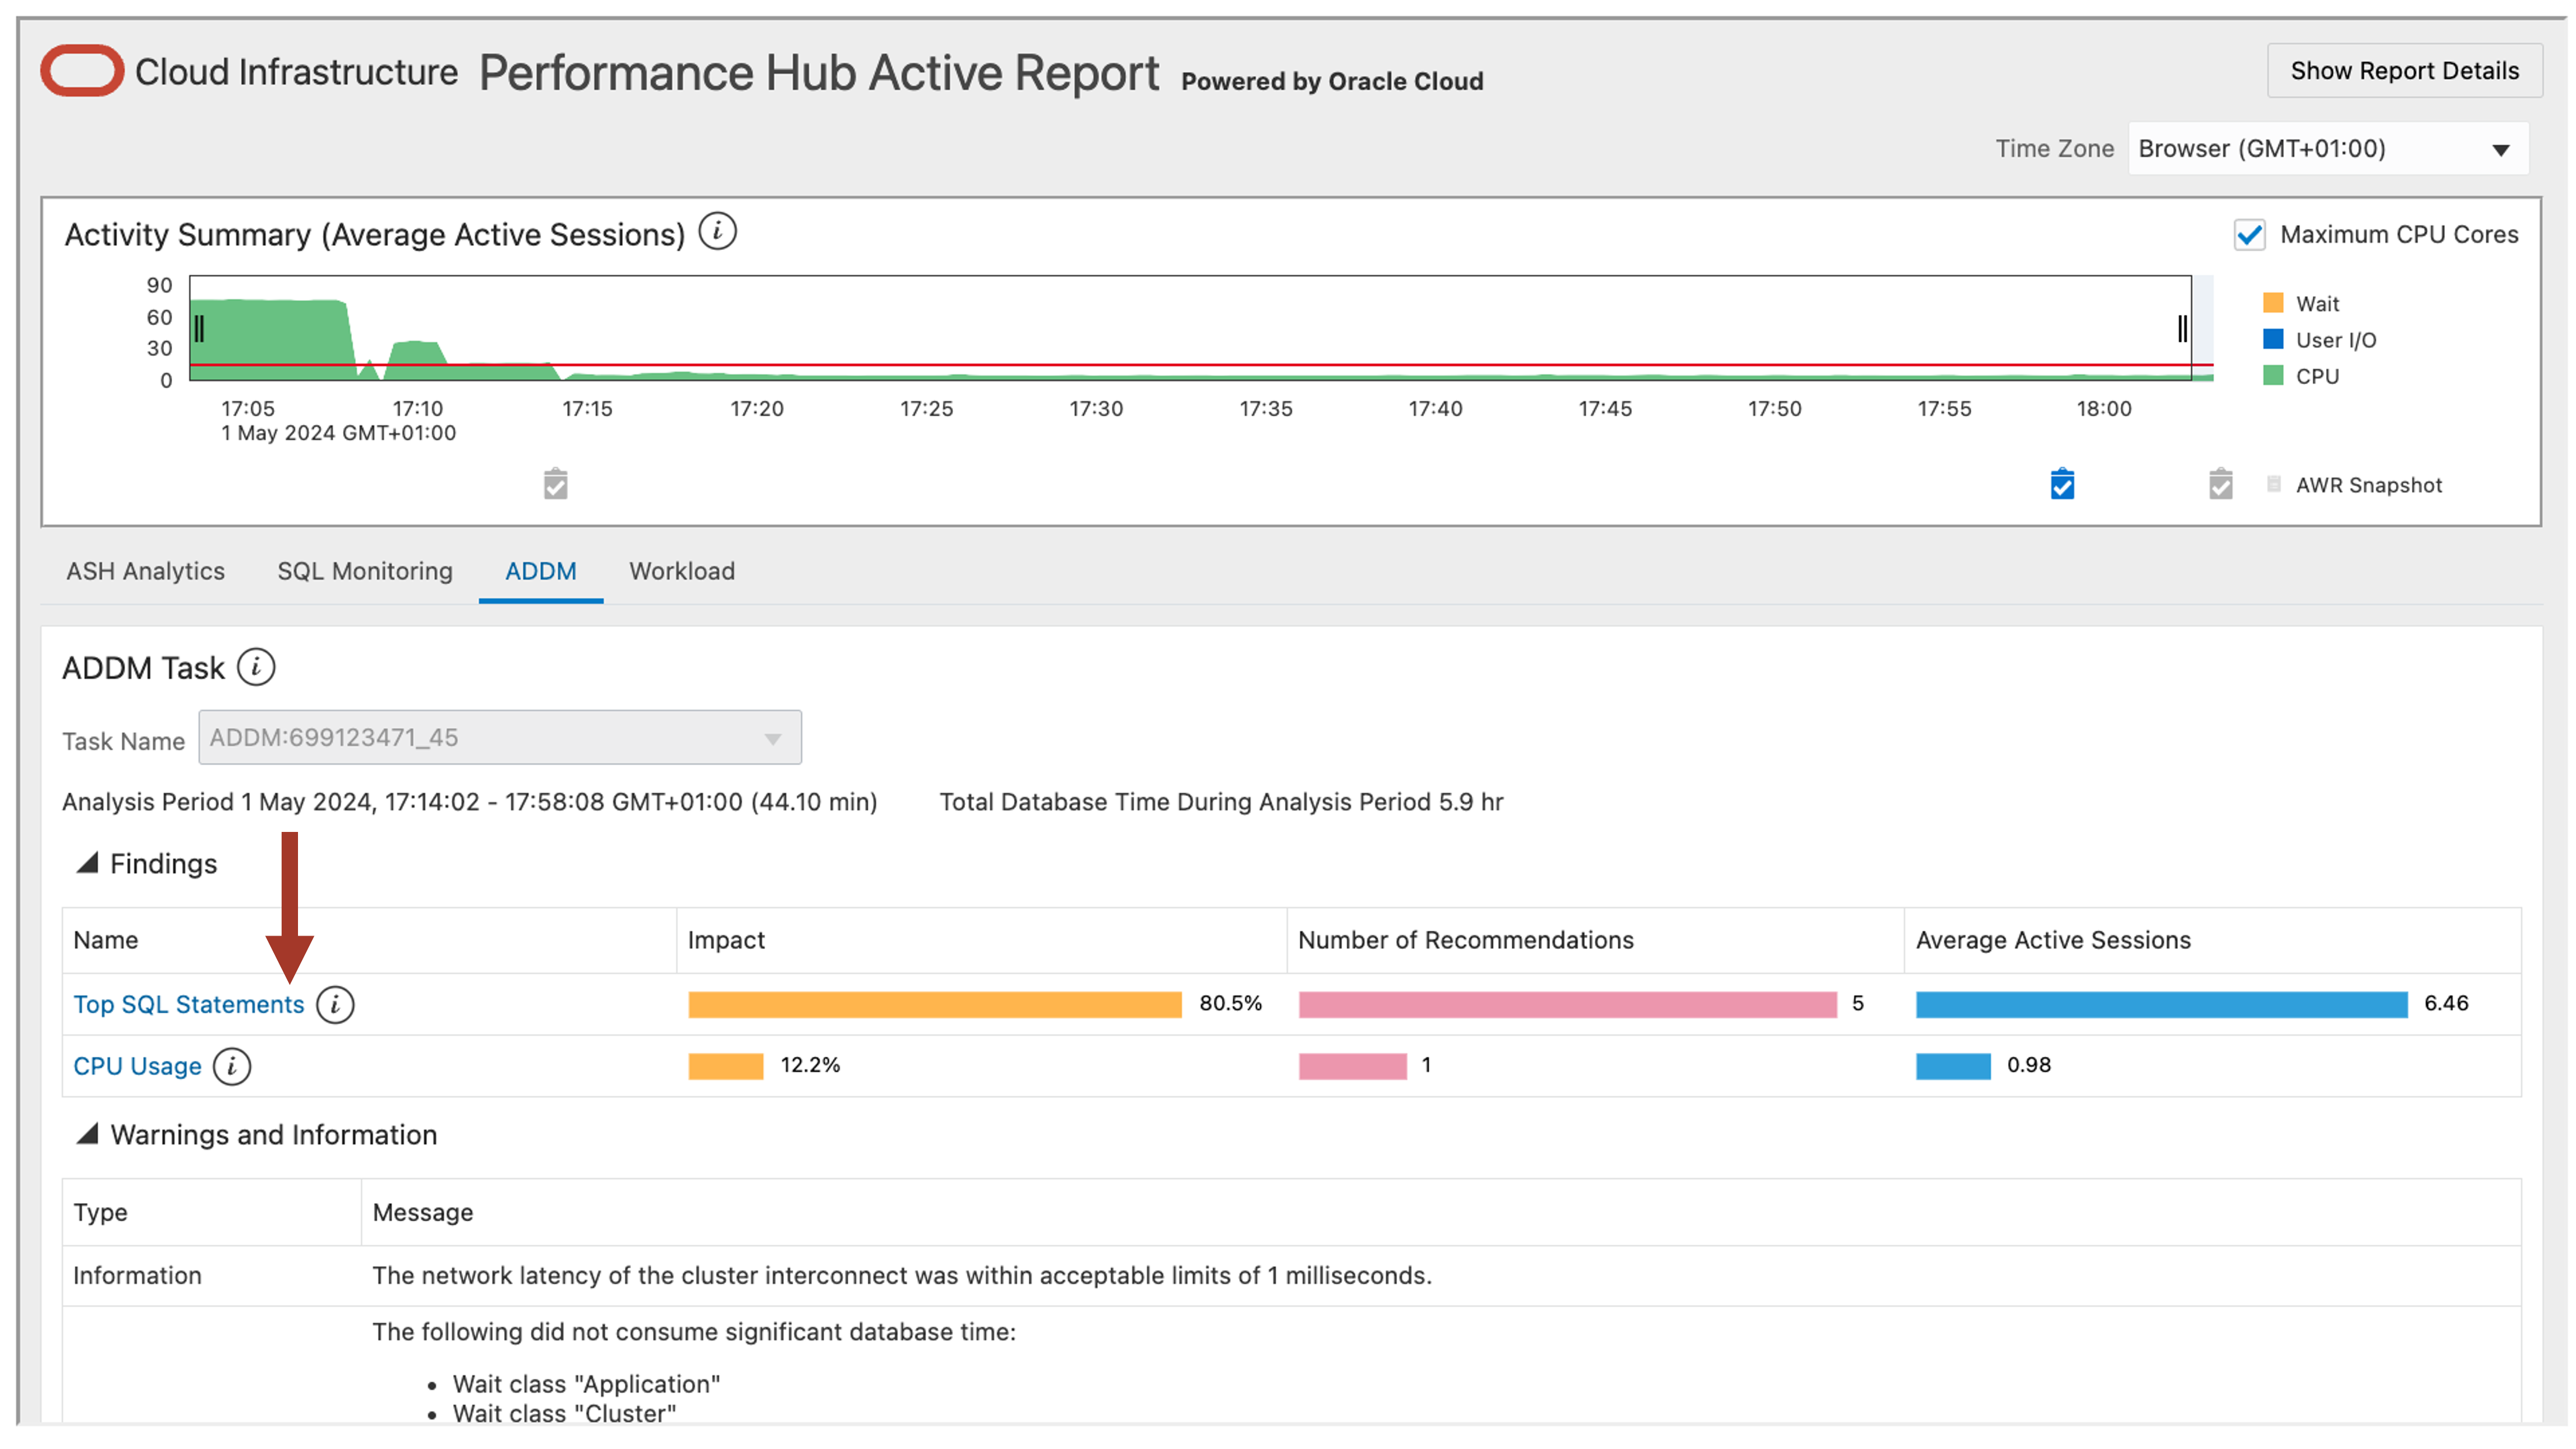
ADDMタブは、Automatic Workload Repository(AWR)のデータを分析し、パフォーマンス問題を解決するためのオプションを提供します。
Recommendations をクリックすると、推奨事項が表示されます。推奨は、何を変更すべきか、そして推定される利益を示します。
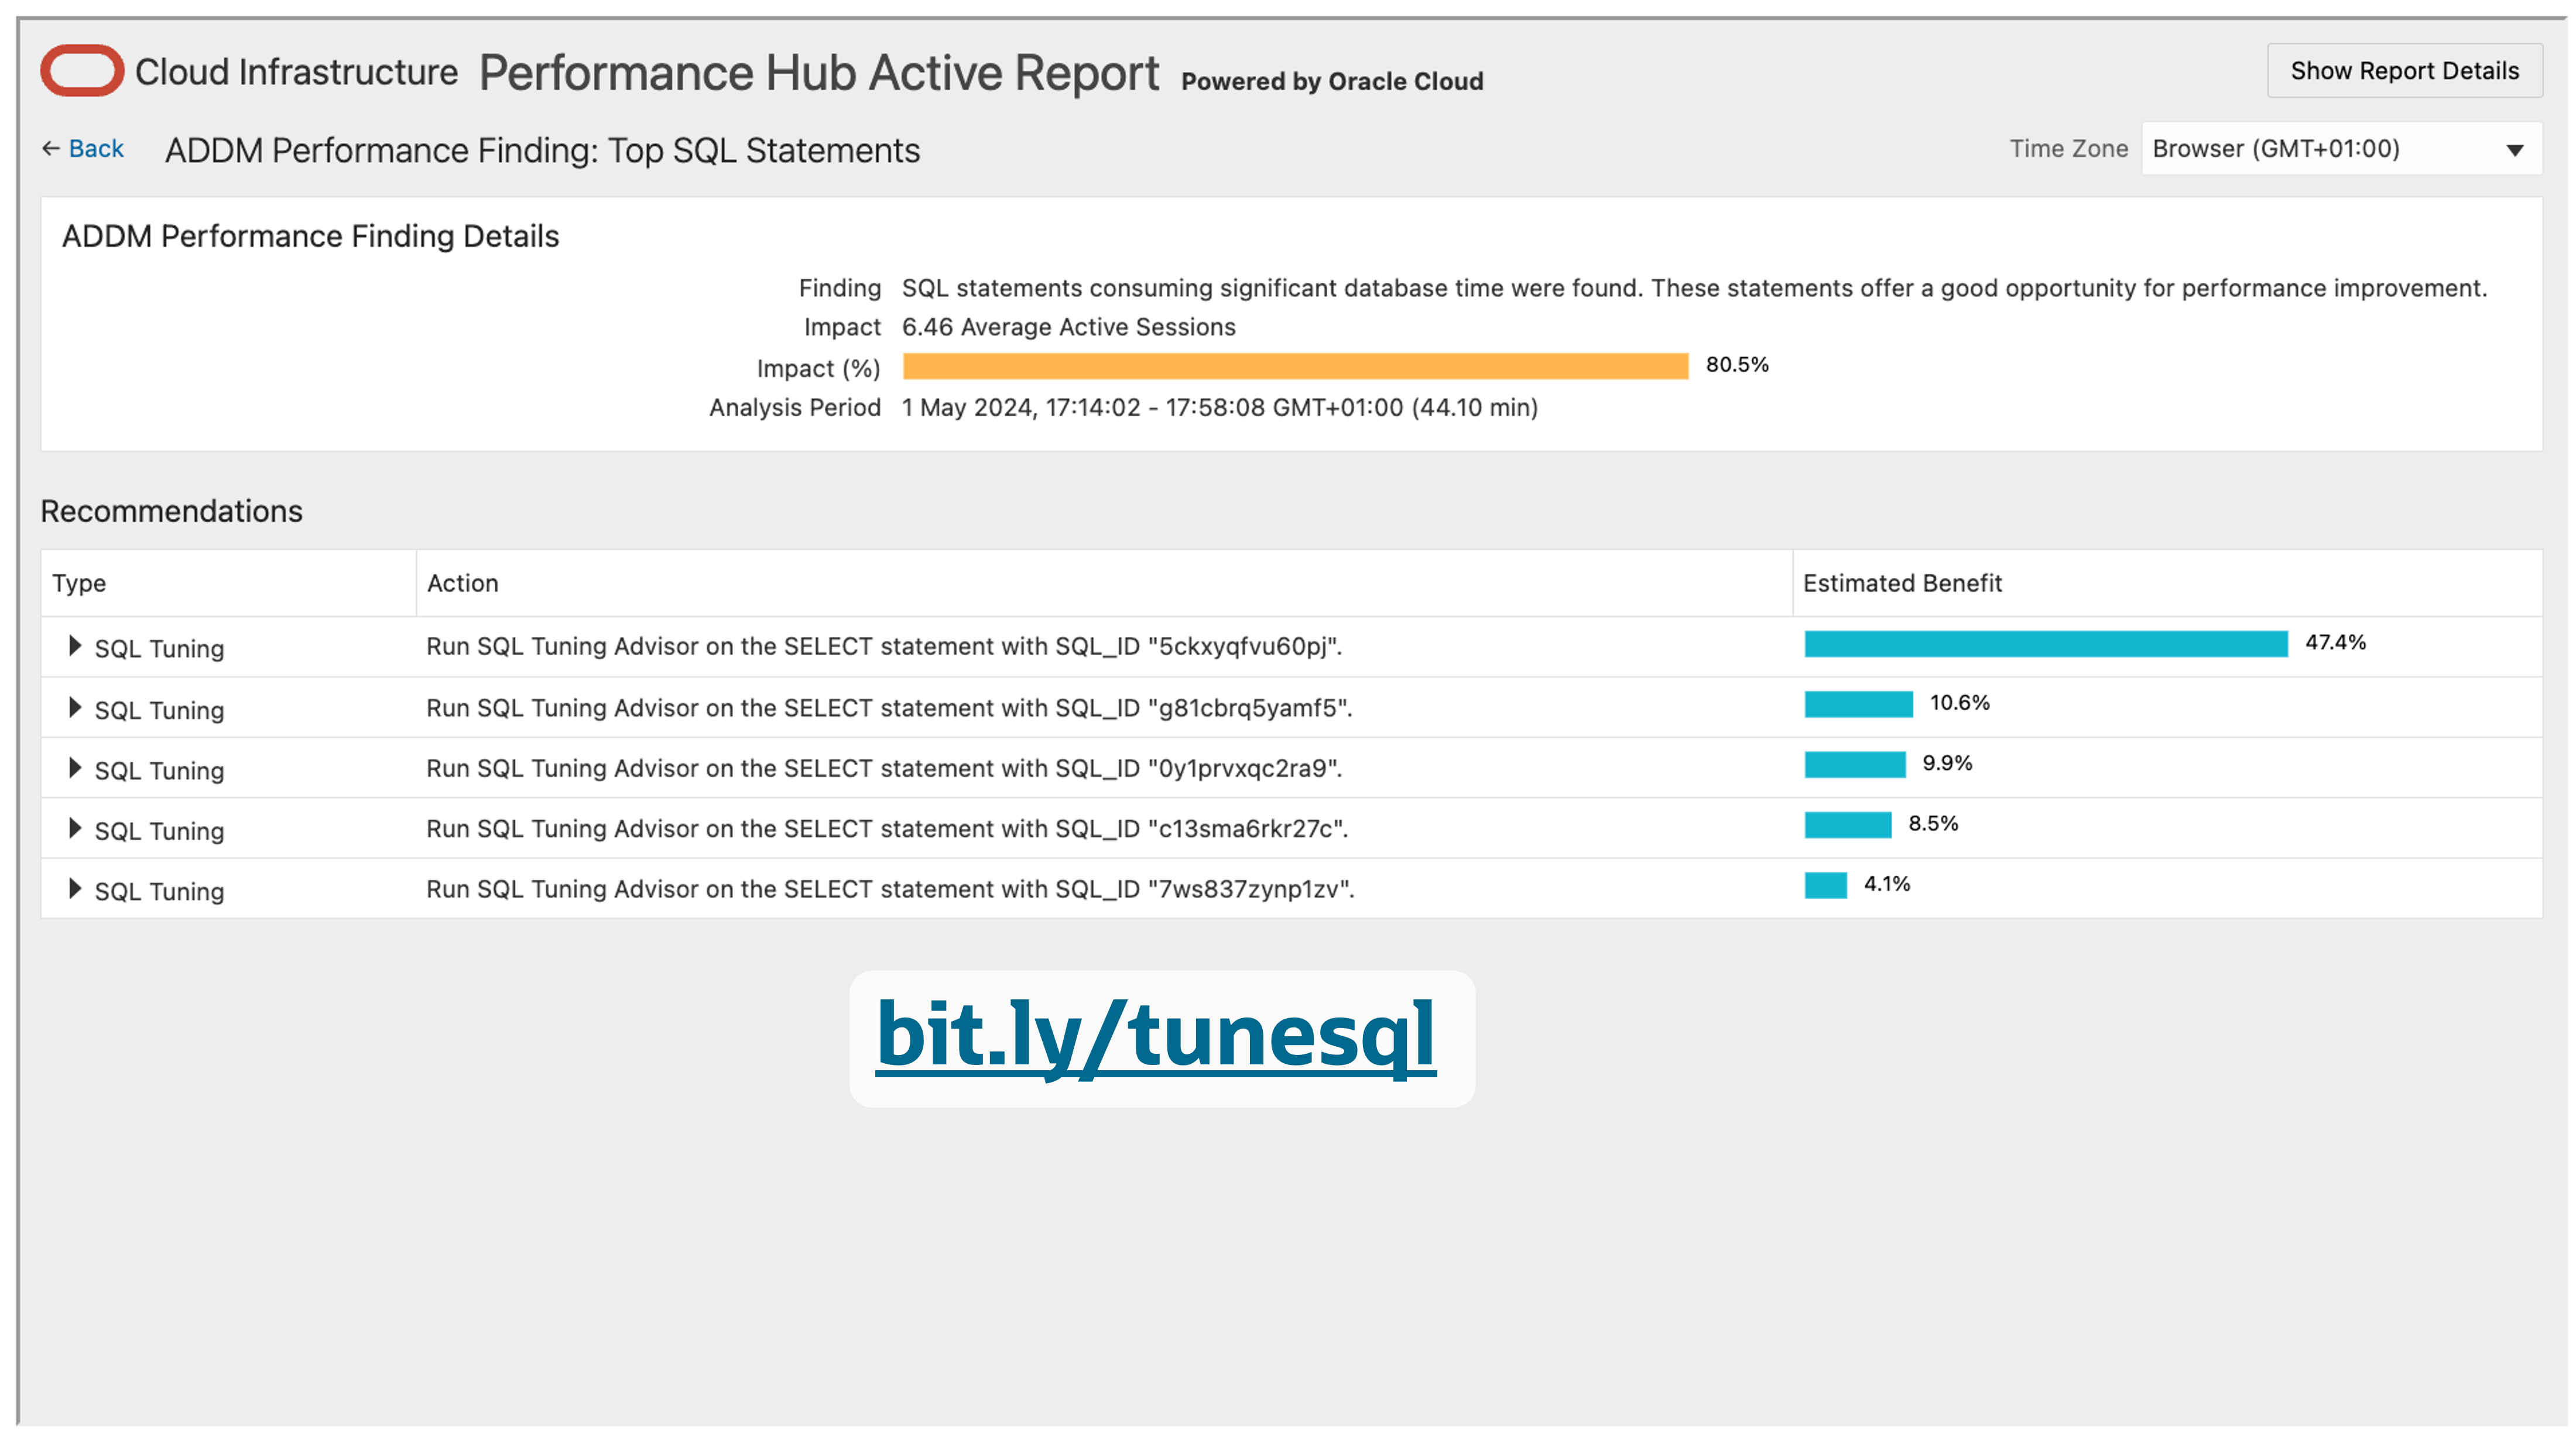
このテーブルを使用して、実行時間が長い特定のSQLステートメントを特定することができます。
一度特定すれば、個々のパフォーマンスのチューニングに集中することができます。
オラクルには、これに関するドキュメントガイドがあります(SQLチューニング・ガイド)。このガイドを読んで、クエリオプティマイザがどのように動作し、実行時間をどのように改善するかを理解してください。
冒頭で述べたように、データベースのパフォーマンスチューニングは多くの場合、反復的な作業です。
おそらく、1つの問題を修正したら、希望のパフォーマンス目標に到達するまで、次の問題を見つけるためにこれらのステップを繰り返す必要があります。
5. Autonomous Health Frameworkの診断収集を使用して新規SRを起票
それでもサポートが必要な場合は、Autonomous Health Frameworkの診断収集を使用してSRを記録します
My Oracle Supportにログイン :
- Service Requests タブを選択
- Create Technical SR ボタンをクリック
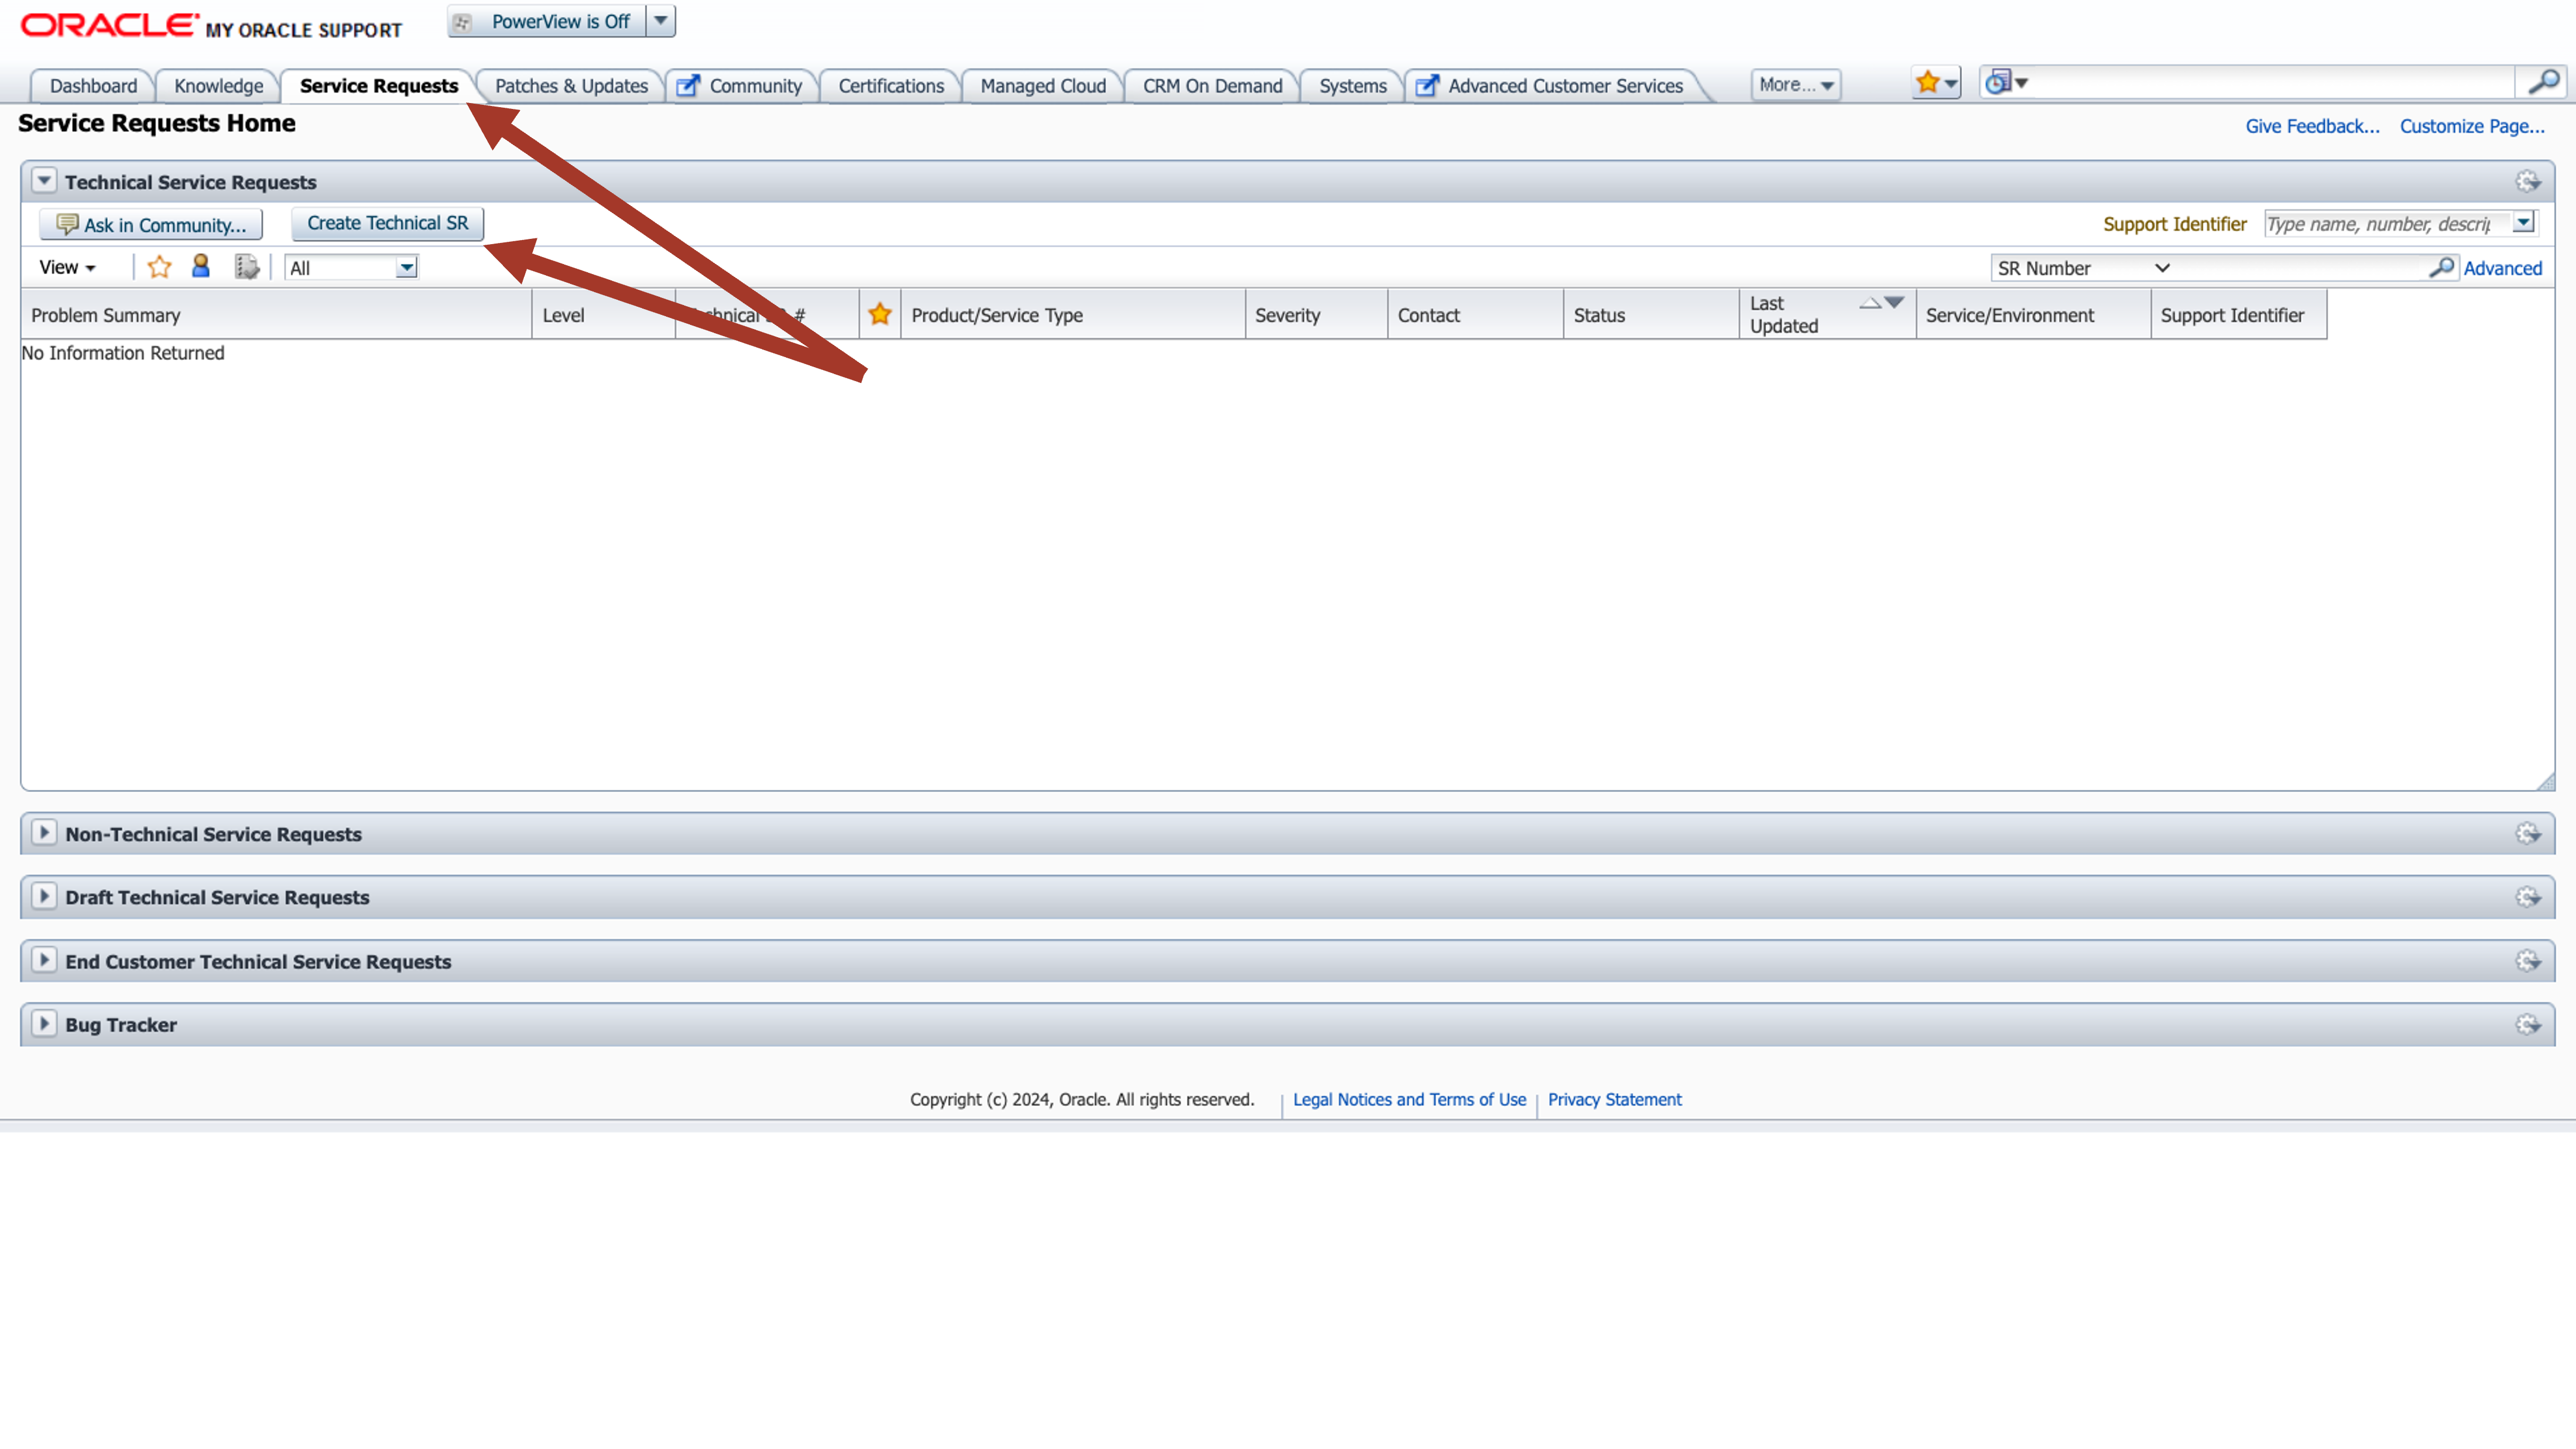
Service Request で必要な項目を埋めます.
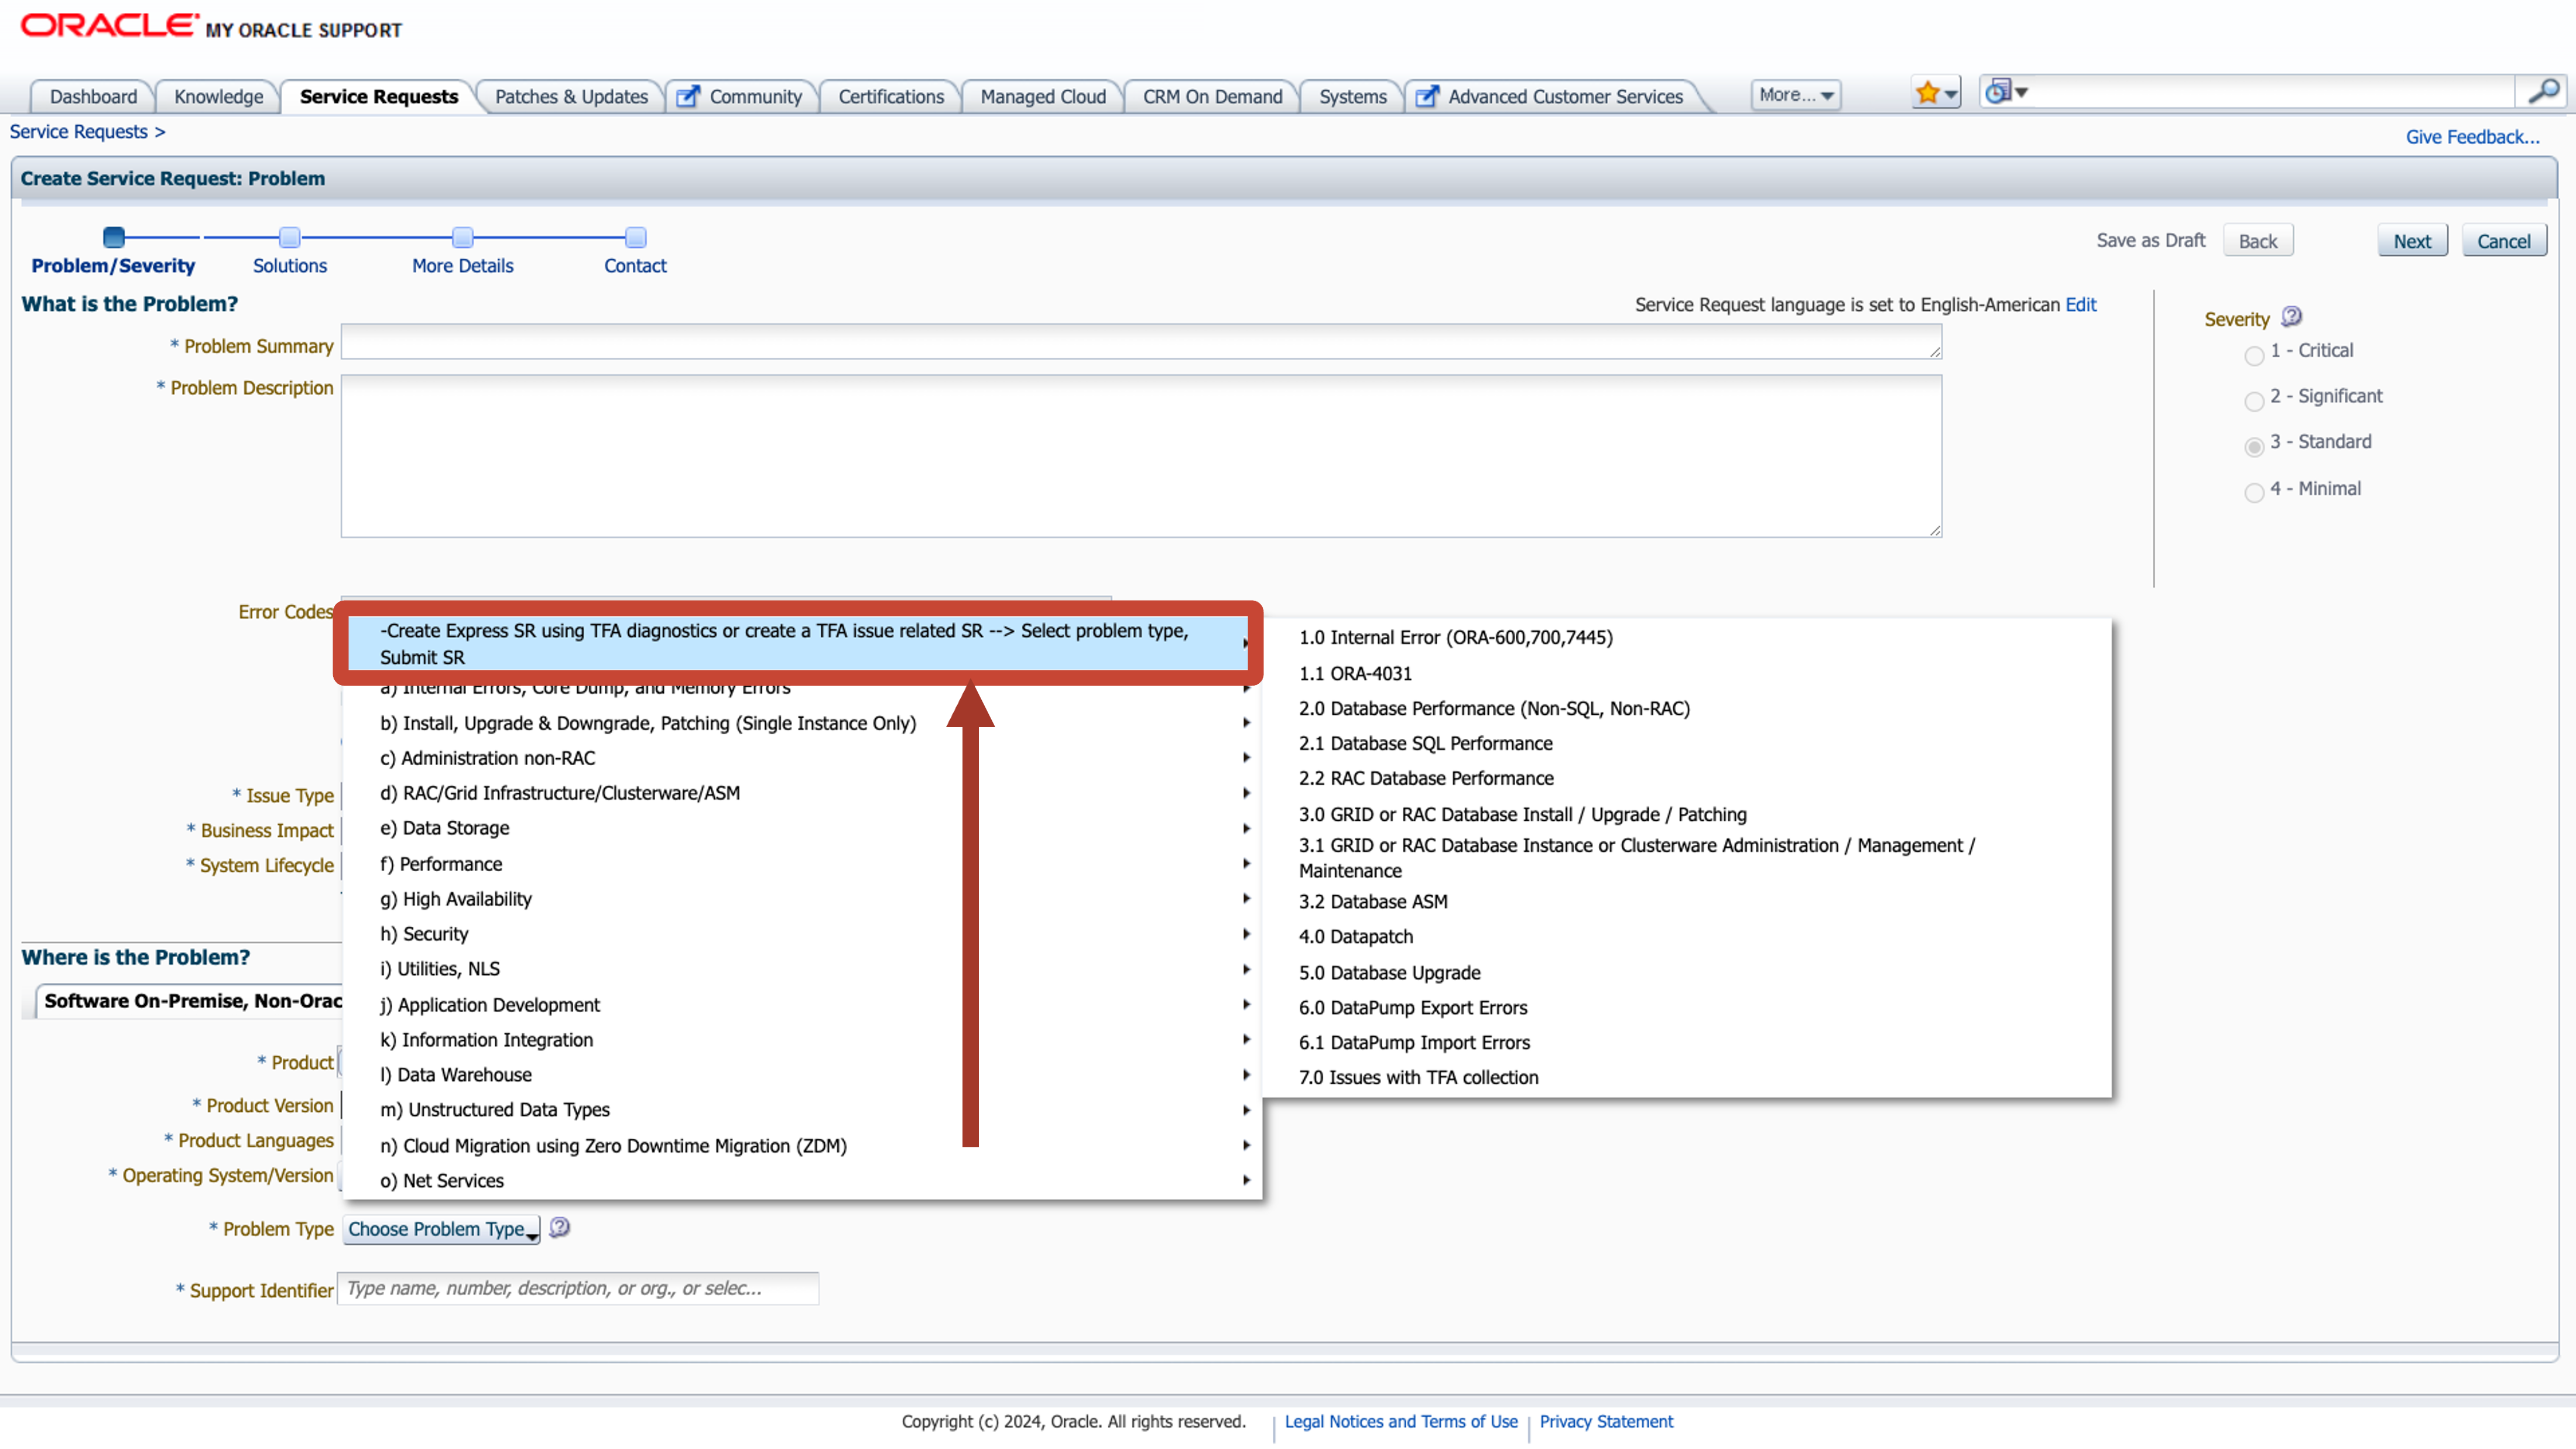
製品(Product)を “Oracle Database – Enterprise Edition” として登録します。
次に、問題タイプが表示されたら、Express SRを作成するオプションを選択します。
これは、Autonomous Health Frameworkコレクションを使用した高速トラックSR作成ルートです。
コレクションのアップロードなど、残りのステップに従います。
これで終わりです!
Oracle Supportが引き継ぎ、解決を支援します。
いますぐ始めてみる
Autonomous Health Framework – Including Trace File Analyzer and Orachk/Exachk (Doc ID 2550798.1)からダウンロード