Now that Oracle Database 23c Free is available, it’s time to take a look at a new feature we’ve built into the optimizer to help you avoid some mistakes when building queries.
It’s called the SQL Analysis Report and appears in a new section at the end of a SQL execution plan.
Here are a few simple examples to get you going:
select sum(t1.c1),sum(t2.c1)
from   t1,t2;

SELECT * FROM table(DBMS_XPLAN.DISPLAY_CURSOR(FORMAT=>'typical'));

------------------------------------------------------------------------------
| Id  | Operation             | Name | Rows  | Bytes | Cost (%CPU)| Time     |
------------------------------------------------------------------------------
|   0 | SELECT STATEMENT      |      |       |       | 59970 (100)|          |
|   1 |  SORT AGGREGATE       |      |     1 |     8 |            |          |
|   2 |   MERGE JOIN CARTESIAN|      |    99M|   762M| 59970   (1)| 00:00:03 |
|   3 |    TABLE ACCESS FULL  | T2   |  9999 | 39996 |    10   (0)| 00:00:01 |
|   4 |    BUFFER SORT        |      |  9999 | 39996 | 59960   (1)| 00:00:03 |
|   5 |     TABLE ACCESS FULL | T1   |  9999 | 39996 |     6   (0)| 00:00:01 |
------------------------------------------------------------------------------

SQL Analysis Report (identified by operation id/Query Block Name/Object Alias):
-------------------------------------------------------------------------------

   1 -  SEL$1
           -  The query block has 1 cartesian product which may be
              expensive. Consider adding join conditions or removing the
              disconnected tables or views.

select * from (
select c1
from   t1
union
select c1
from   t2);

SELECT * FROM table(DBMS_XPLAN.DISPLAY_CURSOR(FORMAT=>'typical'));

-----------------------------------------------------------------------------
| Id  | Operation            | Name | Rows  | Bytes | Cost (%CPU)| Time     |
-----------------------------------------------------------------------------
|   0 | SELECT STATEMENT     |      |       |       |    22 (100)|          |
|   1 |  VIEW                |      | 19998 |   253K|    22  (19)| 00:00:01 |
|   2 |   HASH UNIQUE        |      | 19998 | 79992 |    22  (19)| 00:00:01 |
|   3 |    UNION-ALL         |      | 19998 | 79992 |    22  (19)| 00:00:01 |
|   4 |     TABLE ACCESS FULL| T1   |  9999 | 39996 |     8   (0)| 00:00:01 |
|   5 |     TABLE ACCESS FULL| T2   |  9999 | 39996 |    10   (0)| 00:00:01 |
-----------------------------------------------------------------------------

SQL Analysis Report (identified by operation id/Query Block Name/Object Alias):
-------------------------------------------------------------------------------

   2 -  SET$1
           -  The query block contains UNION which may be expensive.
              Consider using UNION ALL if duplicates are allowed or
              uniqueness is guaranteed.


select id
from   t2
where  substr(c2,1,1) = '1';

SELECT * FROM table(DBMS_XPLAN.DISPLAY_CURSOR(FORMAT=>'typical'));

--------------------------------------------------------------------------
| Id  | Operation         | Name | Rows  | Bytes | Cost (%CPU)| Time     |
--------------------------------------------------------------------------
|   0 | SELECT STATEMENT  |      |       |       |    10 (100)|          |
|*  1 |  TABLE ACCESS FULL| T2   |  1111 |  9999 |    10   (0)| 00:00:01 |
--------------------------------------------------------------------------

Predicate Information (identified by operation id):
---------------------------------------------------

   1 - filter(SUBSTR("C2",1,1)='1')

Note
-----
   - statistics feedback used for this statement

SQL Analysis Report (identified by operation id/Query Block Name/Object Alias):
-------------------------------------------------------------------------------

   1 -  SEL$1 / "T2"@"SEL$1"
           -  The following columns have predicates which preclude their
              use as keys in index range scan. Consider rewriting the
              predicates.
                "C2"
It’s not just in DBMS_XPLAN. Check out a SQL Monitor active report and pick the SQL Analysis tab:
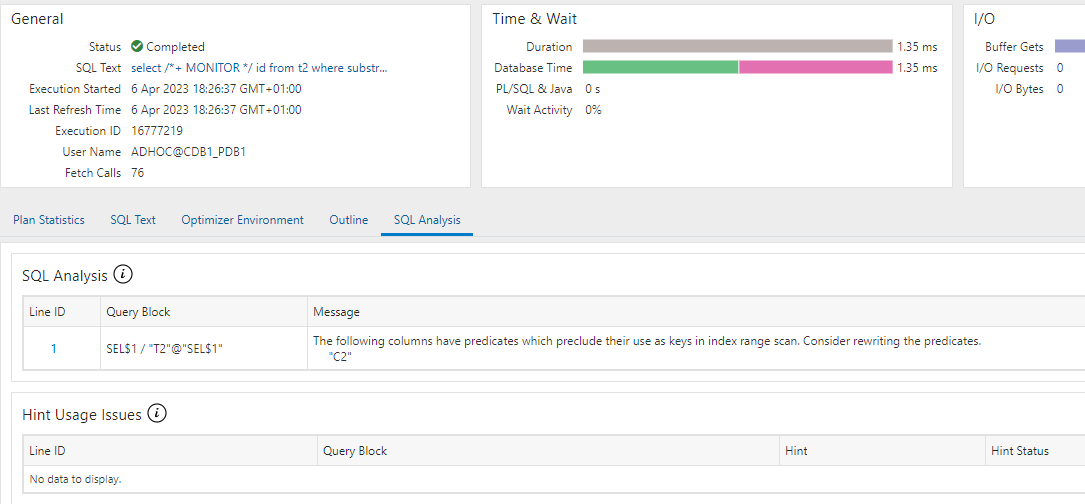
You might notice above there’s also a section called “Hint Usage Issues.” This is a hint usage report and will help you out if you have a hint problem.
In the following example, I messed up the FULL hint and referenced a table that’s not used in the query. The report tells where I made a mistake.

I generated the HTML report above like this:
set linesize 250 pagesize 0 trims on tab off long 1000000
column report format a220
spool report.html
select
   DBMS_SQL_MONITOR.REPORT_SQL_MONITOR
        (sql_id=>'7xcpaw8jgzywy',report_level=>'ALL', type=>'ACTIVE') report
from dual;
spool off
Generating SQL monitor reports is covered in another blog post.
If you want to learn more about the SQL Analysis, check out the documentation.
Discovering SQL Issues in the Cursor Cache
I’ve provided some examples of using this feature in my GitHub repository.
One of the most useful aspects the SQL analysis report is that you can go looking in the cursor cache for problem SQL. In the Github repository I’ve included an example of this (example3).
Here’s my problem SQL statement:
var bind1 number
exec :bind1 := 1      --- Here's the problem, because s_area (below) is a CHAR(4) column

select t3.p_category, t4.tpmethod
from  products t3, sources t4
where t3.scid = t4.scid
and   t4.carrier   = 'AAC'
and   t4.s_area    = :bind1;
This is how I can find the problem:
select distinct sql_id,child_number,sql_text
from  v$sql a,
      table(DBMS_XPLAN.DISPLAY_CURSOR(sql_id=>a.sql_id)) b
where b.plan_table_output like '%use as keys in index range scan%'
and   sql_text like '%products%'
order by sql_id,child_number;
I’d be a little careful of running this on an entire cursor cache (it could take a while), so filter it down like I have (I’m looking for the products table). Since you can use DBMS_XPLAN like a table, the results can be joined with V$SQL. The query above will discover that the bind variable is the wrong type. I think that is incredibly useful.