In our previous blog post I described how you can use the new diagnostic event infrastructure in Oracle Database 11g to capture an Optimizer trace (10053) for any SQL statement once you have its SQL_ID. The approach I showed using the traditional ‘Alter session set event’ approach and thus required you to execute the SQL statement. What I forgot to mention (and have been scolded for) was that you can also use the new infrastructure to generate an Optimizer trace for any SQL statement in the cursor cache without having to execute it. The DBMS_SQLDIAG package has been extend to include a procedure called DUMP_TRACE. This procedure, just like the event requires only the SQL_ID of the statement you wish to generate an Optimizer trace for but it doesn’t require you to re-execute the statement. The procedure will automatically trigger a hard parse of the statement to generate the trace.
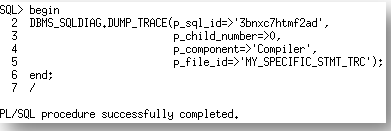
So if we continue with the example we had in the previous blog post. The command to generate the trace with the new DUMP_TRACE procedure would be as follows.
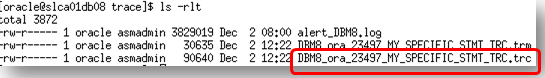
After running the procedure you can easily find the trace file by looking in USER_DUMP_DEST for the trace file whose name includes ‘MY_SPECIFIC_STMT_TRC’.
Unfortunately the DUMP_TRACE procedure didn’t make it into the DBMS_SQLDIAG documentation but Greg Rahn has blogged about this procedure in a lot more detail if you are interested.