New solution extends Oracle’s full-stack observability to the hypervisor layer, helping you correlate VMware infrastructure conditions with operating systems, middleware, databases, and application performance across hybrid cloud environments spanning OCI and on-premises infrastructure.
Modern incident investigation and root cause analysis rarely begin and end in a single infrastructure layer. A storage condition in vSphere can surface as database latency. A host issue can ripple into middleware performance. An application slowdown may ultimately trace back to infrastructure events in vCenter. While vCenter already gives you rich operational context, the operational signals you rely on most during troubleshooting are often distributed across metrics, events, alarms, syslog, inventory, and lifecycle activity.
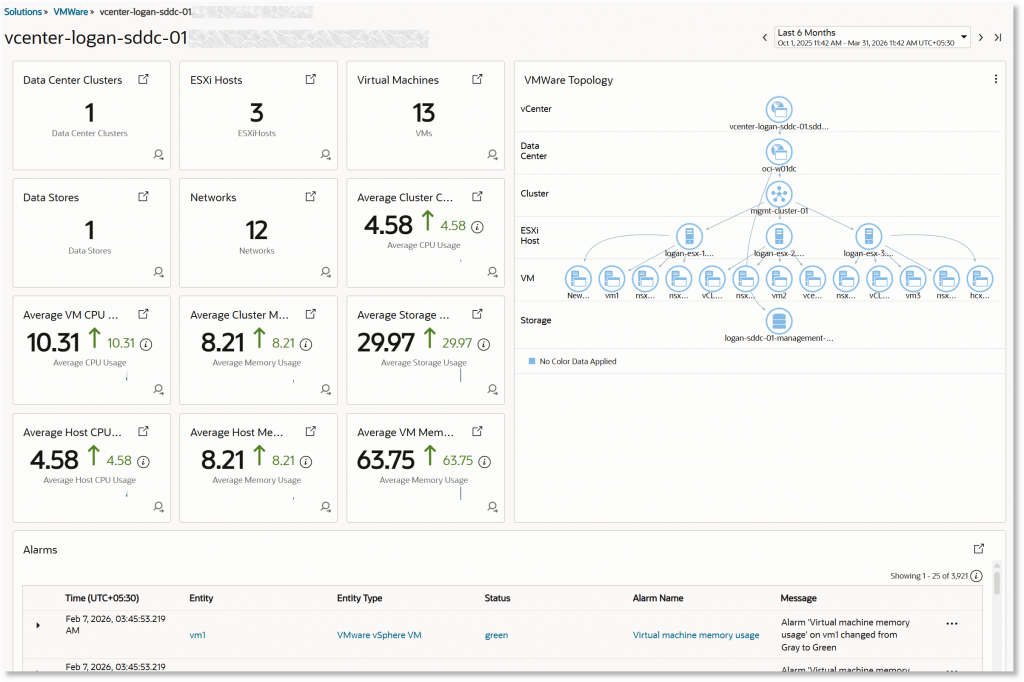
Oracle is helping you address that challenge with a new VMware vSphere monitoring and performance analytics solution in Oracle Log Analytics.
This new solution extends Oracle Log Analytics to the hypervisor layer by bringing VMware vCenter telemetry, logs, operational context, and relationship data into Oracle’s broader analytics platform. You can use it to monitor your VMware vSphere environments while enabling cross-layer correlation between VMware infrastructure, operating systems, middleware, databases, and applications running inside your VMware virtual machines. The result is more complete visibility across your infrastructure and applications, faster cross-layer root cause analysis, and stronger operational visibility across hybrid cloud environments.
What the Solution Delivers
The VMware vSphere monitoring solution for Oracle Log Analytics is designed to give you infrastructure observability and performance monitoring for your VMware environments.
The solution collects and analyzes:
- Logs
- Metrics
- vSphere inventory
- Alerts
- Lifecycle events
- vSphere topology and relationship context
The solution uses vCenter-based data ingest for inventory, telemetry, and alert feeds. Oracle Log Analytics then applies ingestion, parsing, normalization, topology-aware entity correlation, and analytics workflows to transform raw VMware telemetry into actionable insights at enterprise scale.
Instead of requiring you to define entities, normalize telemetry, and build observability workflows from scratch, the solution gives you an out-of-the-box observability experience for operational monitoring and investigation across your VMware vSphere environment.
One of the key capabilities is automatic relationship inference and application dependency mapping between discovered VMware virtual machines and the guest OS hosts running inside them using the Oracle Management Agent already deployed on the VM host. This helps you connect the vSphere layer directly to the operating system and software stack running within the VM.
Why This Matters
Oracle Log Analytics already supports observability and analytics for compute, databases, Kubernetes, WebLogic Server, middleware, and end-to-end application stacks. With VMware vSphere monitoring, Oracle now extends that visibility to the hypervisor layer.
This matters because your infrastructure and workload behavior are tightly connected. During incident response:
- Metrics help you identify abnormal behavior or resource contention
- Events provide evidence of operational change
- Alarms highlight conditions that require immediate attention
- Syslog gives you low-level technical detail
- Inventory and topology show what is connected and what may be impacted
Each of these telemetry sources is valuable individually. Together, they become significantly more powerful when tied back to the VMware hierarchy your teams already understand and correlated with workload behavior across the rest of your stack.
If you are running VMware workloads on OCI, this becomes especially powerful because host issues, storage conditions, lifecycle changes, or alarms in vCenter can directly impact the applications and services running on VMware-based workloads. By bringing those infrastructure telemetry streams into Oracle Log Analytics, you can investigate issues with broader operational context while spending less time switching across tools.
The same value applies if you operate VMware vSphere on premises. You can now use Oracle Log Analytics to extend infrastructure visibility and operational analytics across both infrastructure and workload layers.
What You Gain with VMware vSphere Monitoring
End-to-End Visibility Across the Stack
You can correlate VMware infrastructure conditions with operating systems, middleware, databases, and application behavior from a unified analytics platform.
Faster Root-Cause Analysis
Your teams can move more quickly from symptom to cause by analyzing infrastructure and application data together from a unified analytics platform instead of pivoting between disconnected monitoring tools.
Operational Context at Scale
Logs, metrics, alerts, events, inventory, and topology become far more valuable when normalized, associated with entities, and analyzed together.
Faster Operational Adoption
The solution gives you a ready-made starting point for VMware observability, reducing the effort required to onboard telemetry and create monitoring workflows.
Bridging Hypervisor and Workload Observability
Automatic relationship inference and application dependency mapping help you connect VMware VMs to guest OS hosts and the software running inside them, improving impact analysis and troubleshooting workflows.
Support for OCI and On-Premises Deployments
The solution is designed to support you whether you operate VMware vSphere in Oracle Cloud Infrastructure or across on-premises VMware estates.
Building a Foundation for Full-Stack Observability
The addition of VMware vSphere monitoring strengthens Oracle’s broader vision for full-stack observability and operations management. Oracle Log Analytics already helps you observe and analyze activity across critical infrastructure and application layers. By adding vSphere telemetry and relationship context, Oracle is helping complete that operational picture.
This means you can accelerate cross-layer root cause analysis across infrastructure and application layers:
- From a vSphere alarm to the affected VM and guest OS
- From an application symptom to the infrastructure supporting it
- From a lifecycle event or host issue to impacted databases, middleware, and business services
This cross-layer workflow becomes increasingly important as enterprise environments grow more interconnected and operations teams are expected to resolve issues faster with fewer silos.
Looking Ahead
As you continue operating complex enterprise environments across cloud and on-premises infrastructure, observability must extend beyond isolated monitoring domains. Hypervisor conditions, OS behavior, and application performance are all part of the same operational story.
VMware vSphere monitoring in Oracle Log Analytics is an important step toward that more unified observability model. It extends Oracle’s observability and analytics capabilities deeper into the infrastructure stack while creating stronger connections between infrastructure telemetry and workload behavior.
Over time, this foundation can support richer topology-aware analytics and dependency analysis, broader cross-domain correlation, and more intelligent incident response workflows across your environment.
With this new solution, Oracle Log Analytics continues advancing toward a more complete end-to-end observability and operations platform — helping you understand, monitor, and troubleshoot the full stack from hypervisor to application.
More Resources
VMware vSphere monitoring in Oracle Log Analytics is now available to help you simplify operations, accelerate troubleshooting, and gain deeper visibility across your infrastructure and applications. As enterprise environments continue evolving across hybrid cloud architectures, Oracle continues expanding observability and analytics capabilities to help you manage increasingly interconnected infrastructure and application environments more effectively.