Are you struggling to optimize your Oracle database performance? Do you want to learn how to use the most effective method for improving system and individual query performance? Join our upcoming webinar: Unlock the Secrets of Database Time and Average Active Sessions, July 10, 2025 at 9 am PT. We will delve into the world of Database Time (DB Time) and Average Active Sessions (AAS), two fundamental concepts that are at the heart of the DB Time Method. Replay Available.
Understanding Database Time (DB Time) and Average Active Sessions (AAS)
DB Time is a fundamental metric that measures the time spent by foreground processes executing database client requests. It’s a critical component of total application response time and provides valuable insights into how your database is performing. By analyzing DB Time, you can identify areas where optimization efforts will have the greatest impact. One key aspect of DB Time is its “fungibility.” This means that it’s directly related to your time as an Oracle database user or application developer. By optimizing DB Time, you’re essentially optimizing your own productivity and efficiency.
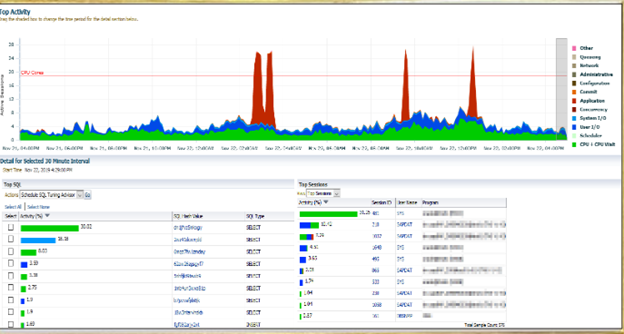
Average Active Sessions (AAS) represents the “velocity” of DB Time. It measures the rate at which active sessions are consuming resources within your database. A rapid increase in AAS indicates a potential performance issue that requires immediate attention. By monitoring AAS over time, you can quickly identify trends and patterns that may indicate underlying problems with your database configuration or application design. This allows you to take proactive steps to address these issues before they become major incidents.
The DB Time Method is a proven approach for optimizing database performance at both system and individual query levels. By understanding how to use this method, you can:
- Identify bottlenecks in your system
- Optimize resource allocation
- Improve query performance
- Enhance overall system efficiency
Tools for Success: ADDM Spotlight, Performance Hub, ASH, and AWR
But how do you put this knowledge into practice? Our webinar will show you how tools like:
- ADDM Spotlight: provides expert analysis and recommendations for improving performance
- Perf Hub: offers real-time monitoring and alerting capabilities
- ASH (Active Session History): provides detailed information on session activity
- AWR (Automatic Workload Repository): stores historical data on workload activity
During this interactive session, you will have a chance to ask questions during our live Q&A session on the topics we cover:
- Introduction to DB Time and AAS
- Understanding the DB Time Method
- Using tools like ADDM Spotlight, Perf Hub, ASH, and AWR for optimization
Who Should Attend?
This webinar is perfect for Database Administrators (DBAs), Performance Tuning Specialists, and IT Professionals interested in optimizing Oracle database performance.
So what does all this mean for enterprise organizations? In short, it means having access to powerful tools that enable data-driven decision-making around database performance optimization.
Don’t wait – Watch the replay today!
Resources
- Observability Insights session replay
- Oracle Database
- Oracle Average Active Sessions
- ADDM Spotlight blog
- Oracle Performance Hub
- Active Session History (ASH) Analytics
- Automatic Workload Repository (AWR) documentation