Guest Author: Heema Satapathy, Oracle ACE
As a guest Author and Oracle Ace, I wanted to share my experience with E-Business Suite and Stack Monitoring. These top 10 tips have helped me expedite monitoring setup and reduced the time to set up monitoring an EBS environment from weeks to hours As an Oracle ACE, I have seen improved metrics in time saved, lower cost to implement, reduced time troubleshooting, and outage prevention. Below is an overview of the tips I have used to be successful with the E-business suite and Stack Monitoring.
Oracle Stack Monitoring is an end-to-end cloud-based monitoring solution for E-Business Suite (EBS); capable of monitoring the entire application stack including hosts, databases (CDBs and PDBs), and EBS components including WebLogic, Concurrent Manager, EBS Forms and Workflow manager. In this blog, I will share 10 tips for discovering and monitoring EBS in Stack Monitoring.
The first step to monitoring an EBS application is discovering the Oracle Database and EBS application using Stack Monitoring’s discovery UI. Once the discovery completes Stack Monitoring immediately begins collecting metrics and creates homepages for EBS and its components. With metrics now collected monitoring the EBS begins using the built-in Enterprise Summary UI and component homepages.
The Status summary region provides an overview of the availability status across all monitored components. The Status by resource type chart displays monitored resources by availability status and resource type or application. The Status by resource type includes host, both OCI Compute and on-premises hosts, App Server which includes Oracle WebLogic both admin and domain servers, and databases, including CDBs and PDBs. Applications such as EBS are represented differently.
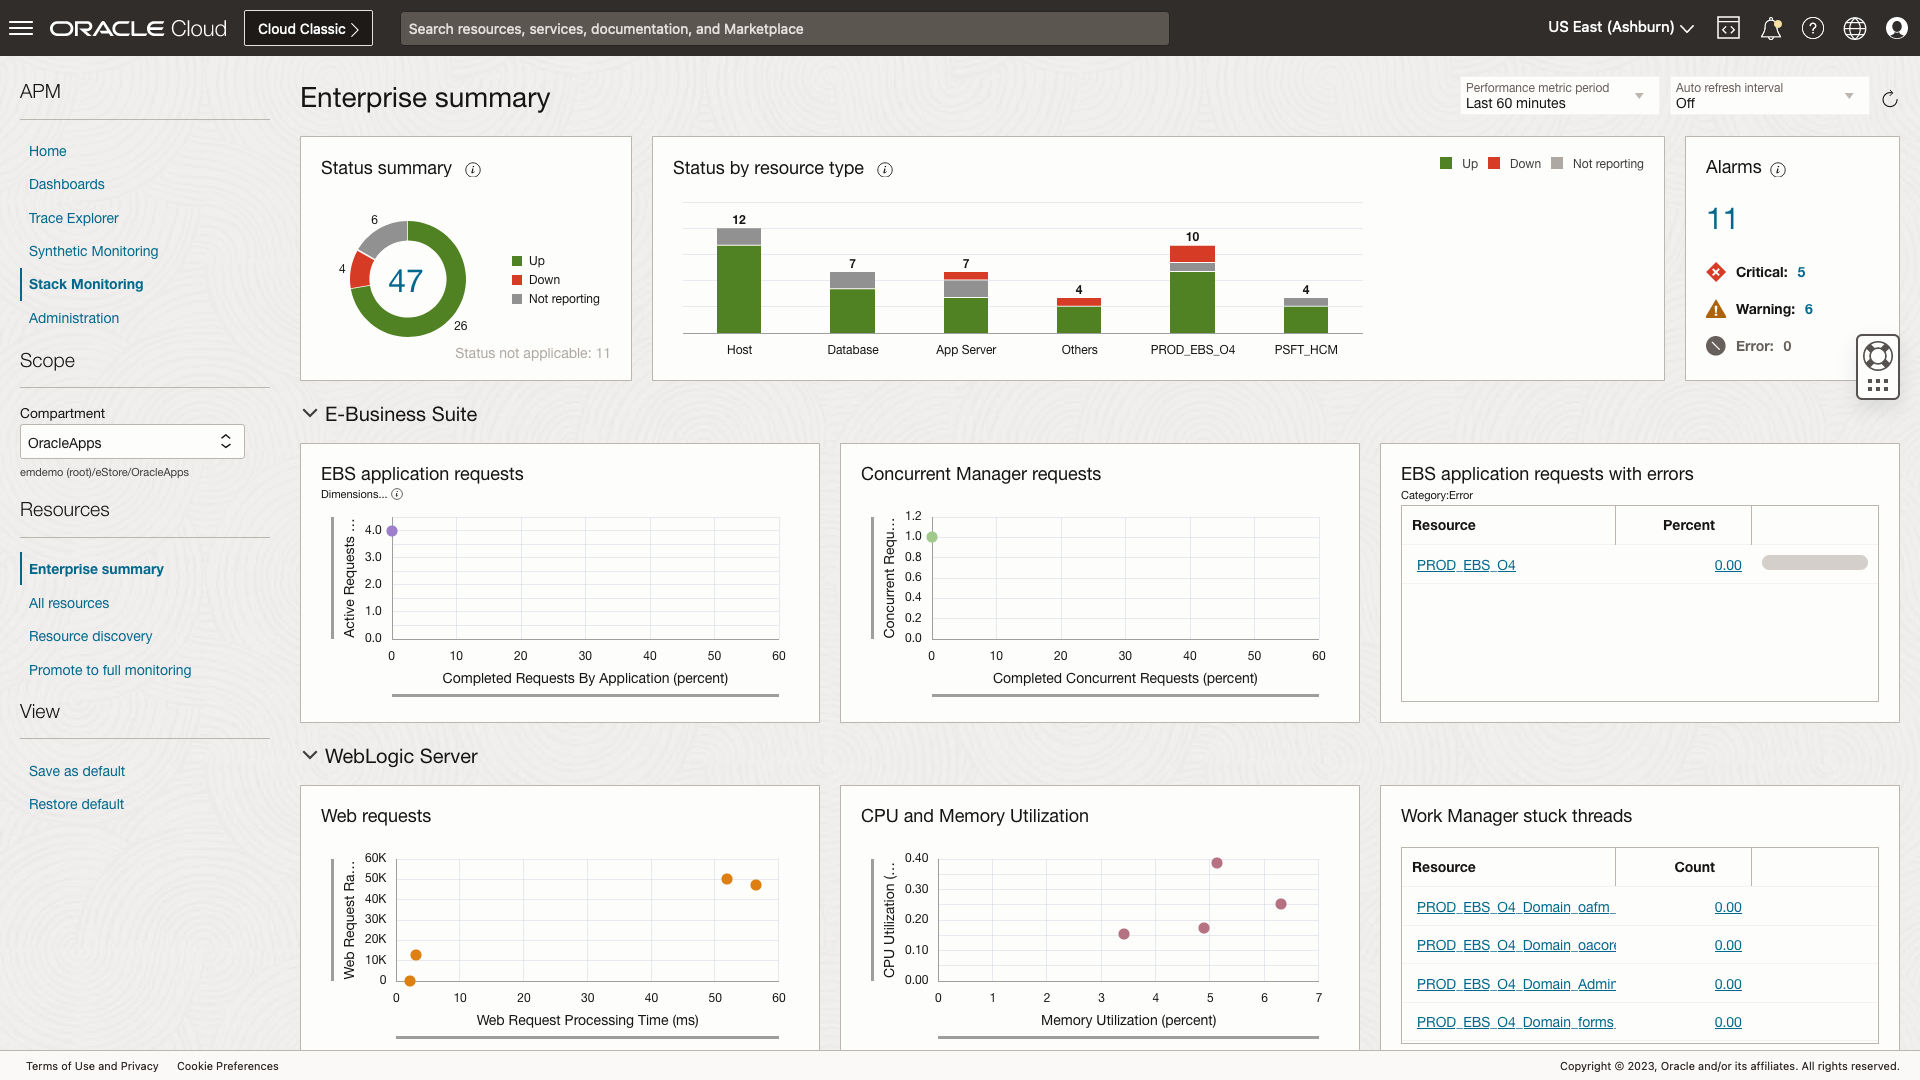
In figure 1 above, we can see the overall availability of the entire EBS application stack. If the EBS bar is fully green, you’ll know all EBS components are up. If the EBS bar contains any red or gray some EBS components have availability issues. Clicking on the bar that represents the EBS application will navigate you to that EBS application’s homepage where you can troubleshoot the EBS application, which includes open alarms, performance, configuration details, and the EBS application topology.
Now that we have reviewed some of the capabilities provided in Stack Monitoring, let me share lessons learned and recommended tips for a successful discovery and monitoring of an EBS application:
- The Oracle Application Management Pack (AMP) licenses are not required for Stack Monitoring. Instead you will find the Stack Monitoring service is priced under APM Stack Monitoring in OCI Observability and Management Services.
- Ensure you follow the Getting Started documentation for steps on creating user and resource groups and policies.
- When running E-Business Suite on OCI computes, ensure the Management Agent is enabled within the Oracle Cloud Agent.
- When running an EBS application on-premises the Management Agent will need to be installed manually. The Management Agent installation key and rpm’s can be easily downloaded from the OCI Console.
- Once the agent is installed, both on-prem or on an OCI Compute, Stack Monitoring will automatically create a job to promote the compute to full monitoring. Simply click the promote link in the Promotion UI, ensure the hostname to be discovered is using the FQDN, and within minutes Stack Monitoring will collect metrics and monitoring begins.
- With the host now being monitored, next discover the Oracle Database where the EBS schema resides.
- Once the Oracle Database has been discovered, ensure all prerequisites are met. For a full set of prerequisites see the Discover E-Business Suite documentation. Here are a few examples:
- Ensure you provide the necessary grants to the database monitoring user.
- Compatibility for database running version 12c or earlier (Set the following parameter in the emd.properties file on both OCA and OMA:dbaas.ALLOWED_LOGON_VERSION = 8). For more information see the documentation.
- EBS profile option for EBS forms (Set Sign-On:Audit Level = FORM and Set AuditTrail:Activate = Yes)
- Configure EBS WebLogic (Verify that Platform Mbeans Used option is enabled in EBS WebLogic Admin Server)
- For more information on configuring MBeans see the documentation.
- The EBS application and Oracle Database can be successfully discovered using DNS names or IPs.
- Once EBS resources has been discovered in Stack Monitoring, the out of box EBS metrics will now be exposed to OCI Monitoring Service.
- Creating alarms is easy! Simply navigate to the OCI console menu, then: OBSERVABILITY > MONITORINING > ALARM DEFINITIONS > CREATE ALARM to create alarms for these metrics.
- Stack Monitoring provides a list of recommended alarm rules, review the documentation for more details: recommended alarm rules.
Stack Monitoring provides an “all in one” platform to monitor hosts, databases, and EBS application and its components. Once discovered, metrics are collected immediately, and is simple to create meaningful alarms. Stack Monitoring graphs not only help Application DBAs/Developers get a peak on the E-Business Suite Application, database, and component health, but also helps IT management get information on the operational growth for business planning.
Oracle offers a free cloud trial so you can try our Oracle APM Stack Monitoring yourself.
Heema is an Oracle ACE Pro working as Manager, Infrastructure and Cloud Solutions at Computer Technology Resources, Inc (Oracle Partner Applications Software Technology) and oversees a team of Infrastructure and Cloud Experts performing complex upgrades and migrations to various cloud flavors including but not limited to OCI, AWS, Azure. She is a seasoned IT professional having worked worldwide – India, Japan, Malaysia, Singapore, Switzerland, and USA.
Home Page
Oracle Community
https://community.oracle.com/tech/developers/profile/Heema%20Satapathy
Cloud Customer Connect
https://community.oracle.com/people/Heema+Satapathy?view=profile&qProg=true
Oracle ACE program