In the dynamic world of mobile app development, leveraging powerful tools is key to enhancing performance and gaining valuable insights. One such tool making waves in observability is OpenTelemetry. This blog is a quick guide on how to integrate OpenTelemetry into your iOS applications. To begin, it’s crucial to understand that OpenTelemetry is a valuable addition to your iOS projects and simplifies the collection and export of telemetry data, offering a standardized approach across various programming languages.
By combining OpenTelemetry with a modern, cloud-based monitoring solution such as Oracle Cloud Infrastructure Application Performance Monitoring (OCI APM) you get strong visualization, advanced analytics, and a user-friendly interface to accelerate identification, resolution, and decision-making for optimizing system efficiency and user experience. Developers and operations teams gain a holistic view of application performance, leading to more effective troubleshooting, optimization, and overall improvement of software systems.
As we proceed, this guide walks through fundamental steps, including setting up the iOS environment, instrumenting code with OpenTelemetry, and visualizing the collected data. In just a few steps, build the foundation to seamlessly integrate OpenTelemetry into your app.
Requirements to integrate OpenTelemetry into the app:
- Mac
- An Oracle APM domain in OCI – Create an Oracle APM domain using these instructions.
Xcode development environment
First, declare the OpenTelemetry package in the Package.swift file by adding this line.
.package(URL: "https://github.com/open-telemetry/opentelemetry-swift", from: "1.0.0"),
Or by adding it in Xcode:
- Go to File, then Add Packages…
- Enter the URL “https://github.com/open-telemetry/opentelemetry-swift‘ in the search box
- Press Add package.
Also, add the OpenTelemetryApi, OpenTelemetrySdk, URLSessionInstrumentation, and OpenTelemetryProtocolExporterHTTP dependencies to your project.
Note: Add only these dependencies to the package, other dependencies could cause unexpected errors.
Initial steps to use OpenTelemetry with iOS configuration
To be able to use OpenTelemetry with iOS, this initial configuration is required:
- First, create a class to hold the configuration. Let’s call it “TraceManager”.
- Inside its initializer, put the following configuration code:
- Remember to update the endpoint and data key
// Setting up the endpoint URL
let endpoint = URL(string: "https://<dataUploadEndpoint>/20200101/opentelemetry/public/v1/traces")!

// Configuring the dataKey
let configuration = URLSessionConfiguration.default
configuration.httpAdditionalHeaders = ["Authorization": "dataKey <Your data key>"]
let session = URLSession(configuration: configuration)

// Creating the span exporter
let spanExporter = OtlpHttpTraceExporter(endpoint: endpoint, useSession: session)

// Setting up attributes
let attributes: [String: AttributeValue] = [
    "service.name": AttributeValue.string("IOS-APP"),
    "service.version": AttributeValue.string("1.0"),
    "deployment.environment": AttributeValue.string("production"),
    "telemetry.sdk.name": AttributeValue.string("opentelemetry"),
    "telemetry.sdk.language": AttributeValue.string("swift"),
    "telemetry.sdk.version": AttributeValue.string("1.6.0") // Make sure to use the SDK version in your project
]
let resource = Resource(attributes: attributes)

// Registering the trace exporter with the desired configuration
OpenTelemetry.registerTracerProvider(tracerProvider: TracerProviderBuilder()
    .add(spanProcessor: SimpleSpanProcessor(spanExporter: spanExporter))
    .with(resource: resource)
    .build())
Put the configuration in the initializer of the class and then create a static field “shared” in that class like so:
class TraceManager {
    static let shared = TraceManager()

    init() {
    // configuration here
    }
}
That shared field can be called in initializer for your application to apply the configuration:
init() {
    _ = TraceManager.shared
}
Sample app to test basic instumentation
For this section, we are using this sample app to test the OTel instrumentation.
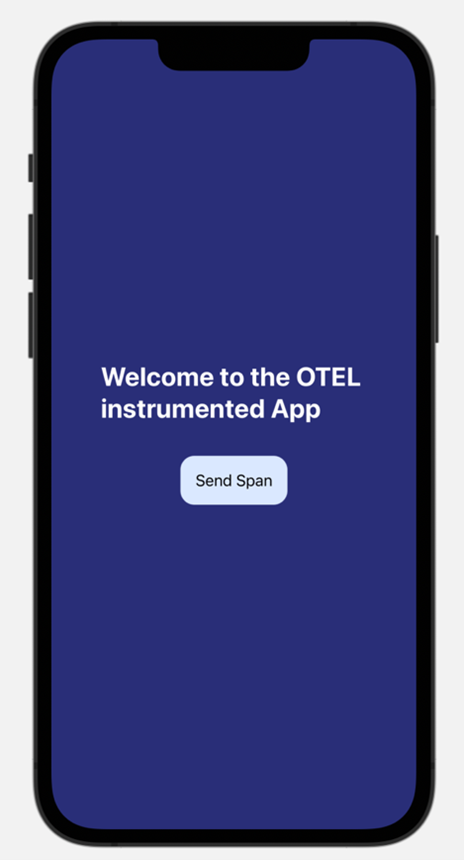
When clicking the “Send Span” button, it should send a span to the endpoint configured earlier.
To send the monitoring data, spans need to be sent within traces, and to send those we need to get a trace provider, we can get it using this line:
let  tracer = OpenTelemetry.instance.tracerProvider
        .get(instrumentationName: "instrumentation-library-name", instrumentationVersion:
        "1.0.0")
To send the spans, you need to start it, add whatever attribute is required for that specific span, and finally end it:
let span = tracer.spanBuilder(spanName: "default name").startSpan()
span.setAttribute(key: "Custom attribute", value: "value")
span.end()
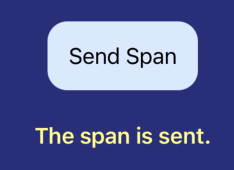
Envelope this in a function and then call it when clicking the button. So, when pressed, small text is returned.
Check in the APM trace explorer to review the span:

Instrumentation of HTTP requests (URLSession)
To instrument the HTTP requests, add this configuration to our configuration from earlier:
sessionConfiguration = URLSessionInstrumentationConfiguration(shouldInstrument: { request in

    // Only instrument legitamet API calls and not the calls to the APM collector

    if request.url?.host() == endpoint.host() {

        return false

    }

    return true

}, nameSpan: { request in

    // sets the name of the span to the relative path of the URL

    return request.url?.path().split(separator: "/").last?.lowercased()

}, injectCustomHeaders: { request, span in

    // This section is for injecting headers, we are injecting X-B3 headers to enable context propagation

    if request.url?.host() == endpoint.host() {

        return

    }

    request.setValue(span!.context.traceId.hexString, forHTTPHeaderField: "X-B3-TraceId")

    request.setValue(span!.context.spanId.hexString, forHTTPHeaderField: "X-B3-SpanId")

}) { _, span in

    // this section is for adding attributes, we are adding the HttpStatusCode attribute

    span.setAttribute(key: "HttpStatusCode", value: 200)

} receivedError: { _, _, status, span in

    span.setAttribute(key: "HttpStatusCode", value: status)

}
To test this, a different application that sends out HTTP requests through URLSession is required, in this case, we will use the following WineStore app:

This app makes a call to the Winestore backend to get the list of wines, and with the configuration enabled, we see the trace coming through in the trace explorer:

Since context propagation is enabled, we can see that the trace contains all the connected spans inside:

This blog explored how to integrate OpenTelemetry into an iOS app. We started by seeing why OpenTelemetry matters, giving a standardized way to collect data about how your app is doing. We reviewed the steps to set it up in your iOS environment, how to send a simple span, and how to instrument the entirety of the HTTP calls. You are ready to find and fix issues, make apps run even smoother for users, and make iOS apps awesome! Add this to your next project.
Resources
- Application Performance Monitoring
- OpenTelemetry-Swift documentation
- Blog: Application Monitoring with OpenTelemetry