A sudden expiration of a database schema password can impact production applications and result in a business outage. This blog describes how Oracle Enterprise Manager can be used to alert you in advance, so business and customers are not impacted.
The Enterprise Manager (EM) Database Plugin includes the Monitoring User Expiry metric that monitors the expiry date of the database monitoring user (e.g. dbsnmp) password. By default, this metric raises a “Warning” alert when the password of this user is expiring within 3 days (72 hours).
Follow along as we show you how you can use the EM Metric Extensions feature to create a similar metric for monitoring the password expiry date of any database user and raise “Warning” or “Critical” alerts based on the remaining time to expiration.
The Database User Expiry metric is essential for schemas that support business-critical applications. For such schemas, some administrators may set a custom profile where the password lifetime is set to unlimited. However, in instances where a security policy is in place that prohibits setting an unlimited password lifetime, follow the steps below to ensure you do not get caught off-guard with a password expiring unexpectedly.
Note: The Metric Extensions feature is licensed under the Oracle Diagnostics Pack.
Overview of Setting up Metric Extensions for Monitoring Password Expiry Dates in EM
You will be creating two metric extensions, one for “Expiring Schemas”, and one for “Expiring Schema List”. You will create those for “Pluggable Database” target type. You can use the same process to create these metric extensions for “Database Instance” and “Cluster Database” target types if needed.
1) For the Expiring Schemas Metric Extension
This Metric Extension will check the database for schemas whose passwords are about to expire within the next two weeks, have already expired, or have expired but are in a grace period. A composite code will be returned between 0 and 3, where code:
0: Means there are no schemas that meet the criteria
1: There are schemas where the password is expiring in over a week but less than two weeks
2: There are schemas where the password is expiring within one week, already expired, or in a grace period
3: There are schemas that meet the previous two conditions
The metric extension raises a Warning alert if the result code is 1, and a Critical alert if the result code is either 2 or 3. You can add it to a monitoring template that is applied to the target databases. The implementation section below describes notification on the metric extension.
2) For the Expiring Schema List Metric Extension
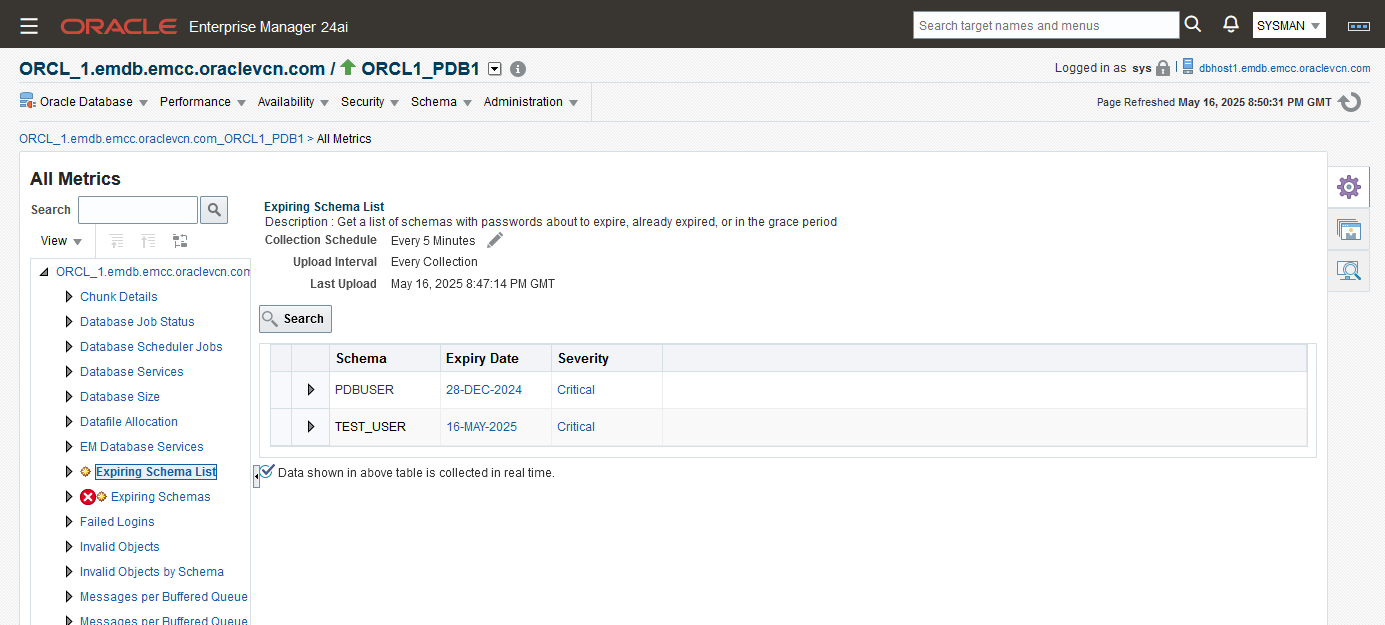
This Metric Extension will return a list of schemas whose passwords are about to expire within the next two weeks, have already expired, or have expired but are in a grace period. It also returns the password expiration date and a severity code of “Warning” or “Critical” as appropriate.
Note: The account status of a database user or schema can have one of the following values:
- OPEN
- EXPIRED
- EXPIRED(GRACE)
- LOCKED(TIMED)
- LOCKED
- EXPIRED & LOCKED(TIMED)
- EXPIRED(GRACE) & LOCKED(TIMED)
- EXPIRED & LOCKED
- EXPIRED(GRACE) & LOCKED
For this blog, we’re looking at the first three values (OPEN, EXPIRED, EXPIRED(GRACE)) only as we’re assuming that locked accounts were locked for a legitimate reason. To check for such conditions, you can modify the “Where” clause for the SQL statements below accordingly.
How to Implement Metric Extensions for Monitoring Password Expiry Dates in EM
Now, let’s implement the Metric Extensions:
1) Expiring Schemas
In Enterprise Manager console, navigate to “Enterprise”->”Monitoring”->”Metric Extensions”
- Click “Create”->”Metric Extension”
- Target Type: “Pluggable Database”
- Name: Expiring_Schemas
- Display Name: Expiring Schemas
- Adapter: SQL
- Description: Determine if there are schemas with passwords about to expire, already expired, or in grace period.
- Collection Frequency: By Days
- Repeat Every: 1 Day
- Click Next
- On the Adapter Screen: SQL Query:
select sum(SEVERITY * SIGN(COUNT)) as RESULT_CODE from (
  select 1 as SEVERITY, count(*) as COUNT
  from dba_users
  where common='NO' and account_status = 'OPEN' and (expiry_date > sysdate+7) and (expiry_date <= sysdate+14)
  union
  select 2 as SEVERITY, count(*) as COUNT
  from dba_users
  where common='NO' and ((account_status = 'OPEN' and (expiry_date <= sysdate+7)) or account_status in ('EXPIRED(GRACE)','EXPIRED'))
)- Click Next
- On the Columns Screen:
- Click “Add”->”New Metric Column”
- Name: RESULT_CODE
- Display Name: Result Code
- Type: Data Column
- Value Type: Number
- Category: Availability (You can also choose a different value, or leave it blank)
- Under “Alert Threshold”:
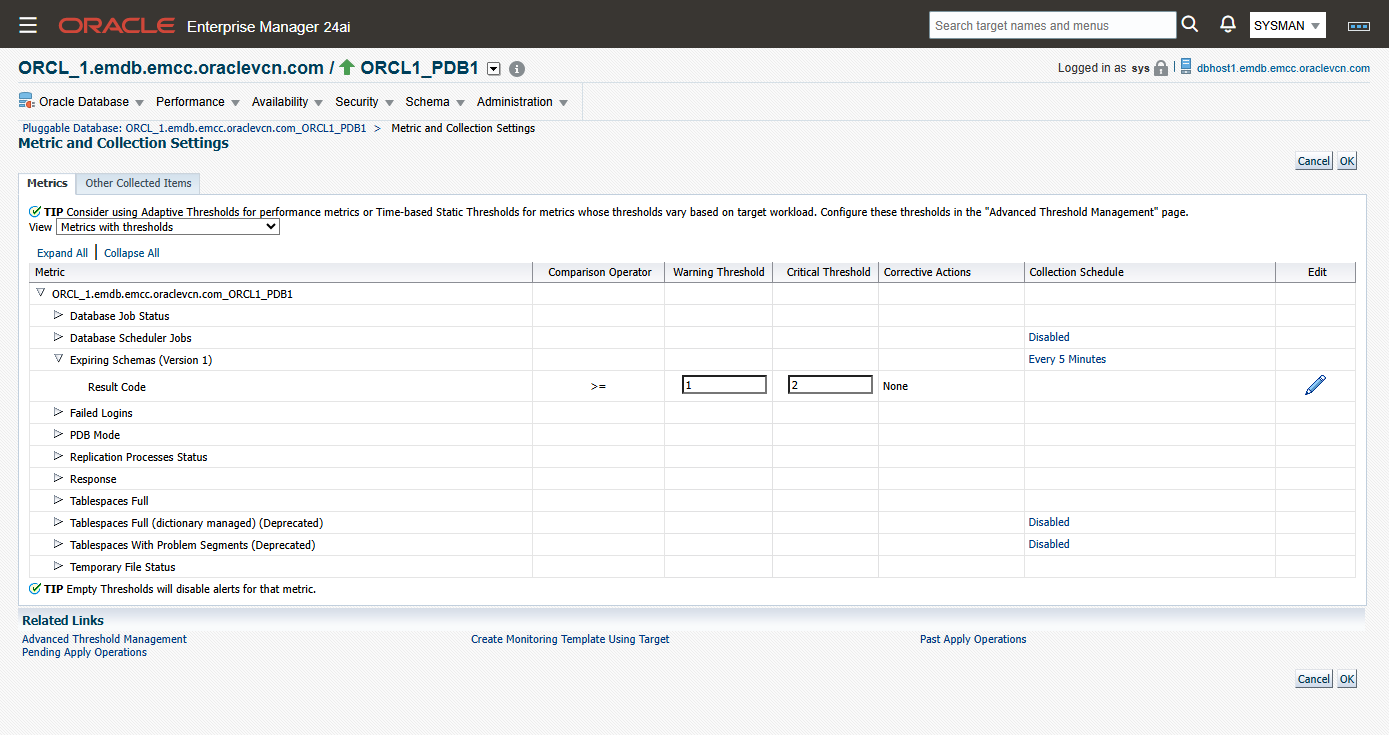
- Comparison Operator: >=
- Warning: 1, Critical: 2
- Alert Message: The value of %columnName% is %value% (A value of 1 means passwords are expiring within two weeks. 2 means passwords are expiring within one week, already expired, or in a grace period. 3 means passwords are matching both conditions)
- Click OK
- Click Next
- On the Credentials screen, click Next
- On the Test screen, select a database to test, then click “Run Test”. If there are errors, verify the previous steps and fix the error, otherwise, click Next
- Click Finish
Highlight the row of the newly created metric extension and click “Action”->”Save as Deployable Draft”. With the row still highlighted, click “Deploy to Targets”. Add a target PDB and click “Submit”. After a minute or so, navigate to the PDB target homepage. In the database menu, navigate to “Monitoring”->”All Metrics” and verify the “Expiring Schemas” metric is listed. You can now return to the Metric Extensions screen, highlight the row and click “Action”->”Publish Metric Extension”.
As a best practice, add the metric extension(s) to a monitoring template that is being applied to the target databases. Refer to “Using Monitoring Templates” in the Enterprise Manager Administrator’s Guide for details.
.
Get notified when the newly created metric crosses the Warning threshold
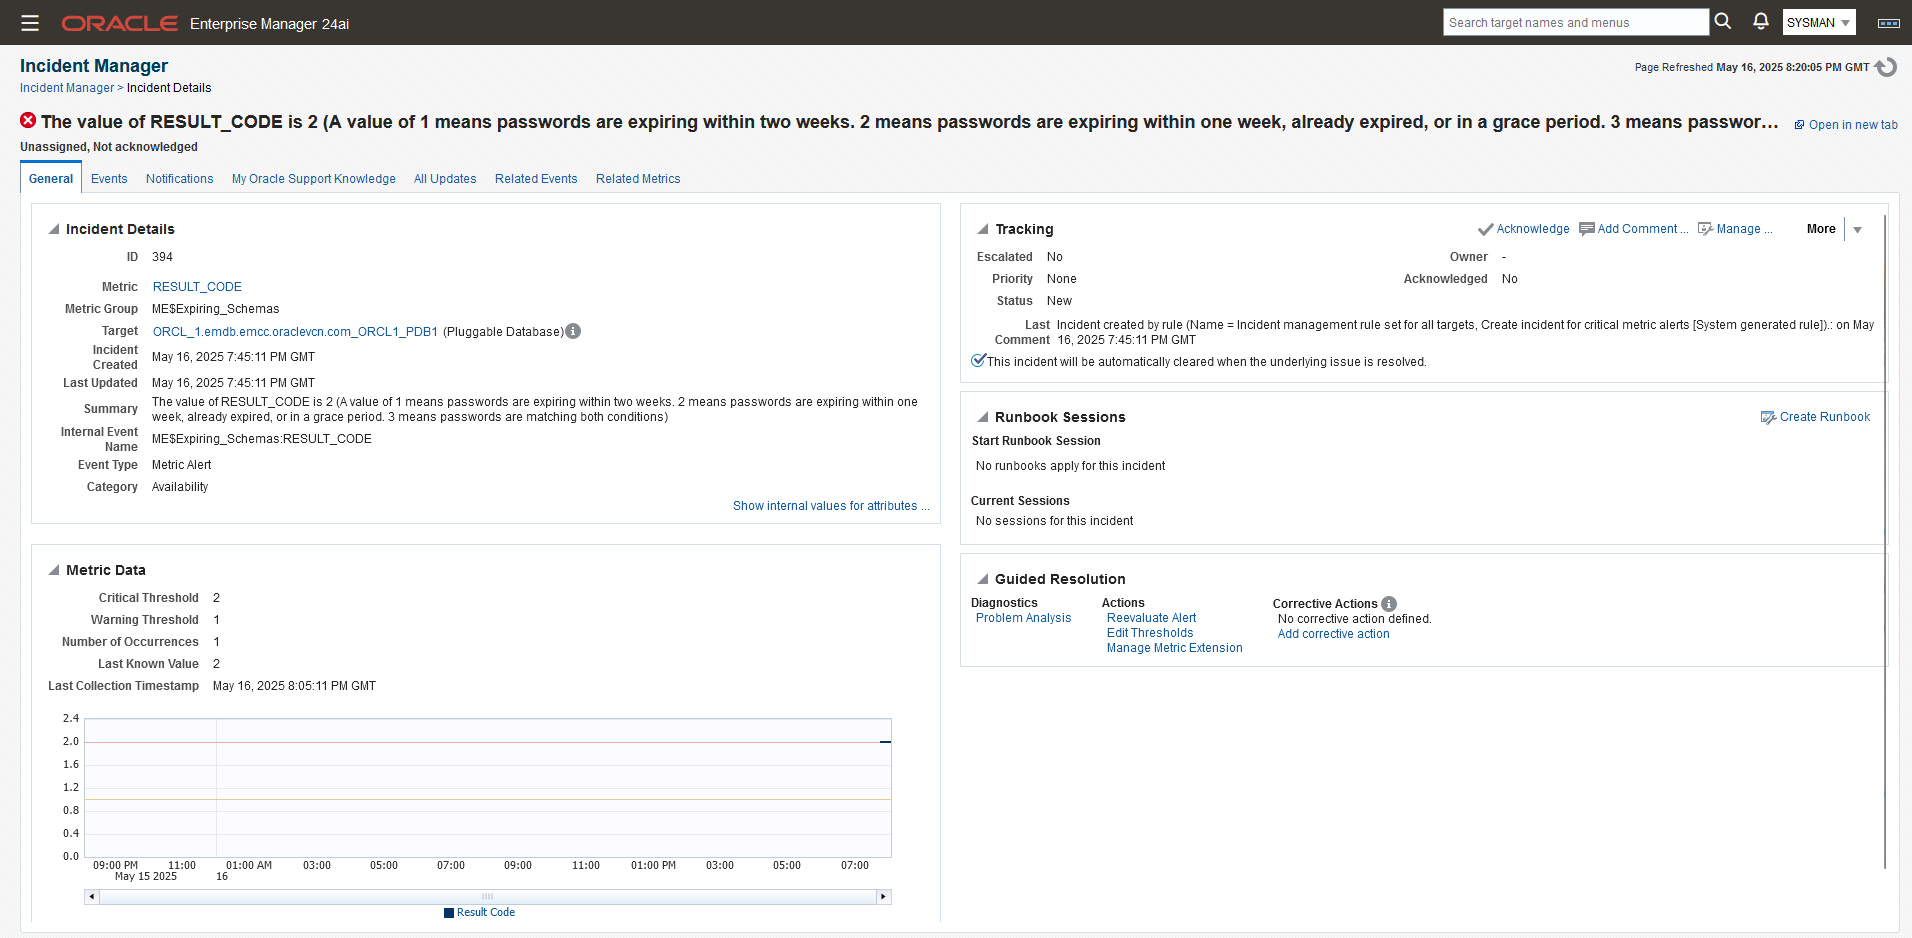
The default incident rule set in EM (“Incident management rule set for all targets”) contains a rule (“Create incident for critical metric alerts”) that creates an incident for all critical metric alerts. Most likely you have already subscribed to this rule to get email notification. If so, you will be notified whenever the value for this metric crosses the Critical threshold.
To get notified when the metric crosses the Warning threshold, create a new rule in a custom ruleset (since the default rule set cannot be edited). The new rule can also be used to send an additional notification on Critical alerts (even though it is already covered by the default rule set). For example, to send an additional notification to a separate email address not included in the default rule.
Assuming a custom ruleset was created that applies to all applicable targets, or at least to PDB targets, edit the ruleset:
- Under “Rules”, click “Create”
- In the pop-up window “Select Type of Rule to Create”, accept the default and click Continue
- On the next screen “Create New Rule: Select Events”, keep the selected options: “Metric Alert” -> “Specific events of type Metric Alert”
- Click Add
- On the pop-up window “Select Specific Metric Alert”, select:
- Target Type: “Pluggable Database”
- Metric Name: Result Code
- Click Search
- Select the “Expiring Schemas/Result Code” metric
- Select Severity levels “Critical” and “Warning”. You can also select “Clear” if needed
- Click OK
- Click Next
- On the “Add Actions” Screen, click Add
- Under “Conditions for Action” leave it at default “Always execute the actions”, to execute the same action (e.g., send a notification to the same email addresses for both Critical and Warning alerts). Otherwise, choose the second option “Only execute the actions if specified conditions match” to execute different actions for Critical and Warning alerts
- Under “Send Notifications” enter the required email addresses or EM Administrator ID(s) under Basic Notifications
- Click Continue
- Enter a name for the rule, e.g., “Rule to send a notification when there are schema passwords about to expire, expired, or expired but in grace period”
- Click Continue, then “Save”
2) Expiring Schema List
In Enterprise Manager console, navigate to “Enterprise”->”Monitoring”->”Metric Extensions”
- Click “Create”->”Metric Extension”
- Target Type: “Pluggable Database”
- Name: Expiring_Schema_List
- Display Name: Expiring Schema List
- Adapter: SQL
- Description: Get a list of schemas with passwords about to expire, already expired, or in the grace period
- Collection Frequency: By Days
- Repeat Every: 1 Day
- Click Next
- On the Adapter Screen: SQL Query:
Select SEVERITY, USERNAME, EXPIRY_DATE from (
  select 'Warning' as SEVERITY, username, to_char(expiry_date,'DD-MON-YYYY') as EXPIRY_DATE
  from dba_users
  where common='NO' and account_status = 'OPEN' and (expiry_date > sysdate+7) and (expiry_date <= sysdate+14)
  union
  select 'Critical' as SEVERITY, username, to_char(expiry_date,'DD-MON-YYYY') as EXPIRY_DATE
  from dba_users
  where common='NO' and ((account_status = 'OPEN' and (expiry_date <= sysdate+7)) or account_status in ('EXPIRED(GRACE)','EXPIRED'))
)
- Click Next
- On the Columns Screen:
- Click “Add”->”New Metric Column”
- Name: SEVERITY
- Display Name: Severity
- Type: Data Column
- Value Type: String
- Category: Availability (You can also use “Other” or even leave it blank)
- Click OK
- Click “Add”->”New Metric Column”
- Name: USERNAME
- Display Name: Schema
- Type: Key Column
- Value Type: String
- Click OK
- Click “Add”->”New Metric Column”
- Name: EXPIRY_DATE
- Display Name: Expiry Date
- Type: Data Column
- Value Type: String
- Category: Availability (You can also use “Other” or even leave it blank)
- Click OK
- Click Next
- On the Credentials screen, click Next
- On the Test screen, select a PDB to test, then click “Run Test”. If there are errors, verify the previous steps and fix the error, otherwise, click Next
- Click Finish
- Highlight the row of the newly created metric extension and click “Action”->”Save as Deployable Draft”. With the row still highlighted, click “Deploy to Targets”. Add the target database(s) and click “Submit”. After a minute or so, navigate to the PDB target homepage. In the database menu, navigate to “Monitoring”->”All Metrics” and verify the “Expiring Schema List” metric is listed. You can now return to the Metric Extensions screen, highlight the row and click “Action”->”Publish Metric Extension”.
As a best practice, add the metric extension(s) to a monitoring template that is being applied to the target databases. Refer to “Using Monitoring Templates” in the Enterprise Manager Administrator’s Guide for details on how to do this.
Reporting on the Expiring Schema
To create reports on the Expiring Schema List metric from the Enterprise Manager repository, use the following query:
select
  target_name as database,
  key_value as schema,
  MAX(DECODE(column_label,'Severity',value,null)) as Severity,
  MAX(DECODE(column_label,'Expiry Date',value,null)) as Expiry_Date
from MGMT$METRIC_CURRENT
where metric_name = 'ME$Expiring_Schema_List'
GROUP BY target_name, key_value
ORDER BY database, schema| DATABASE | SCHEMA | SEVERITY | EXPIRY_DATE |
|---|---|---|---|
| ORCL_1.emdb.emcc.oraclevcn.com_ORCL1_PDB1 | PDBUSER | Critical | 28-DEC-2024 |
| ORCL_1.emdb.emcc.oraclevcn.com_ORCL1_PDB1 | TEST_USER | Critical | 16-MAY-2025 |
Summary
As a sudden expiration of a database schema password can cause a significant outage in production applications, this post describes how Enterprise Manager can be used to alert in advance so corrective measures can be taken before there is a problem.
For the use case where the database monitoring user (DBSNMP) password lifetime is set to unlimited, but the policy requires changing the password for that user on a regular basis (e.g. annually), please see “More secure and efficient: Changing DBSNMP password using automation“.
- For more information on metric extensions, see the documentation on Using Metric Extensions
- For more information on monitoring templates, see the documentation on Using Monitoring Templates
- For more information on the database plugin metrics, see the Oracle Database Metric Reference Manual
Did you know?
![]() Oracle LiveLabs gives you access to Oracle tools and technologies to run a wide variety of labs and workshops. Experience Oracle’s best technology, live!
Oracle LiveLabs gives you access to Oracle tools and technologies to run a wide variety of labs and workshops. Experience Oracle’s best technology, live!
Resources
- Enterprise Manager Landing Page: Oracle Enterprise Manager
- Product Documentation: Oracle Enterprise Manager 24.1
- Oracle Observability and Management Blogs: Observability and Management