Dashboard contributors: Shweta Phabba, Ganesh Ramakrishnan, Swapnil Sinvhal, Curtis Dinkel, Jony Safi.
Oracle Enterprise Manager App for Grafana 4.0 comes with Exadata and Exadata Cloud Capacity dashboards. These dashboards are designed to help database administrators monitor and manage their Exadata infrastructure capacity to ensure optimal performance and resource utilization. The dashboard provides real-time and historic insights into the usage and capacity of various components of the Exadata system, such as storage, CPU, memory, I/O, and network.
The targets supported by these dashboards include Oracle Exadata Database Machine, Oracle Exadata Cloud Service, and related targets.
This blog explores the key features of these dashboards and how database administrators can identify potential bottlenecks, minimize downtime, and improve overall efficiency.

Oracle Exadata Storage Capacity Planning in Grafana
Proper storage capacity planning is crucial to ensure that the system has enough resources to handle the workload and provide optimal performance. Insufficient storage capacity can have significant impacts on system performance, leading to slower query response times, while over-provisioned storage capacity leads to underutilization of resources, increasing hardware costs.
For technical architecture details, refer to Oracle Exadata Database Machine Technical Architecture.
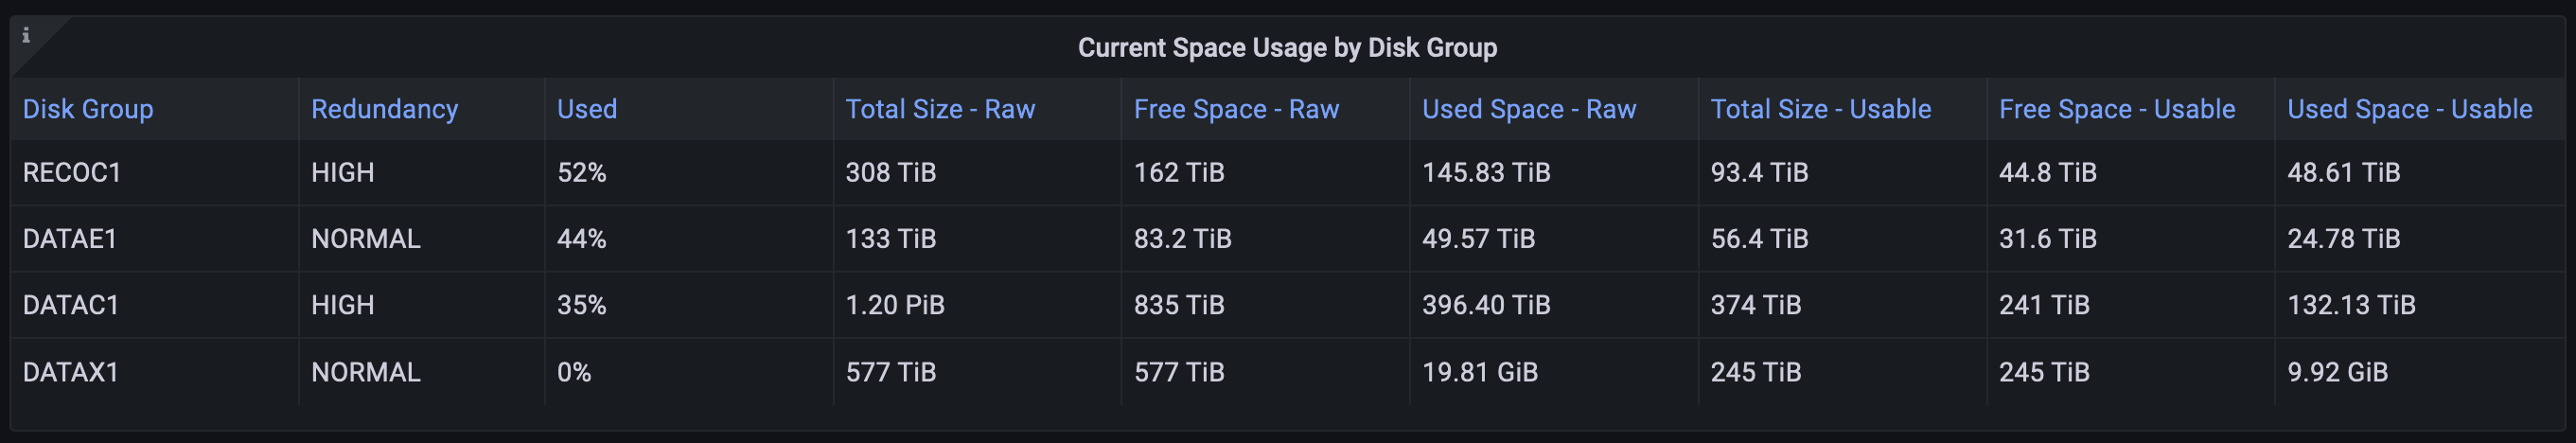
Use the “Current Space Usage by Disk Group” panel to review the Oracle Automatic Storage Management (ASM) disk groups and their capacity. When a disk group is created, it is given a name and a set of attributes that define how the storage is managed. These attributes include the redundancy level (such as Normal or High), the stripe size, and the size of the allocation unit. Once a disk group is created, it can be used to store database files such as data files, control files, and redo logs. ASM is used to manage the disk groups and to provide features such as data striping, mirroring, and automatic rebalancing to ensure a high level of redundancy, fault tolerance, and flexibility.
The raw and usable space data shown in the screenshot below, and the next “Historical Space Usage” panel provide an overview of how the available raw space is used. Raw storage refers to the total amount of physical storage that is available on the disks in the system. (The “Used” column is the % of total raw space used). Usable storage, on the other hand, refers to the amount of storage that is available for databases to use after subtracting the storage required to restore full redundancy when one or more disks fail. A higher redundancy level of the disk group leaves less usable space in the disk group, increasing the difference between the available and usable raw space.
For more information about ASM with Exadata, refer to Administering Oracle ASM on Exadata.
Disk groups can be used for various purposes. For example, in the screenshot below:
- RECOC1 disk group stores the flashback logs, archived logs, and the Fast Recovery Area (FRA) data.
- DATAC1 disk group stores user data for Oracle databases running on the Exadata system (user data includes data files, indexes, and other database objects that are created by the database users).
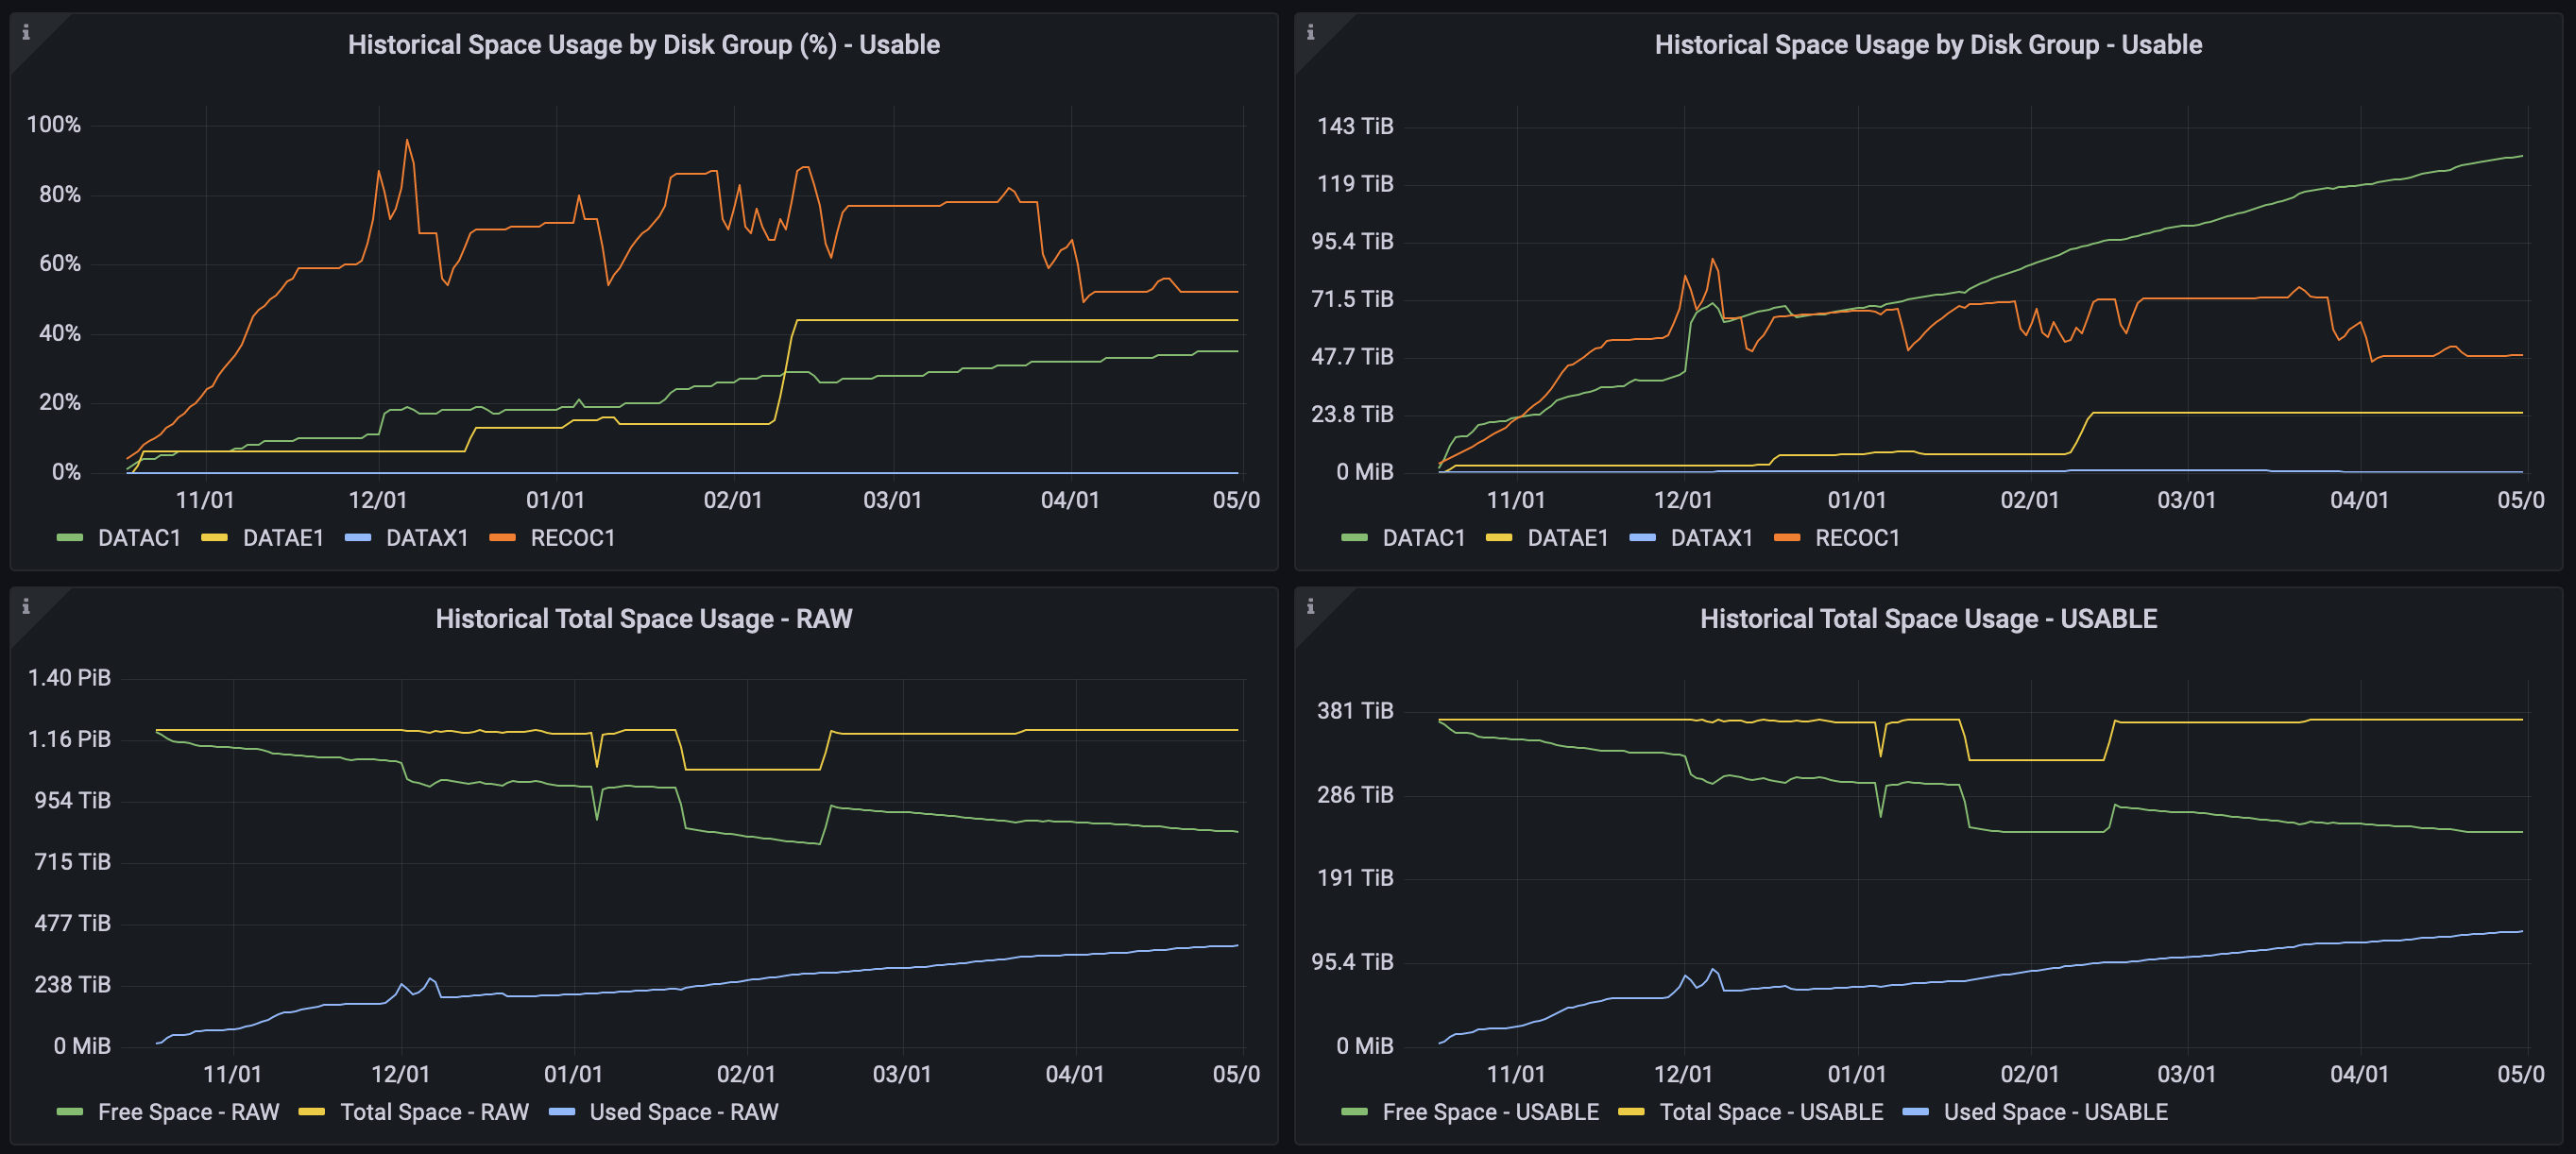
Use the “Historical Space Usage by Disk Group” to review the rate of growth to better understand how much storage space will be needed in the future. This helps with capacity planning and ensures that there is enough storage available to support the growing needs of the system.
Use the “Historical Space Usage by the Top 5 Databases” panel to review the space used by the top 5 databases in the system over the selected period.
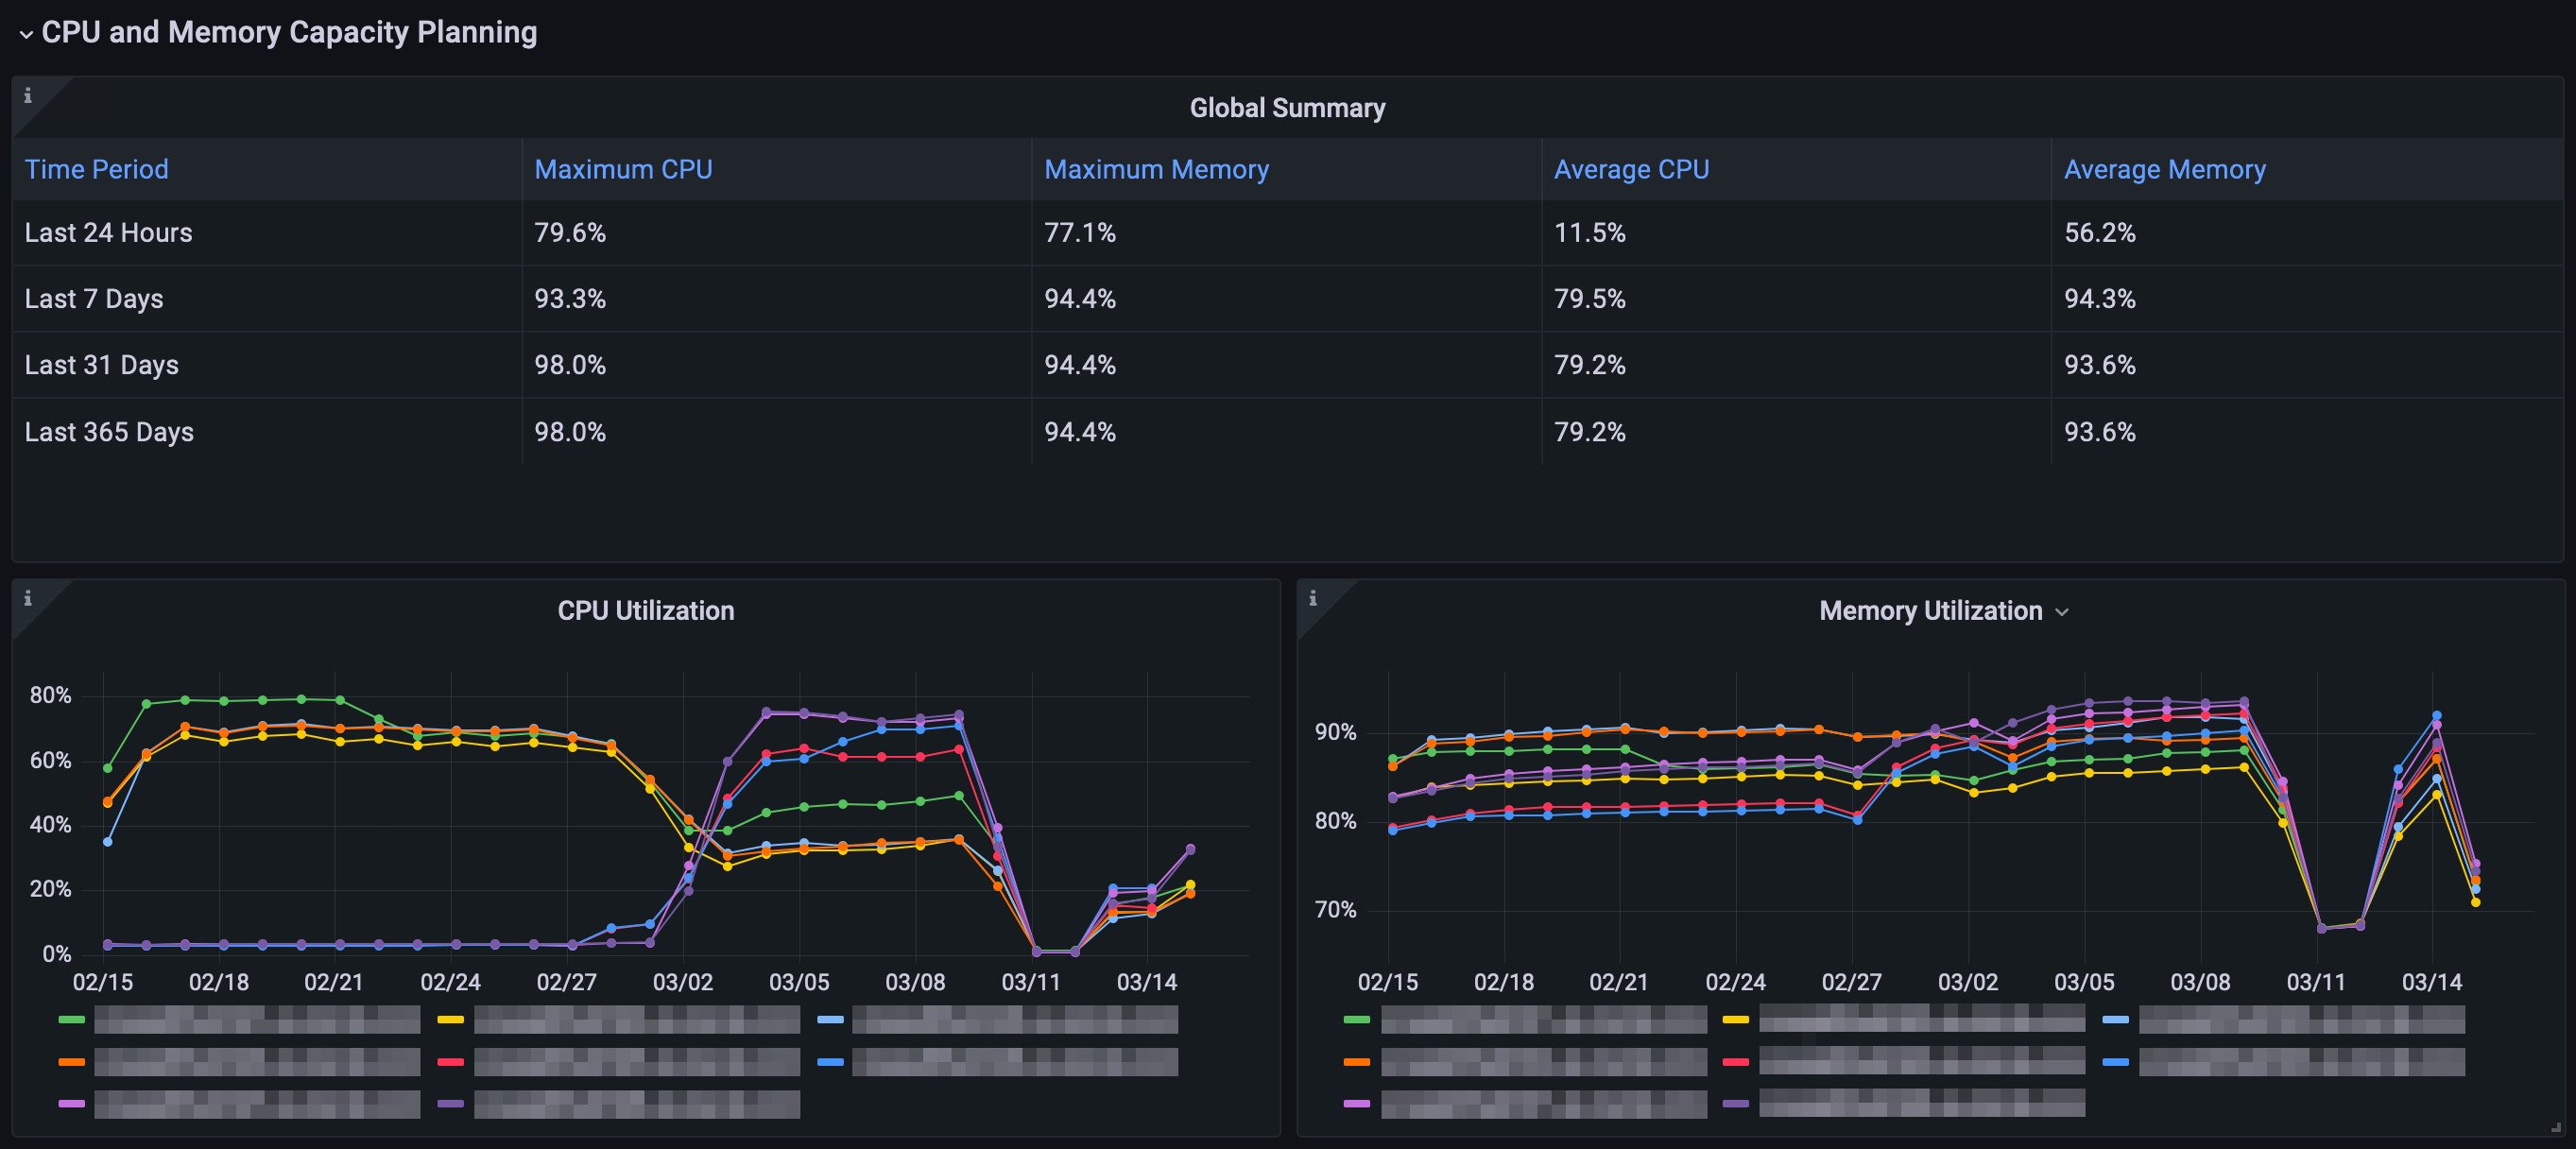
Oracle Exadata CPU and Memory Capacity Planning in Grafana
Database servers’ CPU and memory utilization can indicate if the allocated resources are sufficient to support the database workload. These are critical resources that have a significant impact on the performance and scalability of the system. By ensuring sufficient compute and memory capacity, the system will be able to support demanding database workloads and deliver better performance. For more information, refer to Database Server Hardware Components.
Oracle Exadata I/O Capacity Planning in Grafana
Review the storage I/O metrics below to identify the utilization pattern over time. Proper storage I/O capacity monitoring and planning ensures optimal performance outcomes for application workload.
IOPS and throughput characterize the number and size of I/O requests. Utilization and load indicate how busy the I/O subsystem is. Response time measures how quickly I/O requests are satisfied.
For more information, refer to Managing I/O Resources.
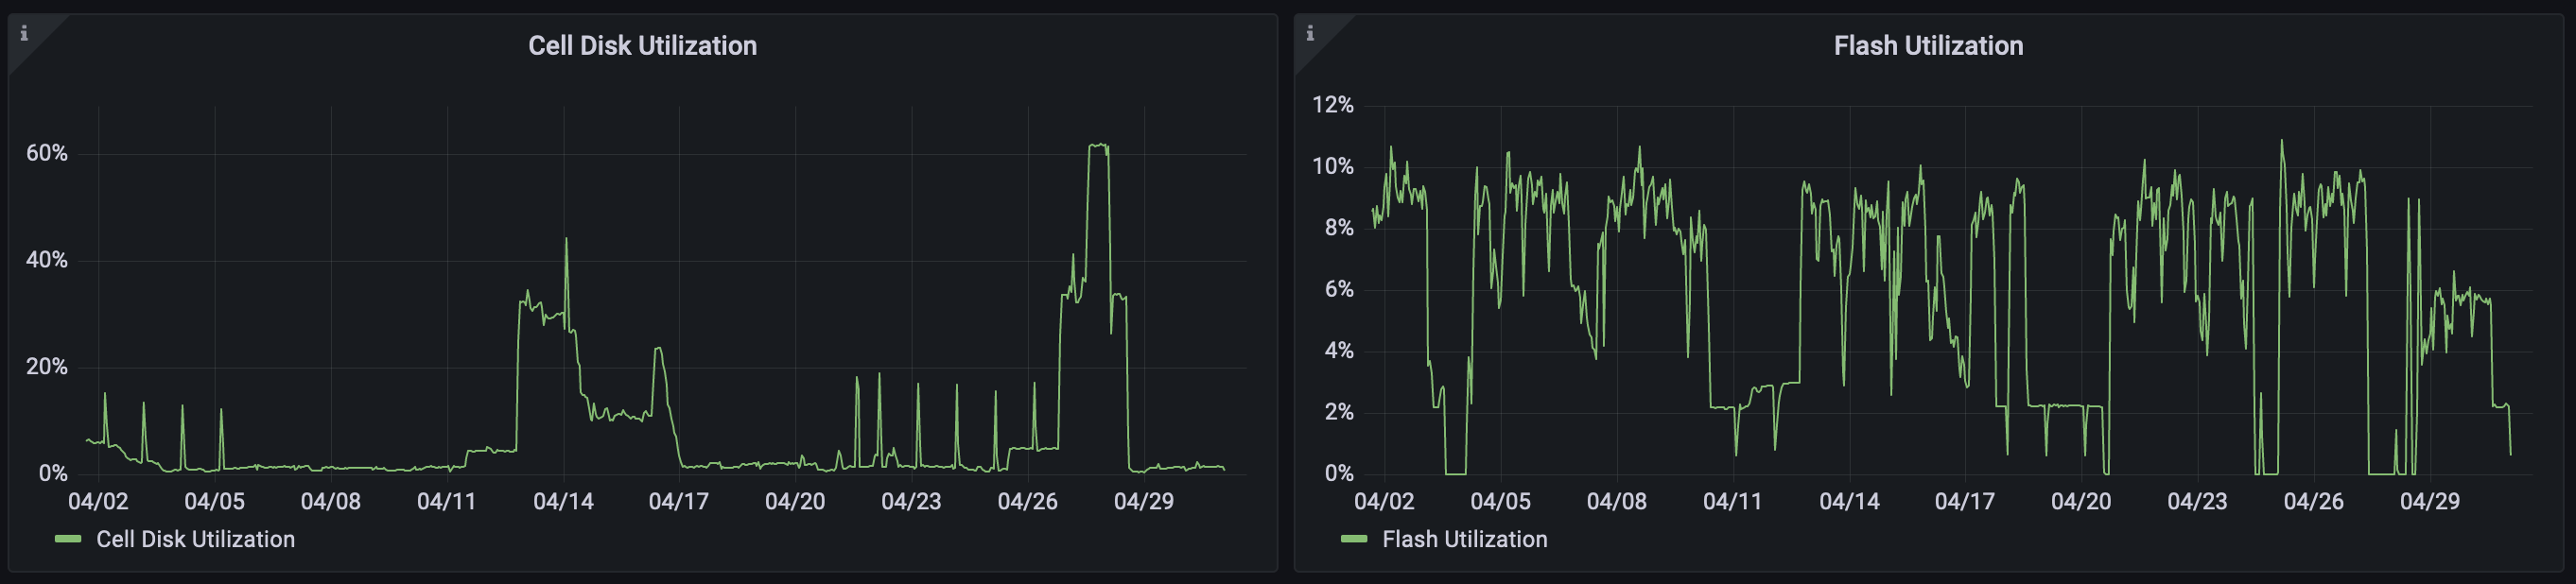
Disk and Flash Utilization
Analyzing the utilization of disk and flash helps to understand how the storage is being used and whether it is meeting the needs of the system. Oracle Exadata typically uses a disk to store a large amount of infrequently accessed data and flash for storing frequently accessed data to improve query performance. If the utilization of disk or flash is consistently high, it may indicate that the workload on that storage server is exceeding its capacity.
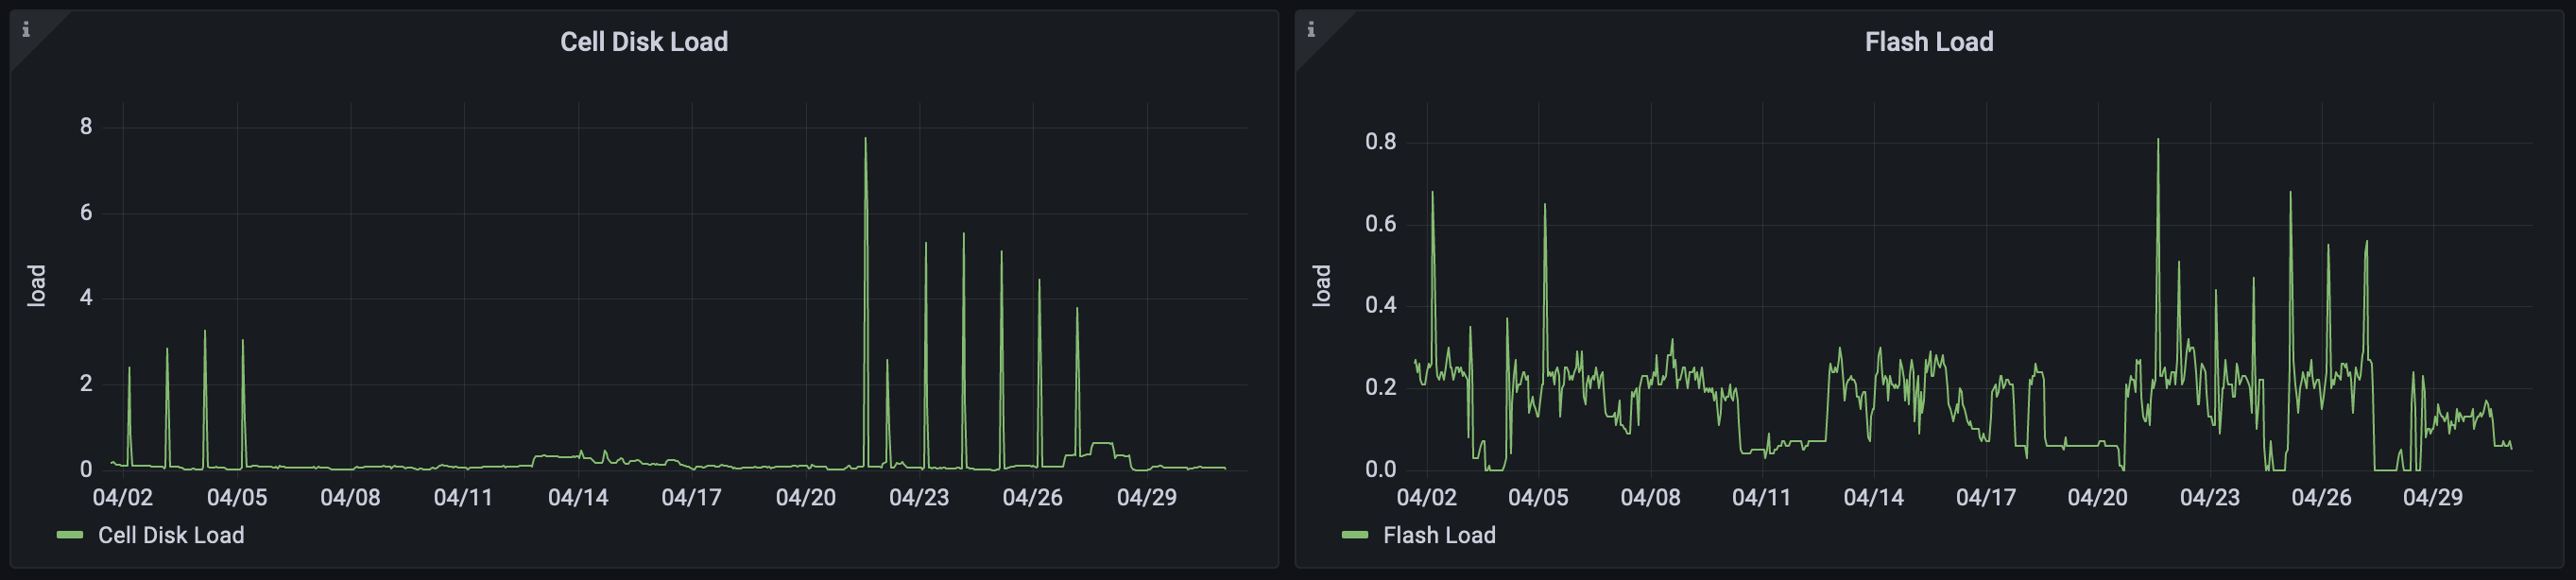
Disk and Flash Load
Analyzing the load helps identify if the storage is becoming overloaded due to a sudden increase in workload, or if a particular database or application is placing an unusually high demand on the storage. This analysis helps to make informed decisions about resource allocation and workload management, such as migrating certain workloads to different storage resources or increasing the storage capacity.
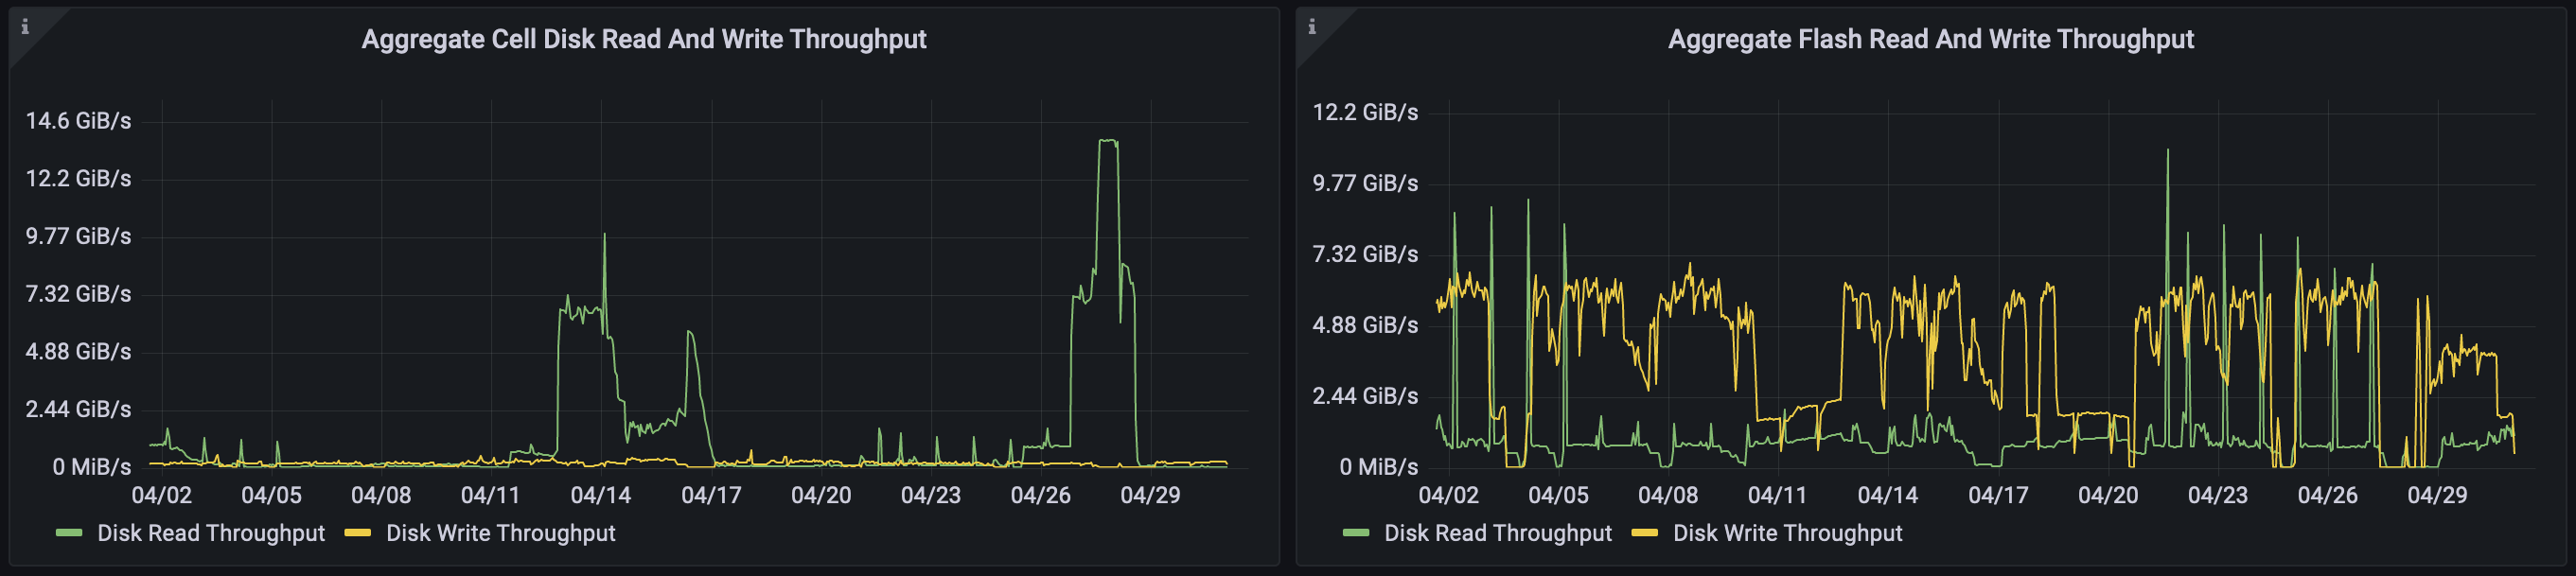
Disk and Flash Read/Write Throughput
Review the read and write throughput to identify how much data the storage server is processing and the usage pattern over time. Knowing the peak periods of activity helps make informed decisions about the capacity needed.
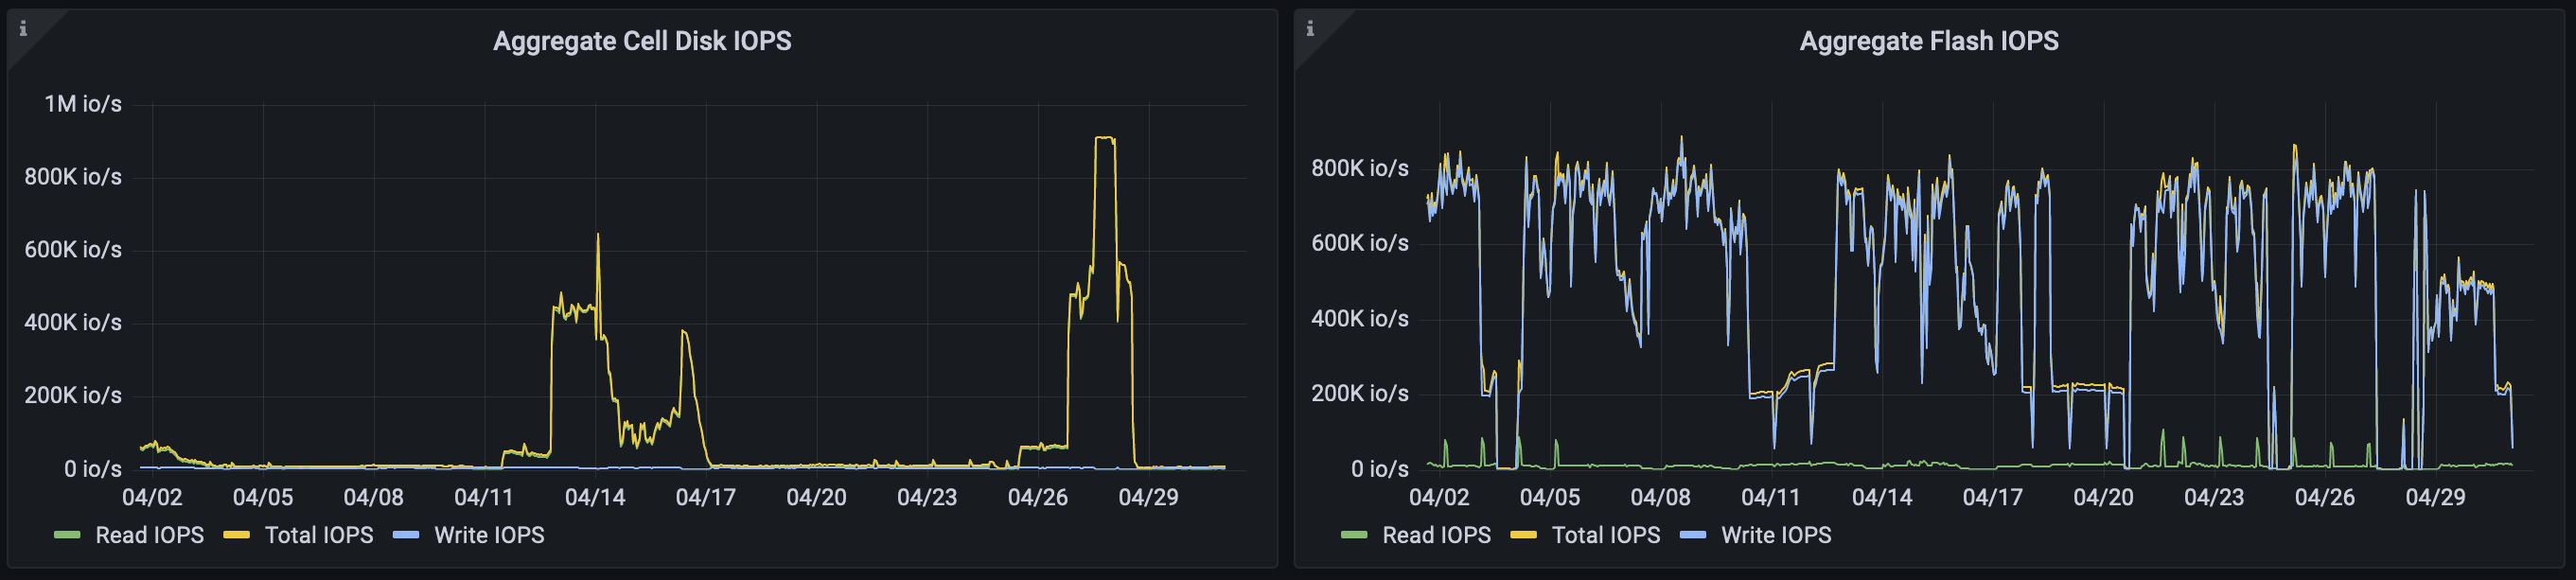
Disk and Flash IOPS
Review the read-and-write IOPS to identify how many requests the storage server is processing and the usage pattern over time.
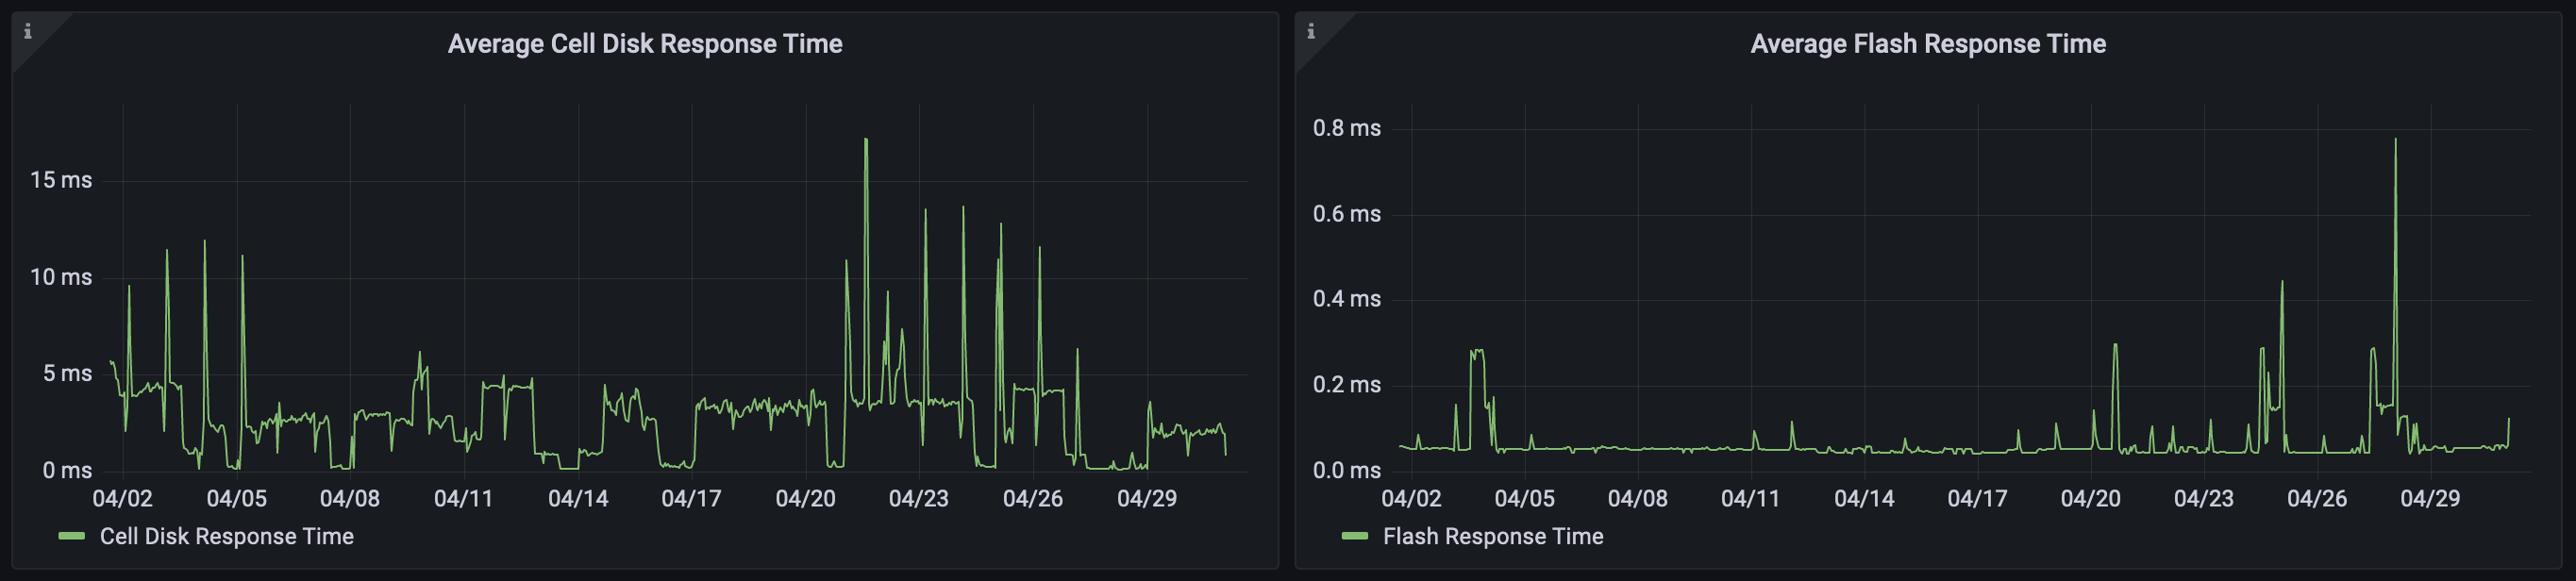
Disk and Flash Average Response Time
The disk and flash response time refers to the time it takes for a read/write request to be processed by the storage servers. The response time for disk and flash can be affected by several factors, including the workload on the system, the configuration of the storage servers, and the type of requests being processed.
Oracle Exadata Network Capacity Planning
Oracle Exadata is configured with high throughput and low latency networking infrastructure, this enables it to maximize bandwidth and availability.
Oracle Exadata makes use of a minimum of three networks and can support additional networks. The three required networks are the Administration Network, Client Network, and Private Network. Additional networks can include a Backup Network and others. Starting with Oracle Exadata X8M, the private network uses RDMA over Converged Ethernet (RoCE). Previously, the private network was built using InfiniBand technology.
Ethernet interfaces (eth0, eth1, eth2, eth3, eth4, eth5, …) are typically used for external network connections, such as client networks, backup networks, and administration networks. The Private network makes use of either RoCE interfaces (re0, re1, …) or InfiniBand interfaces (ib0, ib1, …) for internal high-speed communication between the different components within the Exadata system. The client and additional networks such as backup networks make use of bonded interfaces (bondeth0, bondeth1, …) to provide increased bandwidth and redundancy.
For more information, refer to Network Requirements for Oracle Exadata.
Below is an example of the transmit network performance of bonded interfaces over a month.
Refer to the Alerting and advanced dashboarding in Oracle Enterprise Manager App for Grafana 4.0 blog to learn more details about the new features introduced in the 4.0.0 version of the app.
For the latest installation instructions or to learn more about the app, refer to the Oracle Enterprise Manager App for Grafana User’s Guide.
Resources:
Oracle Enterprise Manager Documentation
Oracle Enterprise Manager Blogs