Contributing Author – Marco Hernandez
OCI Stack Monitoring focuses on the monitoring of applications and their application stack technologies such as Oracle Database, WebLogic Server, E-Business Suite and hosts. In one click, Stack Monitoring automatically monitors all hosts in a compartment whether they are running in OCI, on-premises, or another cloud provider using the new host auto-promotion UI. When an agent is deployed on a host, it becomes available for promotion, thus enabling host monitoring. In this release, automating the promotion on all hosts is done with a single-click UI. Once auto-promotion is enabled, a host is automatically monitored as soon as an agent is deployed on that host.
3-steps to automatic host monitoring
To enable host auto-promotion:
1) Select the compartment in which you want to enable host auto-promotion.
2) Locate the Promote to full monitoring page
3) Click the Host auto promotion button and confirm. Stack Monitoring will immediately begin monitoring all the hosts within that compartment after a Management Agent has been installed on the host
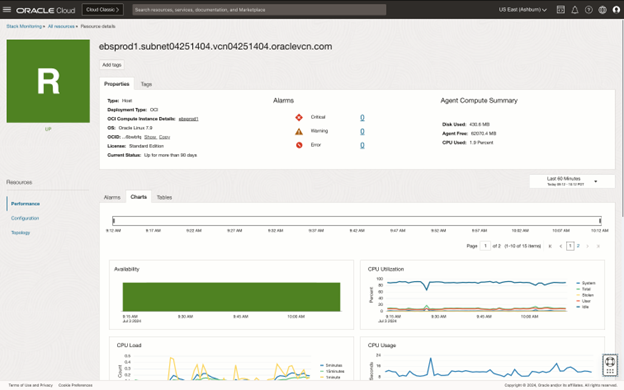
OCI Stack Monitoring unlocks instant value with host monitoring
After a single click of a button, Ops teams save time with automatic host and receive immediate value with host monitoring. Host home pages provide visibility into the host’s availability and performance. You can check for high CPU or Memory utilization as well as monitor for file system usage. CPU Utilization is monitored with baseline and anomalies to determine if they are within the expected ranges and performing anomalously. Leverage the topology to quickly identify what is running on the host, and if the current performance is impacting the application such as Tomcat running on that host. Then, using topology, easily navigate to the Tomcat server to investigate the performance further.
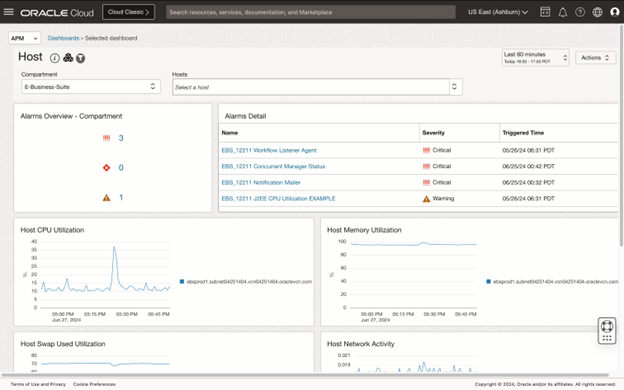
OCI Stack monitoring offers scalable host monitoring
As the enterprise grows, so do responsibilities. Stack Monitoring enables you to monitor a large fleet of hosts at scale.
The host fleet dashboard monitors hosts across the fleet. This dashboard helps proactively review open alarms and monitor the hosts utilizing the most CPU, Memory, Swap etc. In addition, Enterprise Summary can be used to monitor hosts in the context of their running applications.
Monitoring your hosts at scale in Stack Monitoring has never been easier! To learn more about Stack Monitoring and its features, see our latest presentation replay on Flexible monitoring that meets your unique business requirements.