Contributors: Mirella Tumolo, User Assistance Development and Yutaka Takatsu, Product Management
We continue to enhance Oracle Application Performance Monitoring (APM) on a periodic basis and have rolled out quite a few powerful capabilities. This blog summarizes our recommendations for you to review.
Application Performance Monitoring now enables Machine Learning-based anomaly detection
Anomaly detection is now enabled for custom Metric Groups. You can create Metric Groups in Application Performance Monitoring and use OCI Monitoring to view and obtain alerts on anomaly detection events.
A Machine Learning model is calculated for any custom metric defined in a Metric Group. A new dimension, Anomaly, is added to each of the metrics. The dimension values are:
- 1 – higher value anomaly detected
- 0 – no anomaly detected
- -1 – lower value anomaly detected
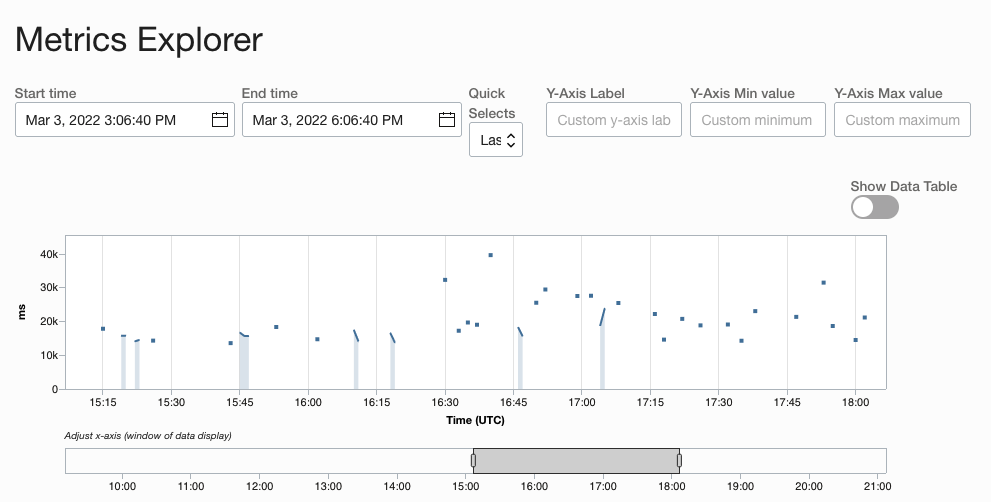
An example of anomalies detected in OCI Monitoring, the Metric Explorer chart, is shown below:
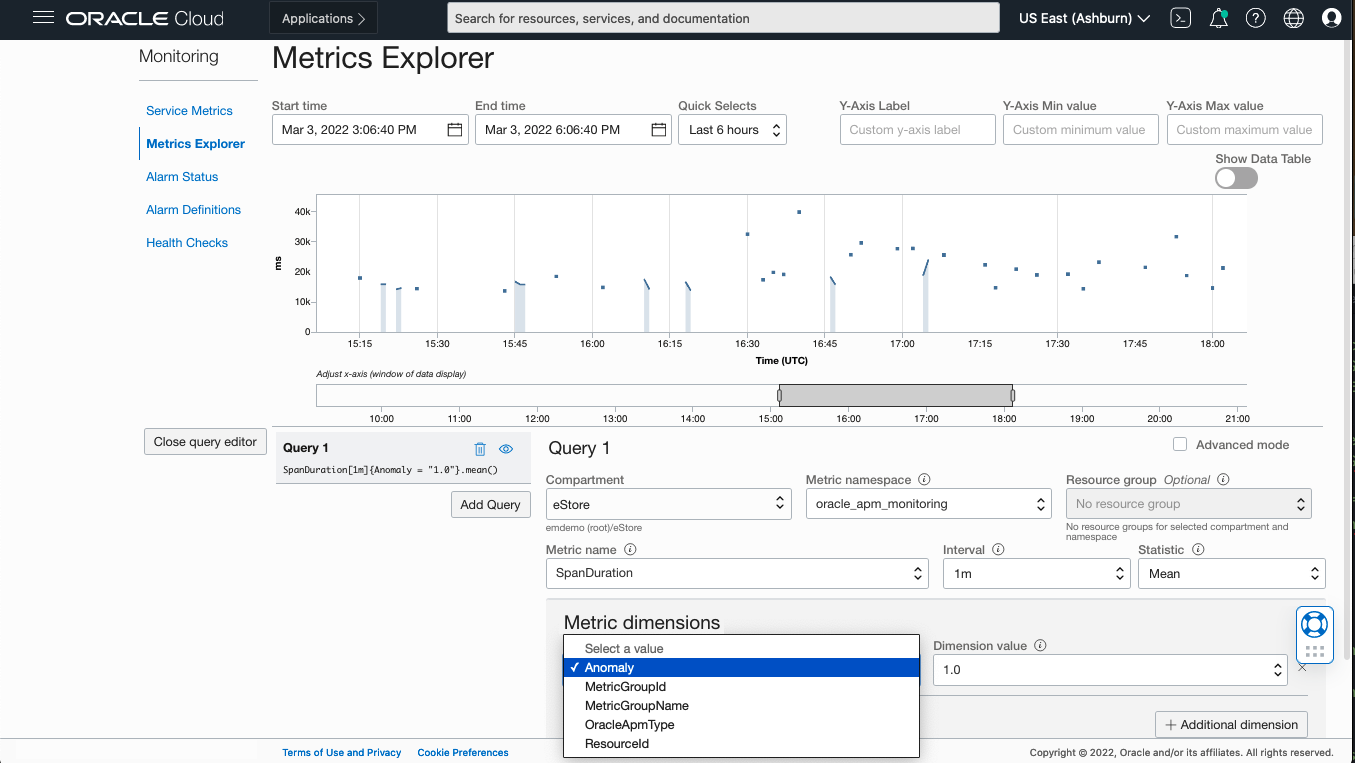
Here is the Metric Explorer showing the SpanDuration metric selected and the drop-down list of metric dimensions available, including the new Anomaly dimension:
For more information about creating Metric Groups, see Application Performance Monitoring documentation.
Introducing Thread Snapshots for Java deep dive diagnostics
Application Performance Monitoring provides code line-level diagnostics through new and improved Thread Snapshots capturing. You can use this new feature in the Trace Explorer to view a graph of thread stack snapshots and perform a deep dive into trace data, and access information like start and end time, state of threads, method and file names, in a variety of formats. For more information, see View Thread Snapshots.
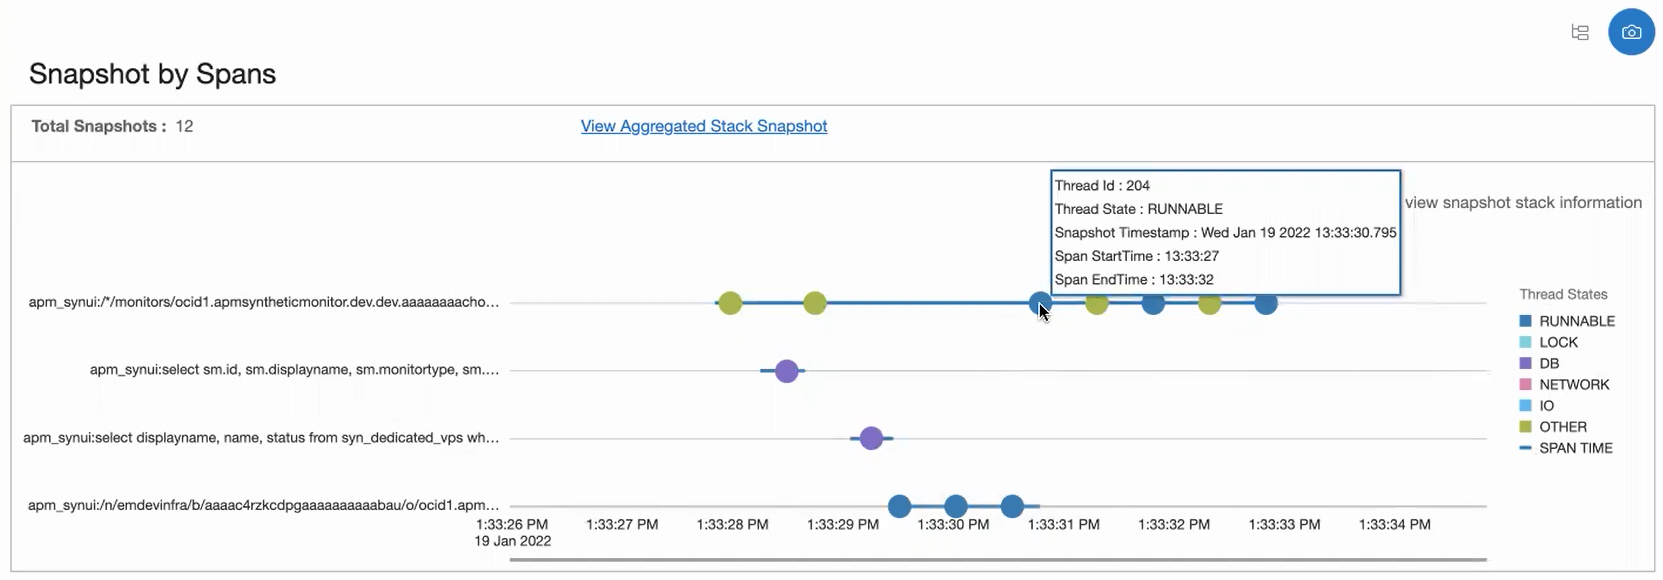
Here’s an example of the Spans view where each icon represents a thread snapshot:
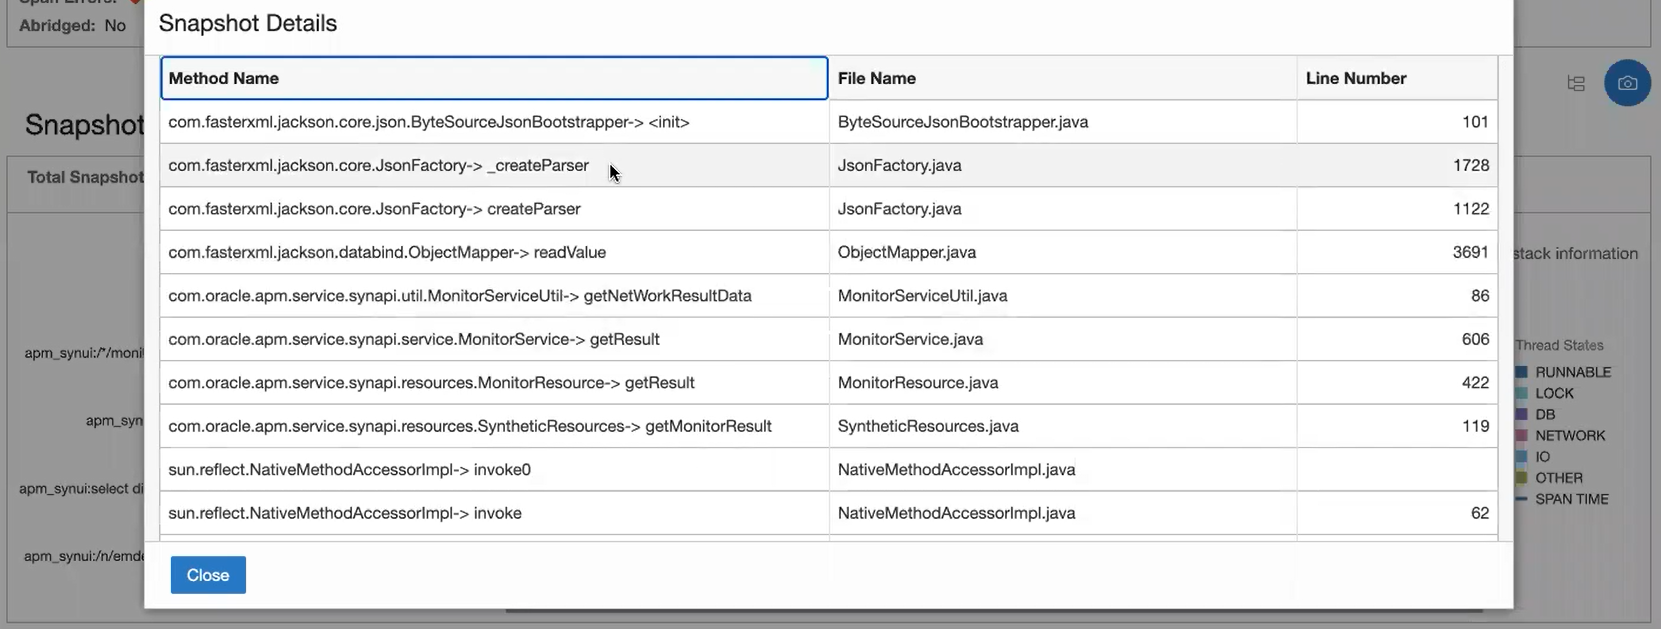
The Snapshot Details window details the Java stack trace information, including the Method name, File Name, and Line Number:
Topology Enhancements
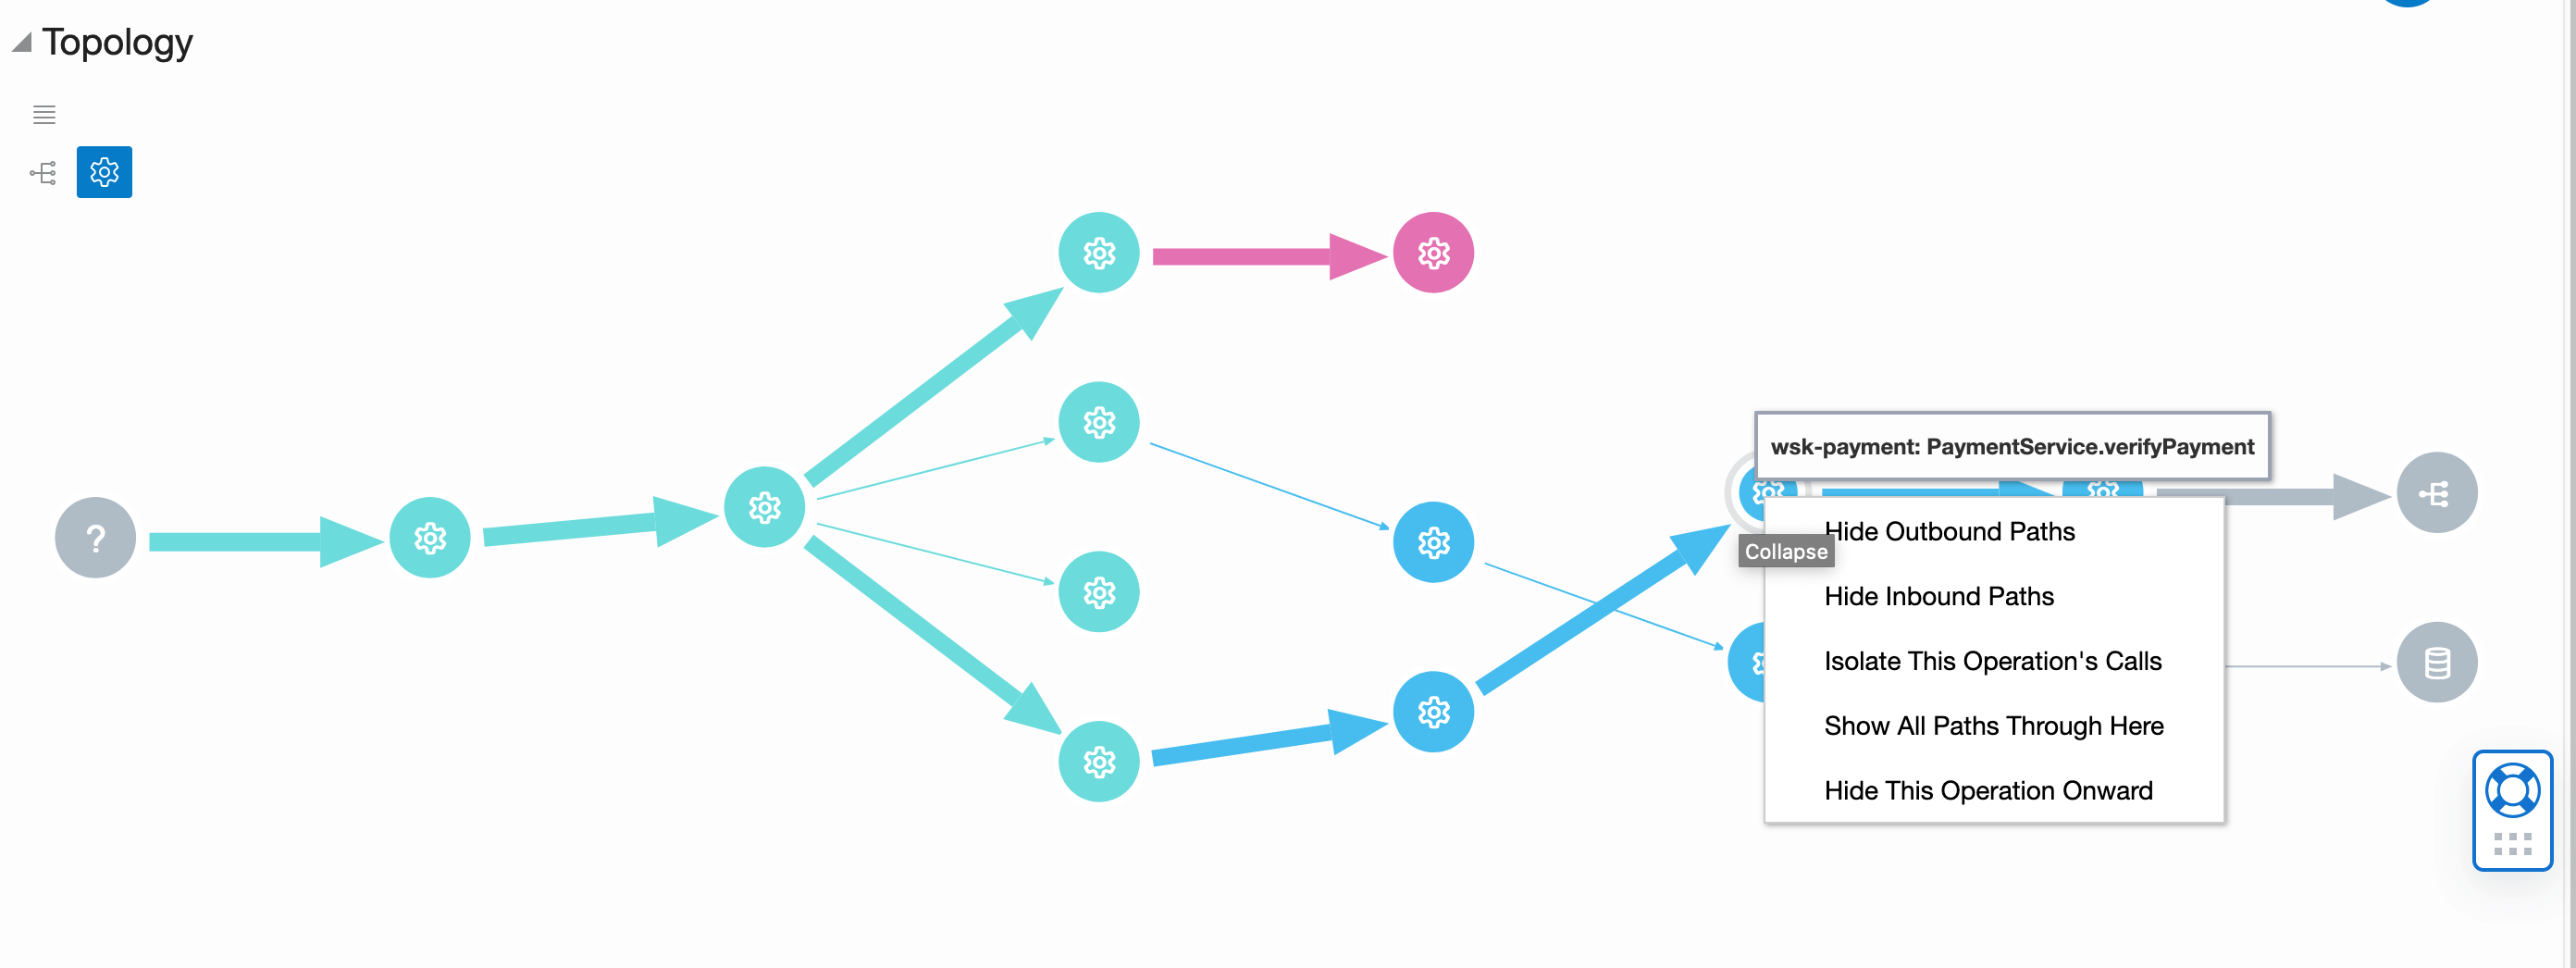
Enhancements to the Topology view in Trace Explorer enable you to perform the following actions:
- Right-click in the white space to view a menu with options that enable you to show or hide specific types of nodes. You can then select the Show All option in the menu to view the entire topology for the query.
- Place the cursor on a node and right-click to view a menu with options that allow you to show or hide the various nodes and call relationships pertaining to the selected node.
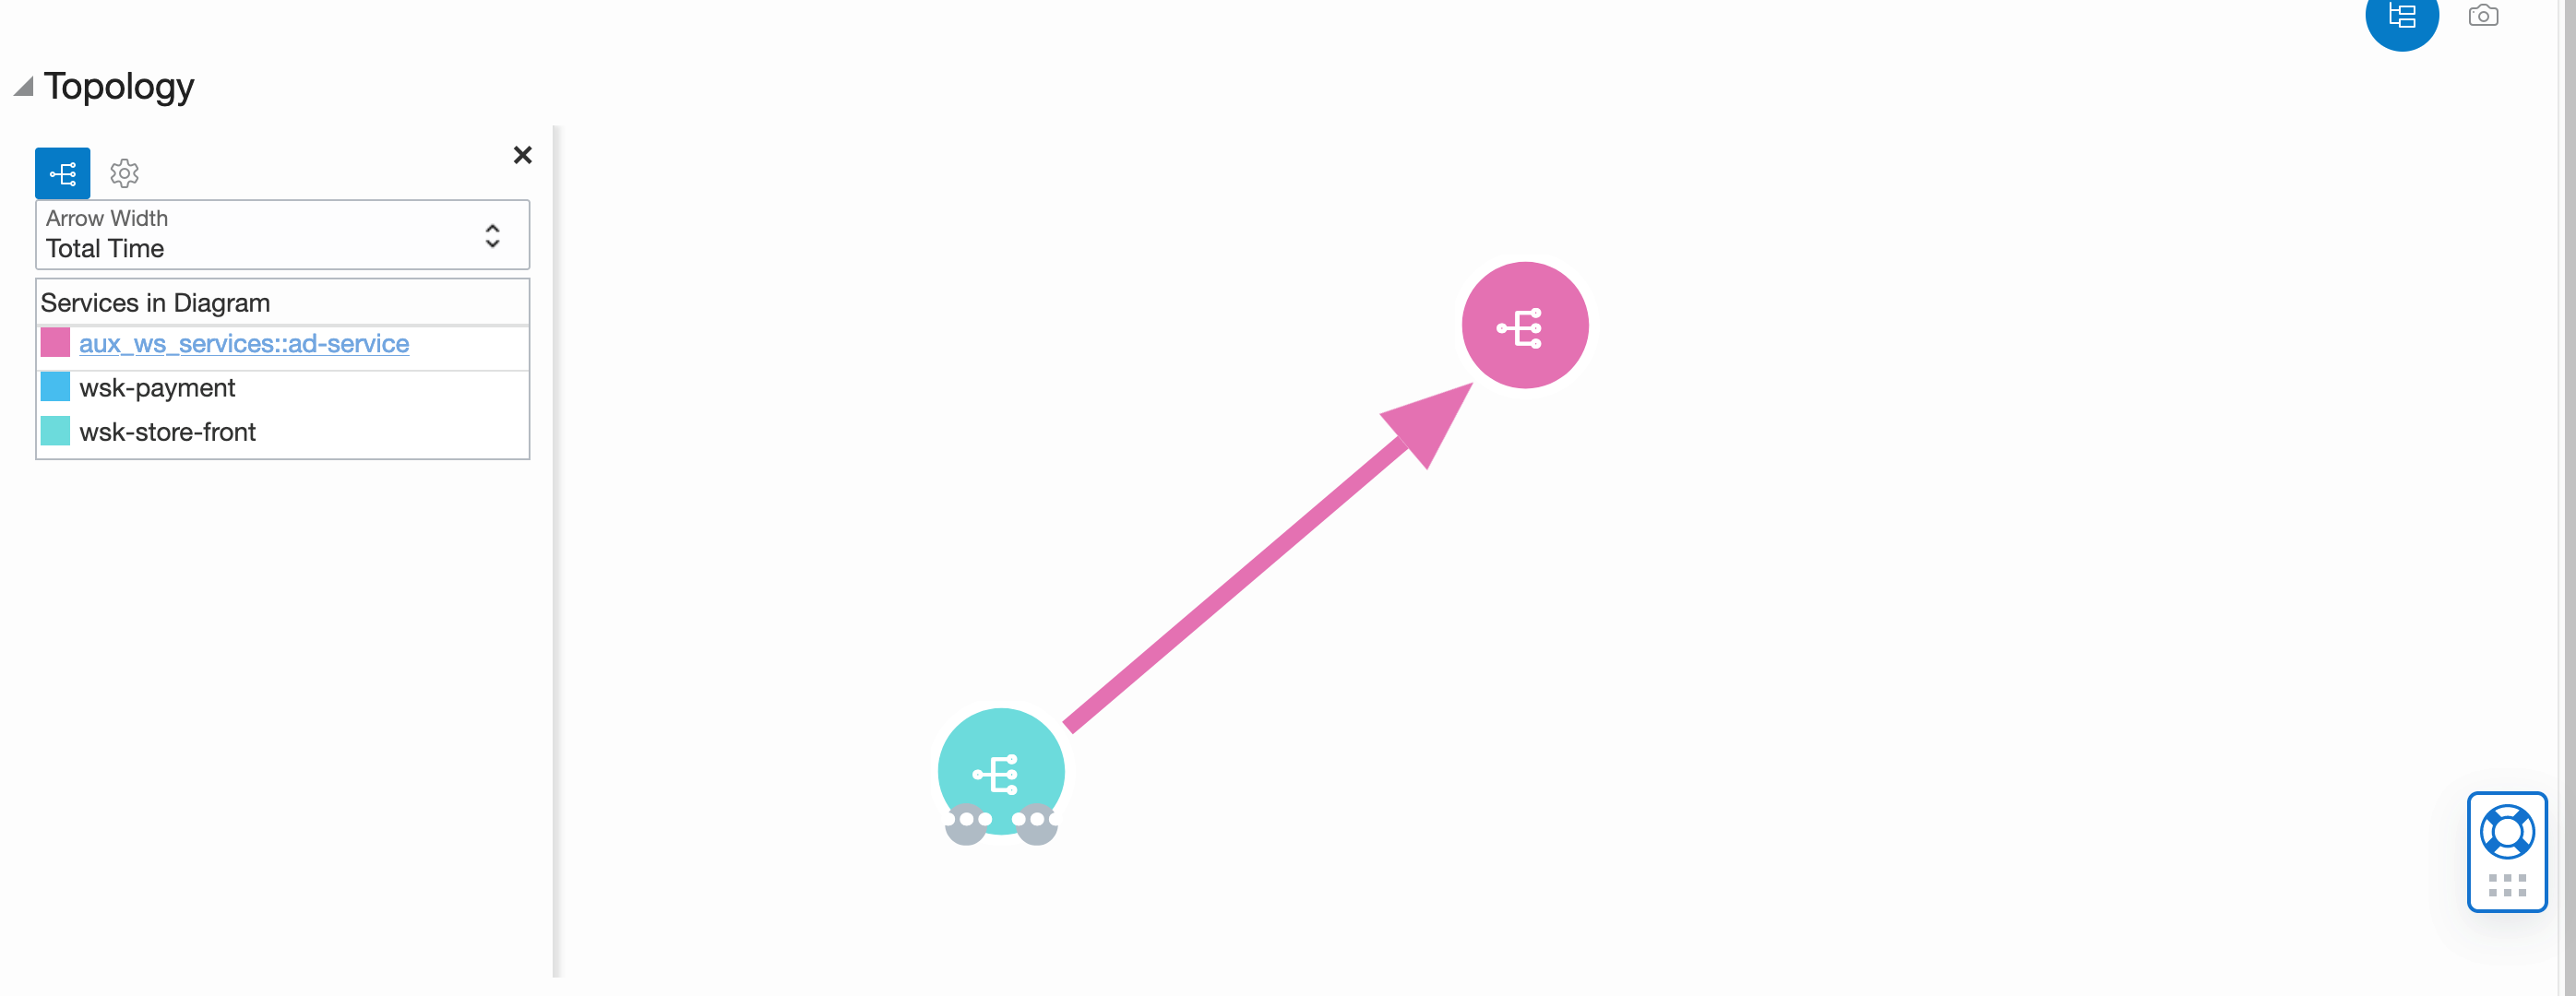
- Click service in the Services in Diagram legend to just view the nodes of that service, and their inbound and outbound calls. Other nodes that are not directly related to the nodes of the selected service are not displayed in the topology. This action can be performed when viewing either services or operations in the Topology view.
For more information, see View Service Topology.
Metric Groups and Span Filters
Now create alerts on metrics and show them in charts based on span data, by using Metric Groups and Span Filters:
- Metric Groups define metrics that are pushed to the Monitoring service for alerting and charting purposes.
- Span Filters describe the specific set of spans that are examined to compute the metrics in the Metric Groups.
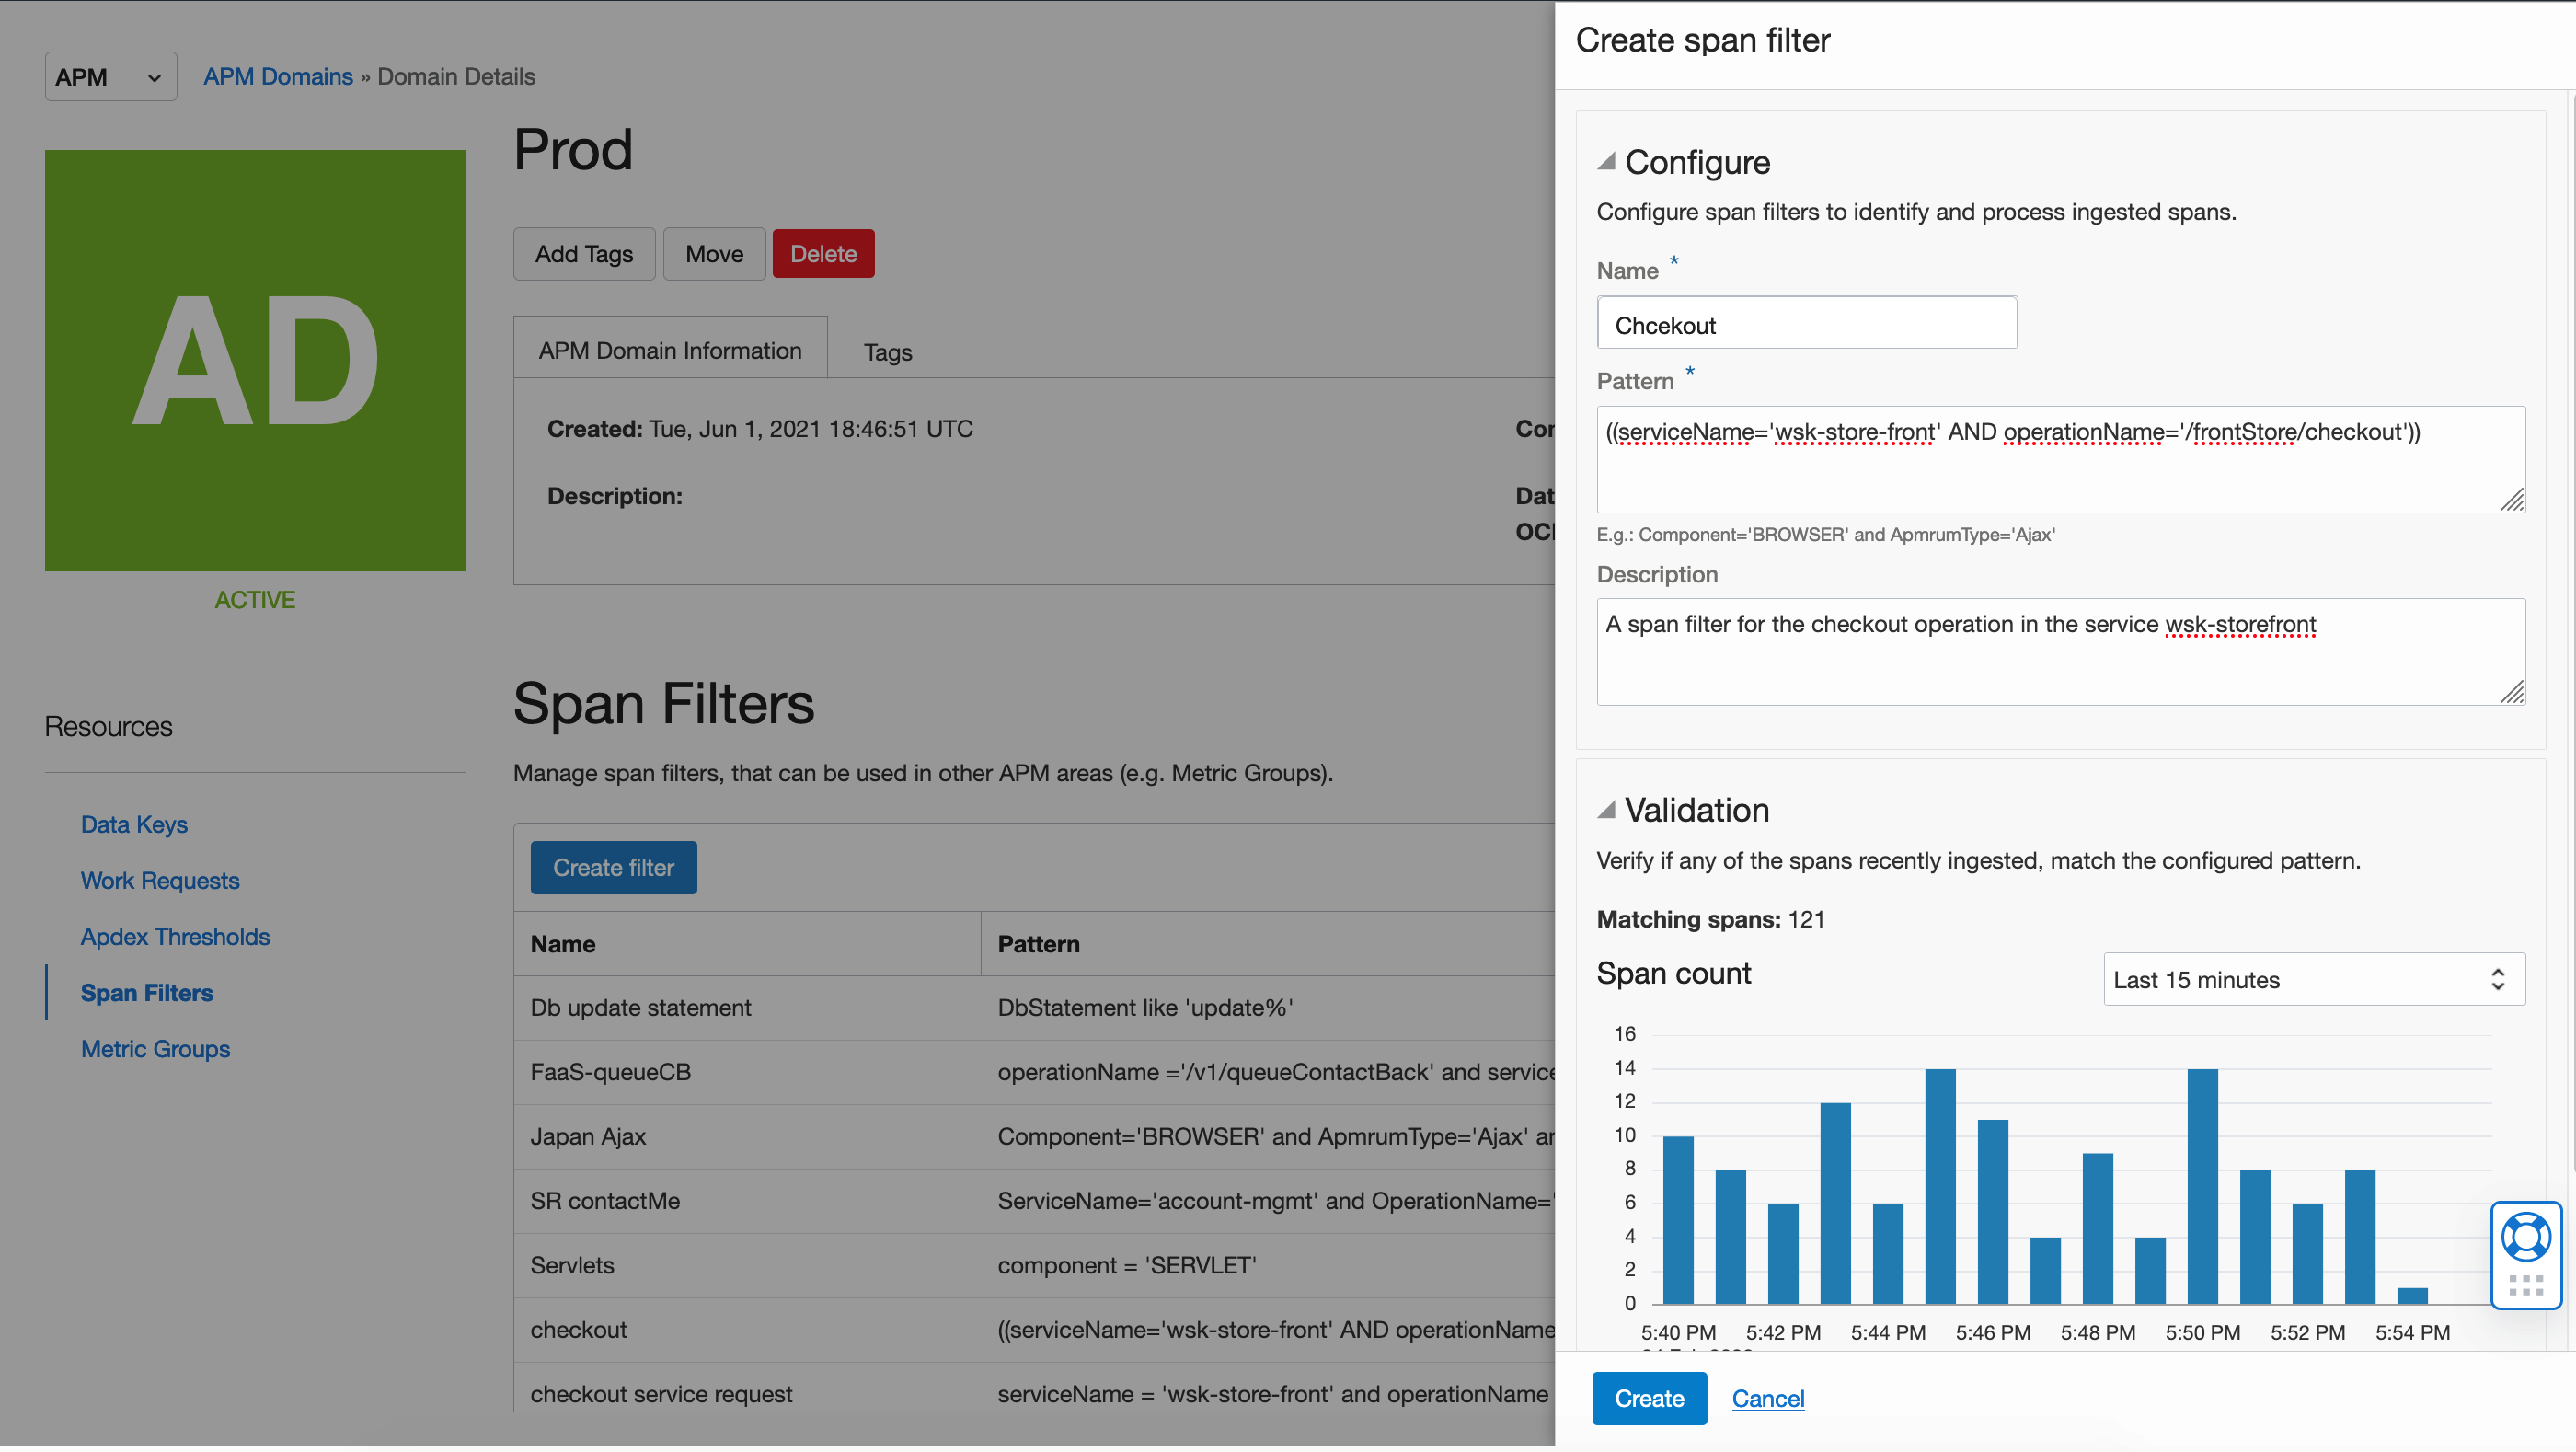
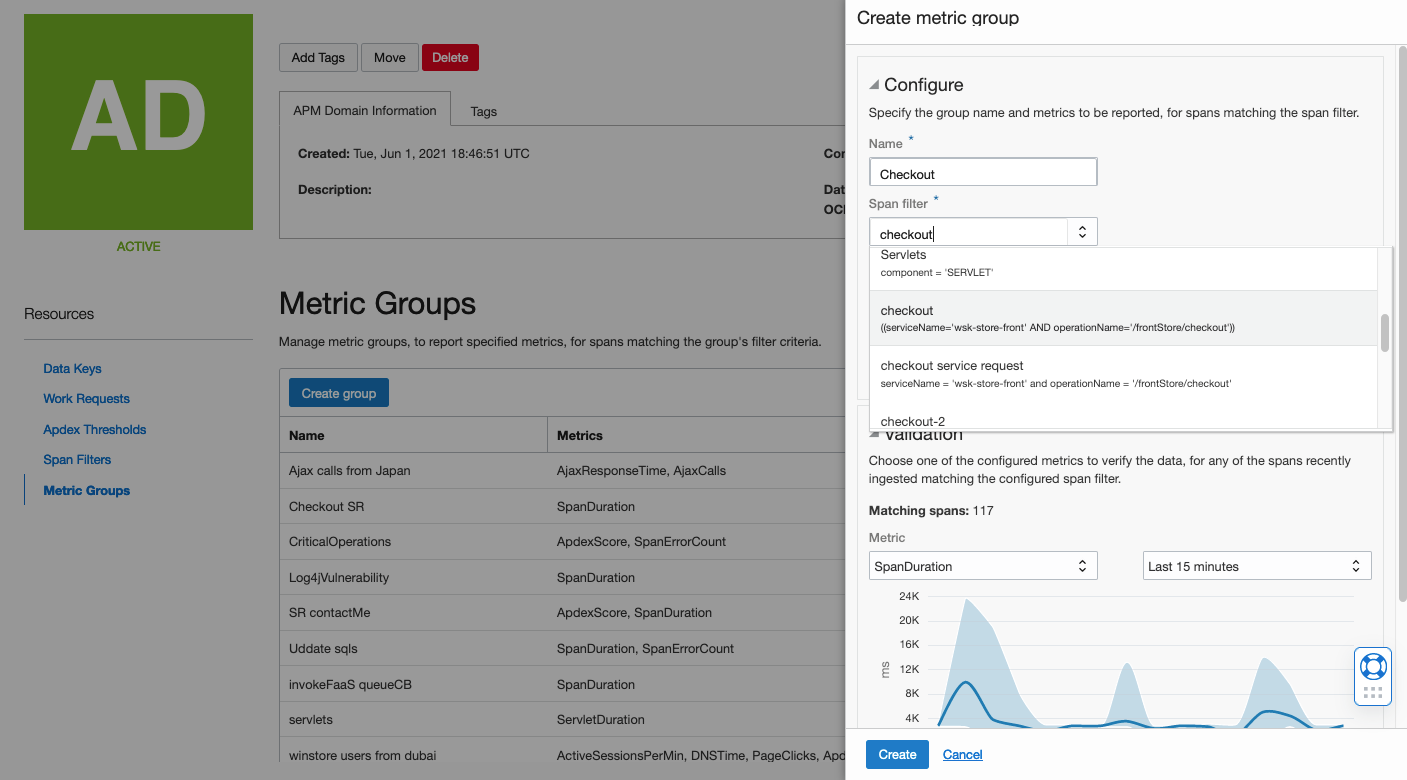
Metric Groups and Span Filters capabilities enable fine-grain alerting on out-of-the-box and custom metrics collected from spans in any of the monitored application tiers, using different aggregation levels (service, application, environment, or any other level). For more information, see Create APM Domain.
Trace Explorer New Features
Trace Explorer is a rich interface that enables you to view traces and spans and identify application performance issues anywhere in the stack, from the browser to the database. With Trace Explorer, you can now also:
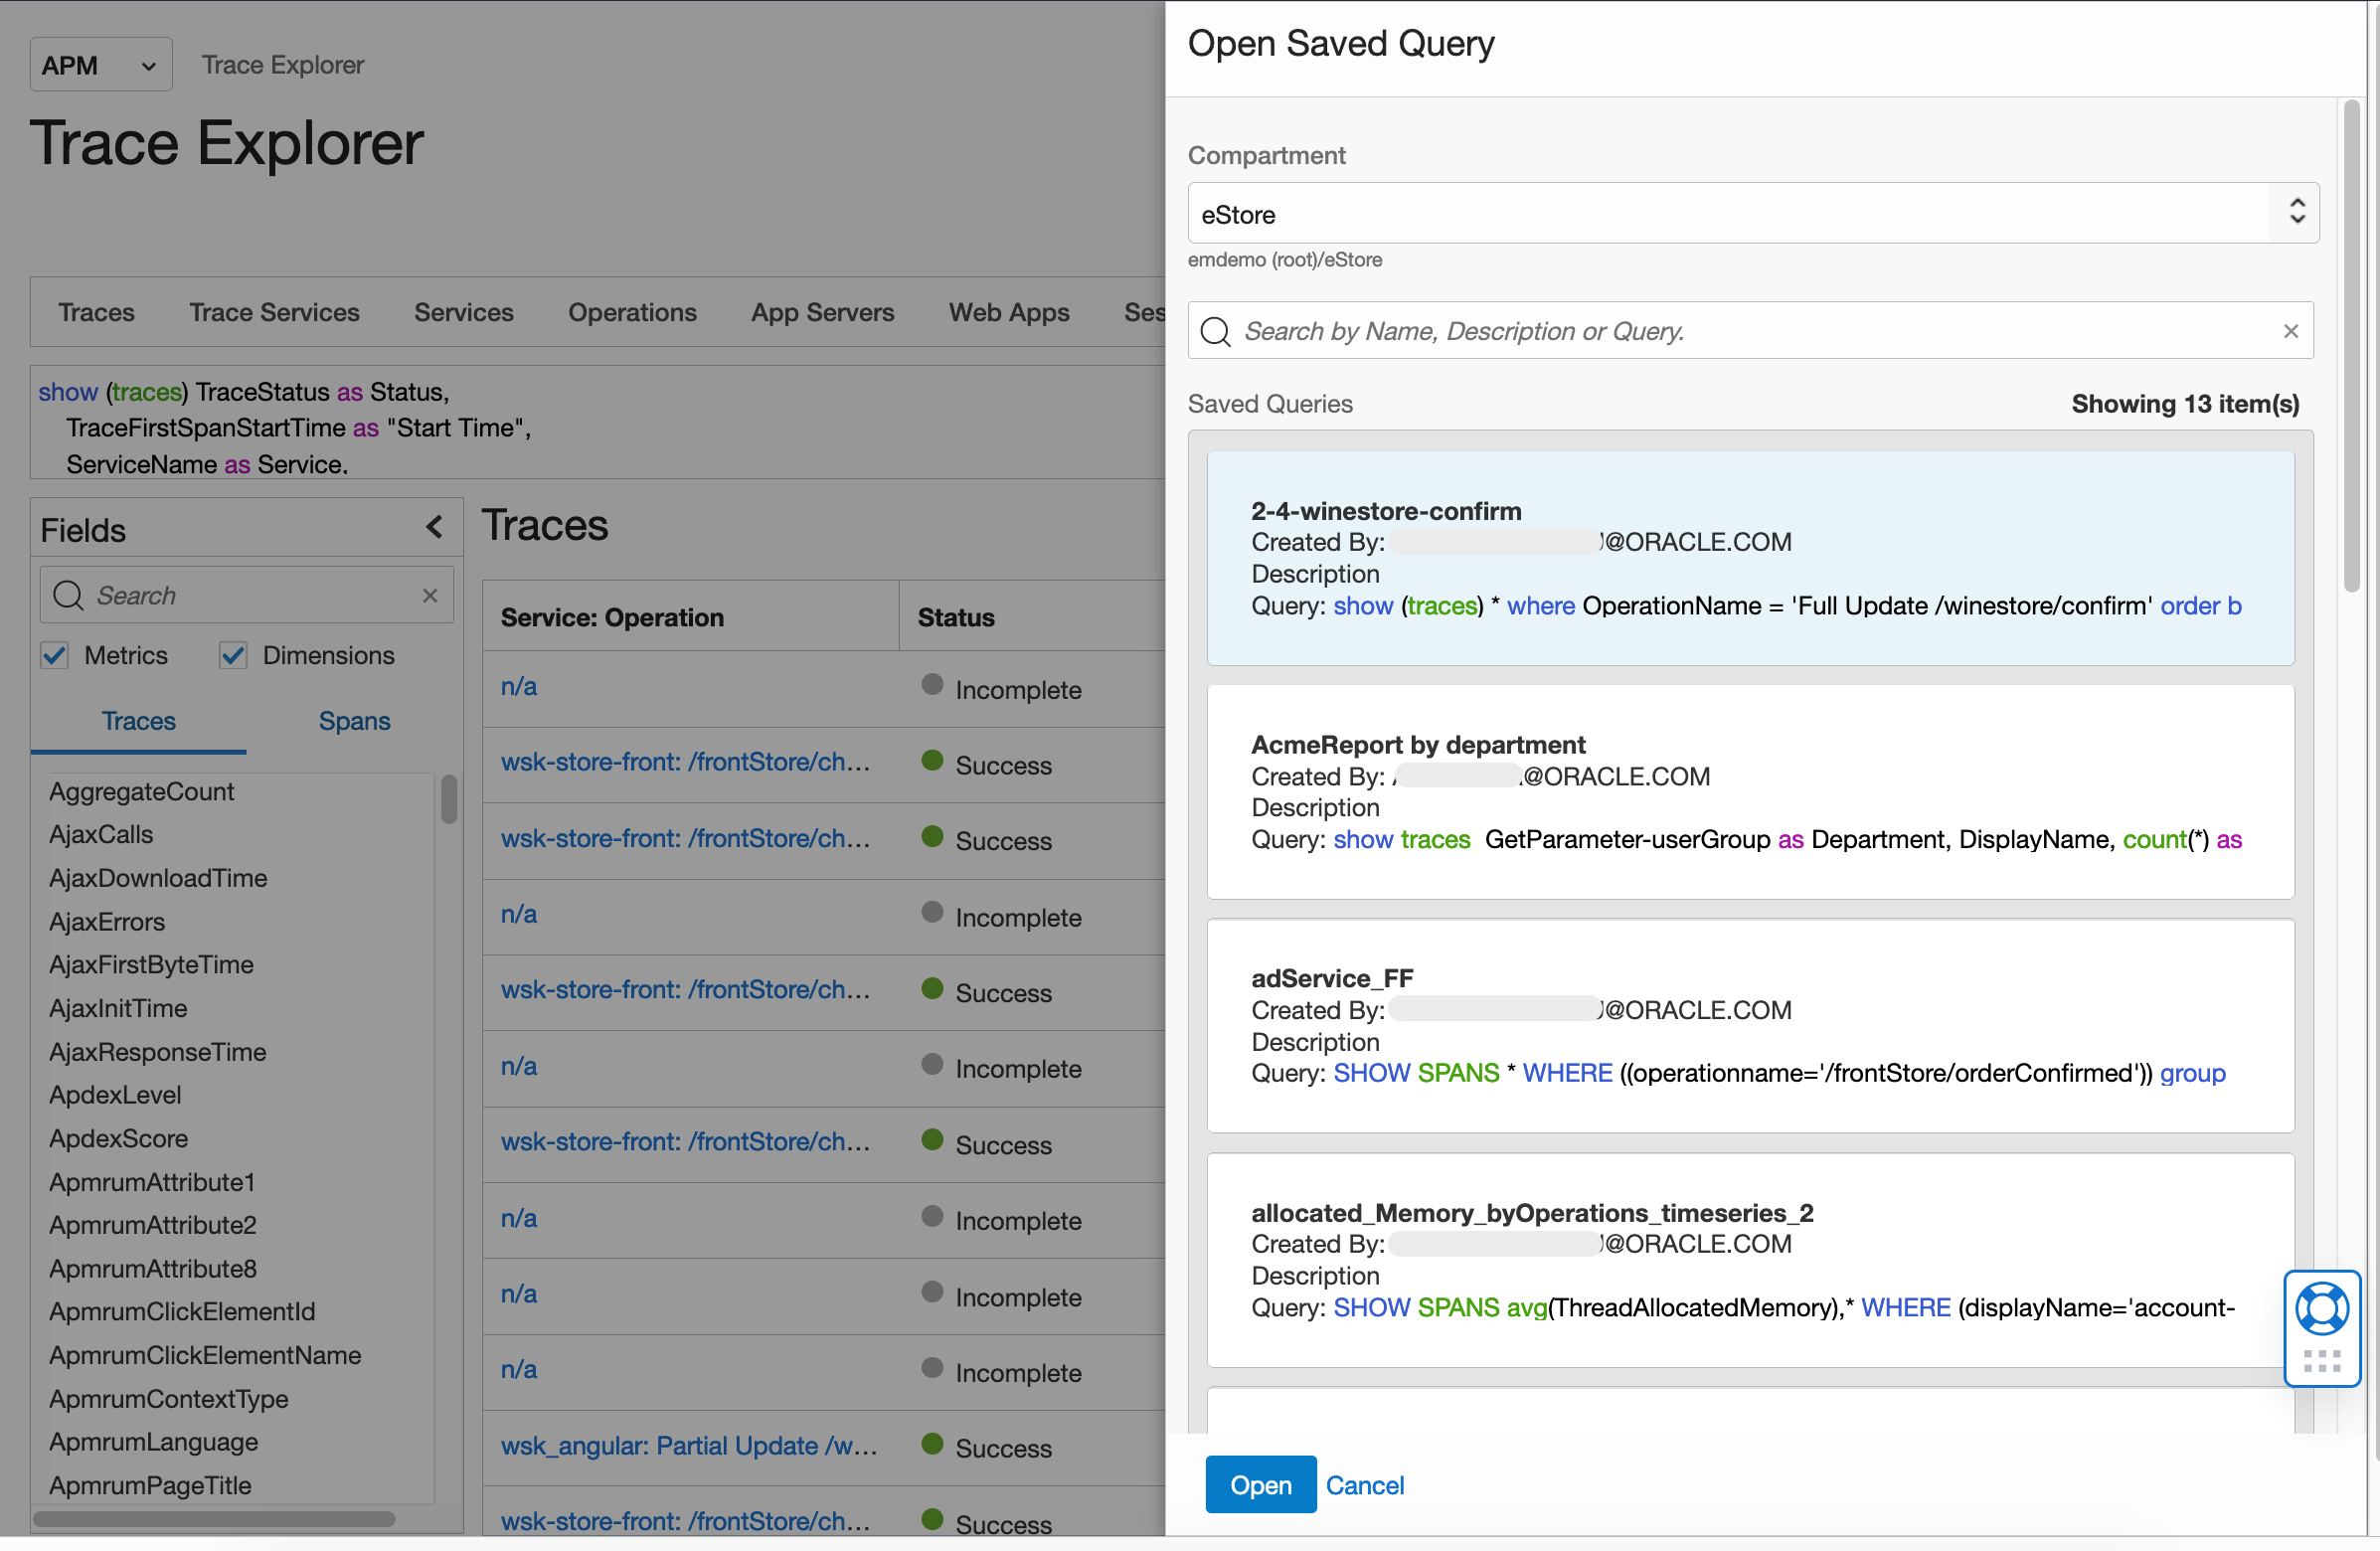
- Save an edited out-of-the-box query or a custom query and open it at a later time to filter trace data. This enables you to easily access an edited or custom query that meets your specific requirements. For more information, see Configure a Saved Query.
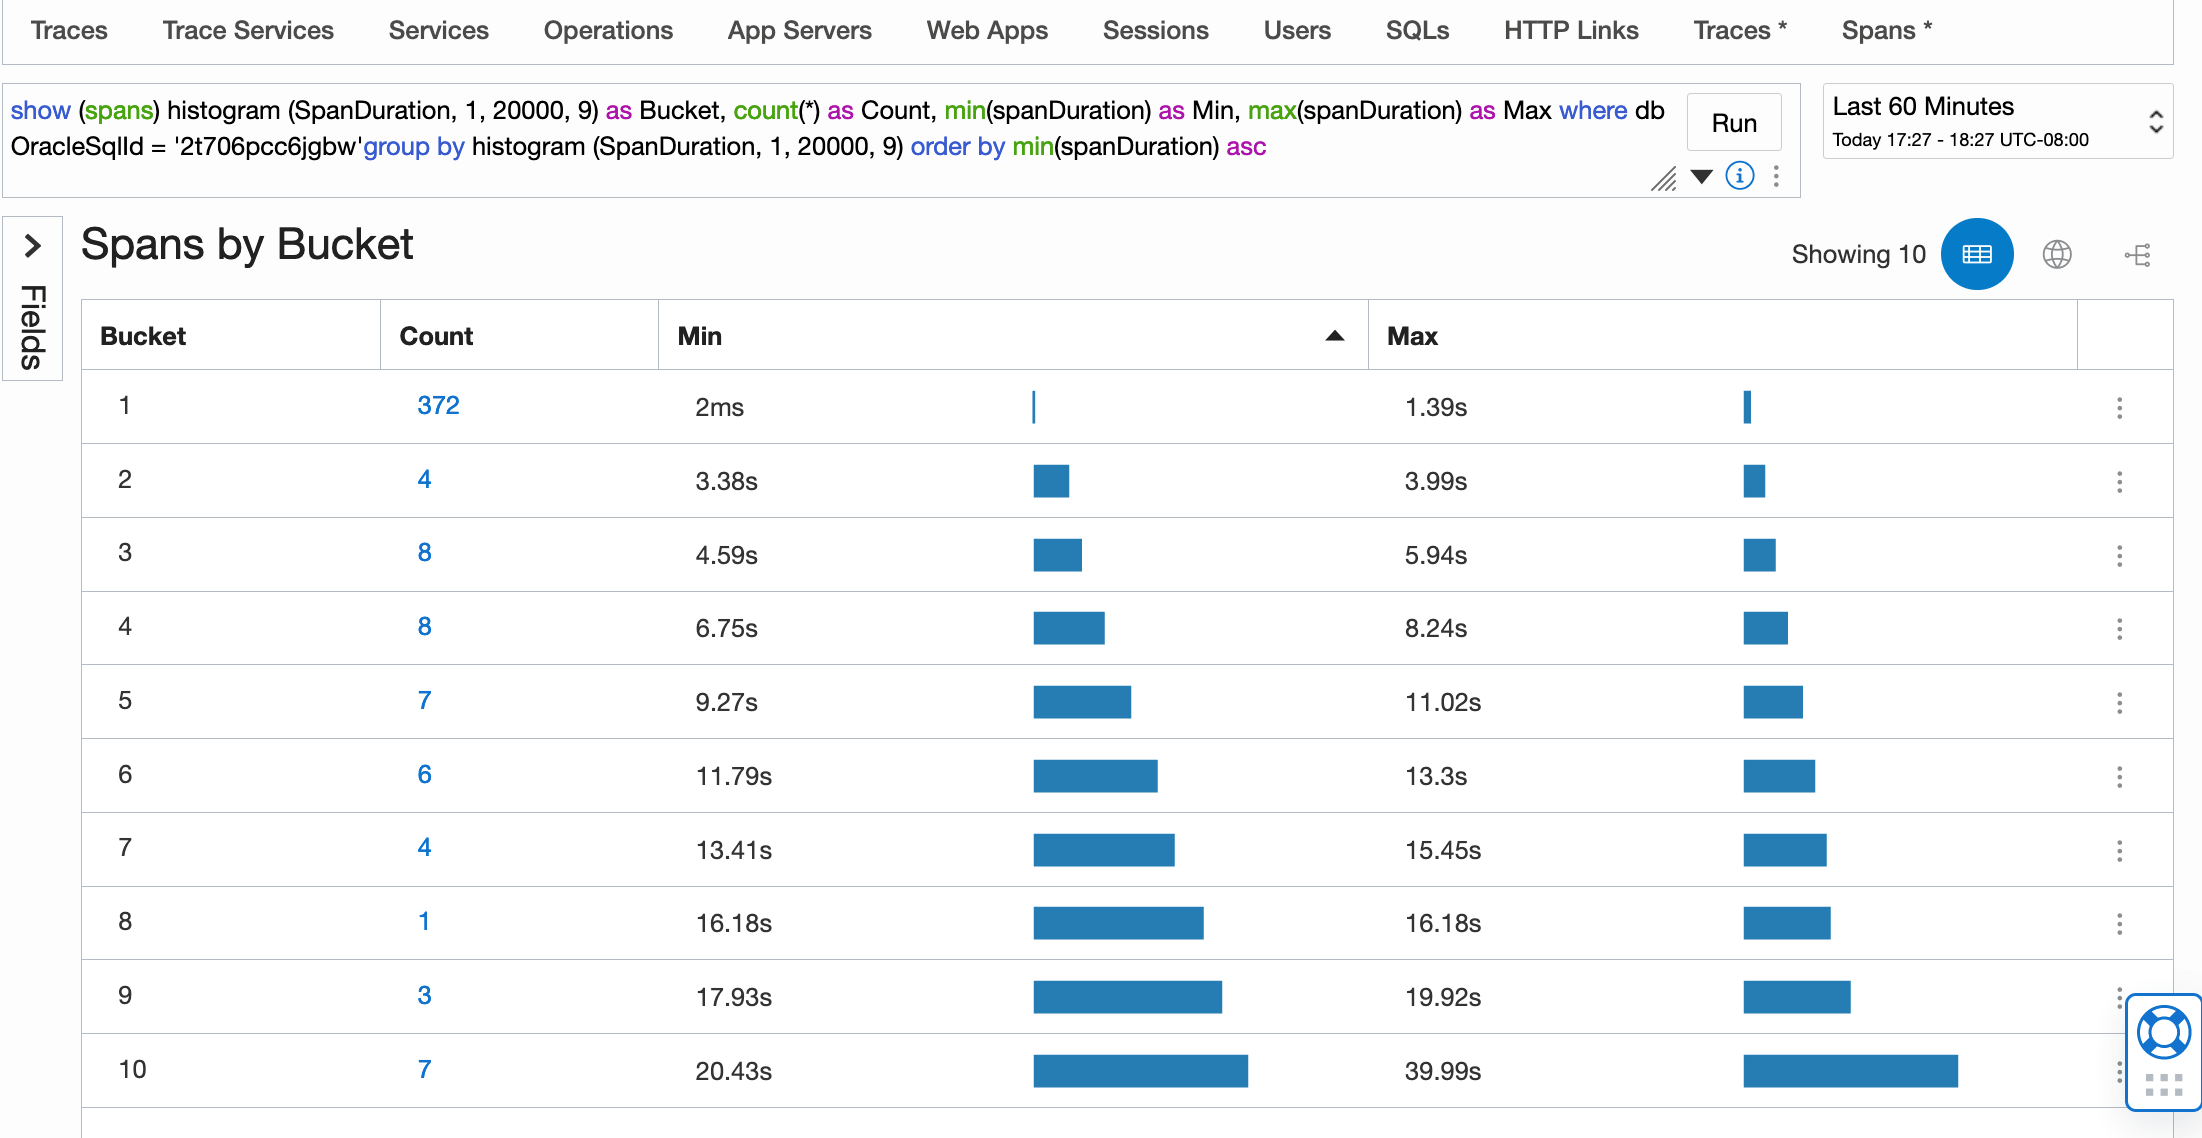
- Display your data as a histogram using the histogram function in your queries. For more information, see Work with Queries in Trace Explorer.
- Find a set of traces or spans that will be searched by the rest of your query using the Selection clause as a sub-query. For more information, see Work with Queries in Trace Explorer.
- View the values of the dimensions listed in the Fields section in Trace Explorer. To do so, hover the mouse on the dimension and click the link to view the dimension values in the Dimension <Name> Values dialog box. This capability helps you understand what a specific dimension is used for and how best to use it in a query (in a where clause, in a group by, and so on). For more information, see Monitor Traces in Trace Explorer.
The APM Java Agent version 1.4 is now available
The new version of the APM Java agent introduced the following:
- Ability to enable the reporting of the loaded JAR files in the application and automatically create a trace consisting of the names of the loaded JAR files. This can be done by updating the AgentConfig.properties file from the APM Java agent.
This is an important feature that collects all the JAR files that are being loaded and allows users to detect vulnerable files. For example, you can discover vulnerable log4j libraries.
- The Thread Snapshots view in Trace Explorer, described in the prior section, is enabled with this version of the agent and allows you to have deeper visibility into the span data.
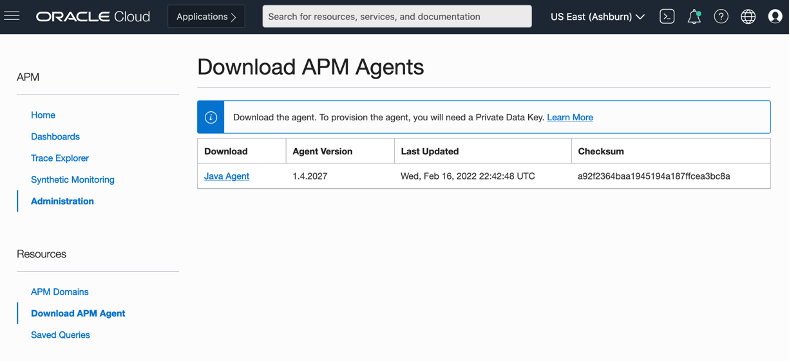
As always, the APM Java Agent version 1.4 is available for download from the APM Administration page, as shown below:
APM Browser Agent supports custom dimensions and metrics
The APM Browser Agent supports the creation of custom dimensions, also known as attributes by using the udfAttributes property of the apmrum object. Every time the APM Browser Agent code creates a span, this data is looked up and used to populate the span with the desired attributes. For more information, see Configure Attributes for Real User Monitoring.