Can Enterprise Manager Cloud Control monitor Oracle WebLogic Server that is set up in the Kubernetes cluster in the Oracle Cloud?
The quick answer to the question is – Yes, Enterprise Manager (EMCC/EM) can monitor WebLogic Server in Oracle Container Engine for Kubernetes (OKE) managed by the WebLogic Kubernetes Operator, for most of the out-of-the-box metrics that come with the Oracle WebLogic management pack enterprise edition license. With the increasing awareness of containerized architecture, this has been a question asked by many WebLogic customers in the past few years, as their interest toward adopting Dockers and Kubernetes continues to grow.
It’s accomplished following these three steps:
- Step 1: Set up the Kubernetes load balancer service in a private subnet for each WebLogic Server, allowing TCP communication within the Virtual Cloud Network (VCN).
- Step 2: Install an EM agent in the same VCN with the Kubernetes cluster. Here you need to create a compute instance in the Oracle Cloud to install the agent. Also, create a public subnet in the VCN and configure security rules, allowing traffic from/to the Oracle Management Service (OMS), which is set up in a different VCN.
- Step 3: Use the EM console to remotely discover the WebLogic domain, using the EM agent created, connecting to the IP of the load balancer service.
We have released a hands-on workshop in Oracle Help Center with step-by-step instructions so you understand the general approach or gain experience setting up the monitoring of WebLogic Server on Kubernetes using Enterprise Manager before doing it at your own site. You can access the workshop from the link below: Monitor WebLogic Server on Kubernetes using Oracle Enterprise Manager
In the workshop, the target WebLogic domain is provisioned by the WebLogic Kubernetes Operator and deployed on OKE in the Oracle Cloud. For more information on the WebLogic Kubernetes Operator, refer to the WebLogic Kubernetes Operator documentation.
While OKE is used as an example in this workshop, the approach of using load balancer service can also be used in hosted solutions on other cloud platforms, such as the Azure Kubernetes Service (AKS), when using EM to monitor WebLogic Server that is managed by the WebLogic Operator.
Background
If you are thinking, why don’t you just install an EM agent in the WebLogic target pod? Well, the traditional method of installing an EM agent on a target host and having it communicate with the OMS, is not practical in the Kubernetes environment for many reasons. That’s because Kubernetes pods typically reside in a private subnet where no direct traffic is allowed to or from outside of the VCN, while the OMS needs to communicate with the agent with a bi-directional network connection.
Another challenge appears when managing the lifecycle of the EM agent. Kubernetes pods are transient in nature so if a pod fails, Kubernetes automatically creates a new replica of the pod to continue the operation. If an EM agent resides in a pod, it must go through the installation and discovery process every time the pods are destroyed and respawned.
Kubernetes load balancer service
The workshop uses the Kubernetes Load Balancer service to discover the WebLogic domain. Using this method, the EM agent can connect to the Load Balancer’s external IP (private IP) that is mapped to the WebLogic Server, allowing it to collect monitoring data from the WebLogic domain targets deployed on the Kubernetes pods. Re-configuration of the EM agent is not required in an event of pod regeneration, because the Load Balancer connects to the Cluster IP service, which automatically re-connects to the new WebLogic Server pod.
Note that using the Kubernetes Load Balancer service only works on supported cloud platforms, where Kubernetes can leverage the provider’s native load balancer and integrate into the configurations.
Setup Details
The WebLogic domain is provisioned in OKE following the steps described in the workshop Migrating WebLogic Server to Kubernetes on OCI and access to the WebLogic pods is restricted in the private subnet.
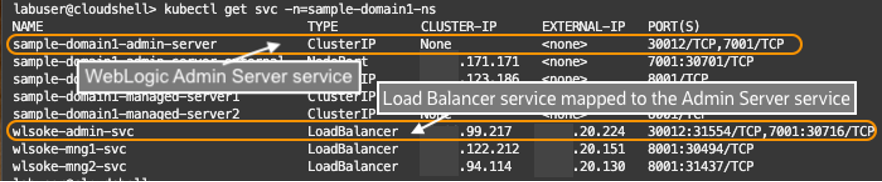
To enable the communication between the WebLogic Servers and the EM agent in the VCN, the Kubernetes Load Balancer service was set up in a private subnet and connected to each WebLogic Server pod. Each Load Balancer service has an external IP (private IP), allowing access from the same VCN. Ports (7001 for admin server, and the port 8001 for managed servers) were opened in the Load Balancers to bridge the communication between the WebLogic Server services and the EM agent.
Within the VCN, a new compute instance was created in a public subnet for the EM agent installation, and the firewall was configured to communicate with the Oracle Management Service (OMS) instance. OMS is the central piece of EM and runs in a different VCN in the Oracle Cloud.
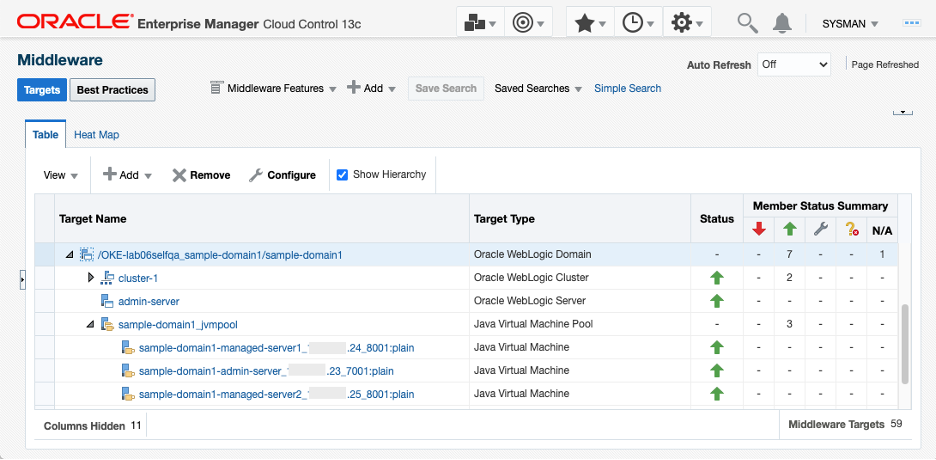
Finally, the EM agent was pushed from the OMS and installed in the agent compute instance. The WebLogic domain and related targets were discovered from the EM console Middleware home page, using the ports and the external IPs of the Load Balancer as discovery parameters.
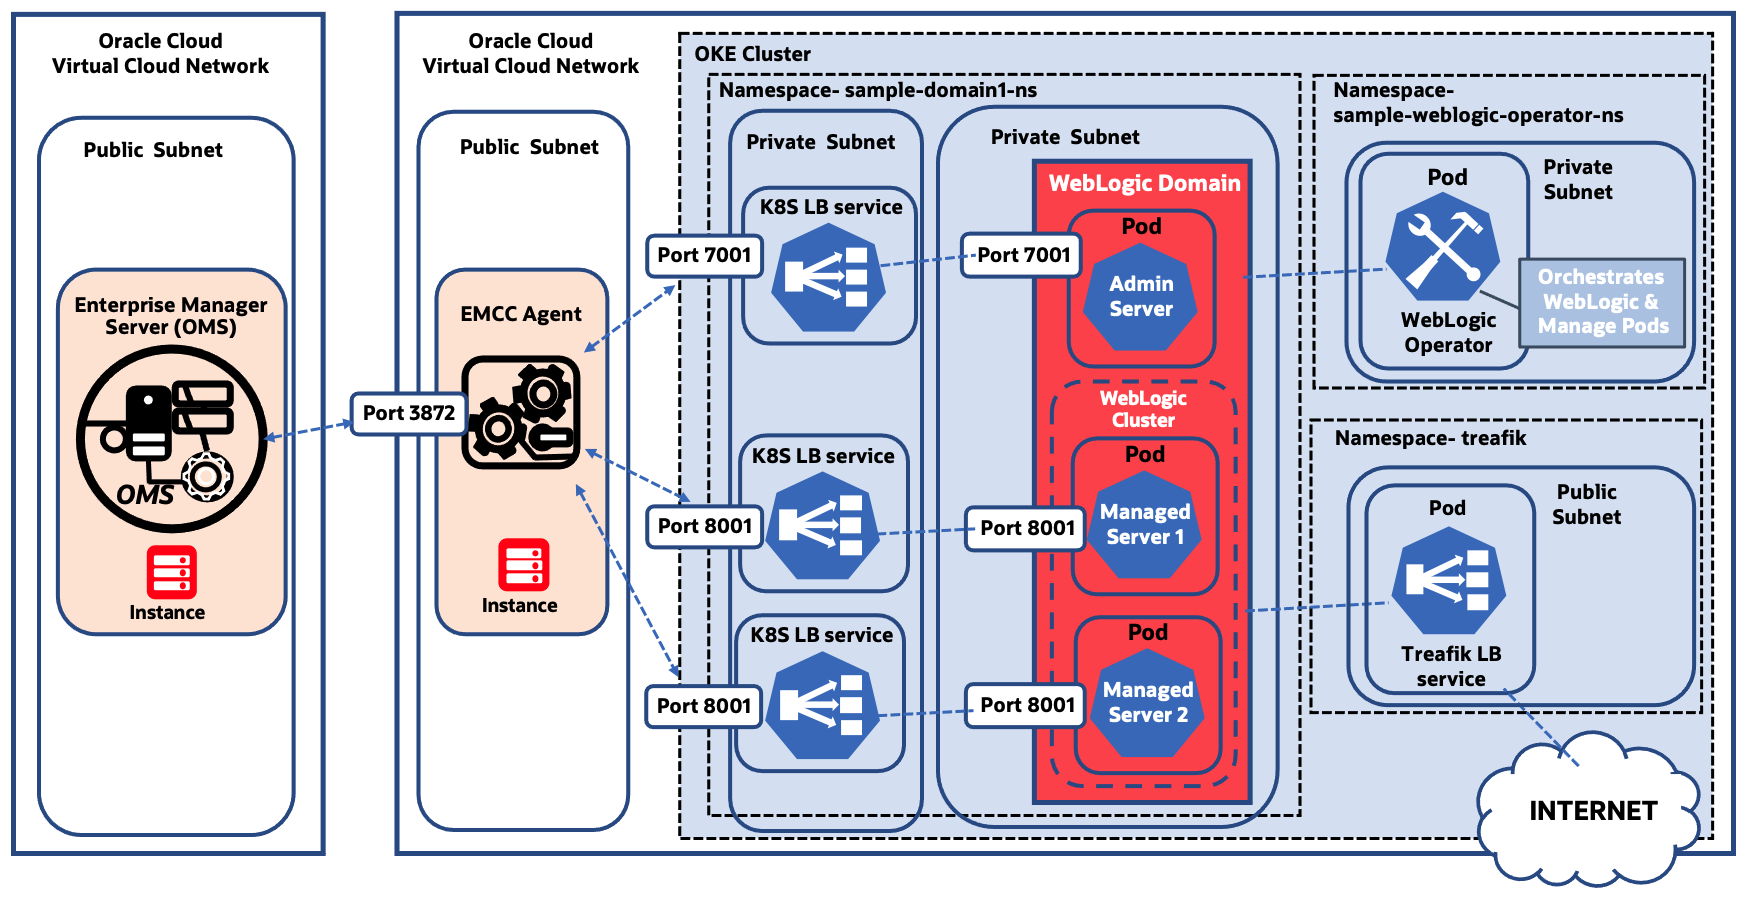
Below is a visual reference of the setup
Limitations
Since EM monitors the WebLogic Servers remotely through the Kubernetes Load Balancer, it is important to know some limitations exist. For example, shell-script-based metrics or file-based metrics cannot be monitored for WebLogic target metrics and configurations. That’s because an EM agent doesn’t exist in the target host in this model, while script or file-based metrics require a local agent.
However, considering that the out-of-box metrics included in the EM’s WebLogic Server management are predominantly JMX based, the method described in this document is considered as an effective monitoring solution to the WebLogic on Kubernetes, when the exceptions are understood. Known limitations when monitoring WebLogic using this model:
- Out-of-the-box WebLogic target metrics are collected only for the JMX-based.
- Corrective actions that need to log on to the target host are not supported.
- WebLogic configurations are collected only for the JMX-based. File-based configurations are not available. E.g., bin/startWebLogicServer.sh or config/config.xml.
- Features that require OMS to log on to the target host are not available. They include starting and stopping WebLogic Servers, patch automation, provisioning and WLST job submission. With respect to the lifecycle management features, it is recommended to use options provided by the WebLogic Kubernetes Operator. Refer to the WebLogic Kubernetes Operator documentation for more details.
- EM features which require OMS to directly log on to the WebLogic administration console are not available. In this model, the agent can log on to the WebLogic admin server, but the OMS cannot. The features include the Logs, JDBC data sources, System MBean Browser, and the options listed under WebLogic Server > Administration menu item. However, you can directly log onto the WebLogic administration console web application to use these features.
- JVM Diagnostics (JVMD) can be set up manually however redeployment is required when the pods are regenerated. For more details see Tutorial 8 in the workshop
By using this method, most of the WebLogic Server target metrics are available to monitor with EM. You can configure alerts to these metrics and receive notifications using the EM’s monitoring functionalities. JVMD can be set up for performance diagnostics, and a limited set of WebLogic configurations are collected. On the other hand, any option that requires OMS to log on to the target host, or to the WebLogic admin console, is not supported.
Conclusions
As more developers and businesses adopt containerized environments like Docker and Kubernetes as platform for new and existing applications, operation teams are struggling to provide observability & management for this new structure. For users who are using WebLogic Kubernetes Operator to manage WebLogic, that struggle can be eliminated using a solution they are already using themselves or have somewhere in their business.
Oracle Enterprise Manager is an on-premises based solution that provides a monitoring solution for Oracle WebLogic Servers deployed on on-premises, in a Kubernetes cluster in the Oracle Cloud, or in other cloud platforms.
Oracle also offers a new cloud service that enables end-to-end, instance level, transaction tracing – Application Performance Monitoring (OCI – APM). This service can be used independently to the solution described above. See this blog: Experience Oracle Cloud Infrastructure Application Performance Monitoring with LiveLabs Workshops and this Livelab: Use OpenTracing for WebLogic on Kubernetes utilizing Oracle Application Performance Monitoring for step by step instructions. More details about this service can be found here: Oracle Application Performance Monitoring