Managing Alarms at Scale with Monitoring Templates in OCI Stack Monitoring
Managing individual alarms across an enterprise can be time-consuming and error prone. OCI Stack Monitoring simplifies this process with Monitoring Templates, allowing you to holistically monitor a complete application stack such as E-Business Suite or an entire fleet of hosts within a single UI. These templates save time and ensure consistency across large-scale environments. Monitoring Templates automatically apply to newly created resources, this reduces manual steps that can easily be missed.
Create Alarm Rules at scale with an Easy-to-Use UI
Traditionally, setting up of alarm rules is done on a per metric basis. Over time, it may become a challenge to manage all the individual alarm rules across different metrics across different resource types. It’s hard to answer the basic question – what alarm thresholds do I have set up for my hosts? Or for my DB systems? Or E-Business Suite (EBS) application? etc. It’s hard to answer this question because you must look at individual alarm rules since there isn’t a way to see these alarm conditions collectively.
Monitoring Templates address these questions by providing a resource-oriented approach to setting up alarms. Begin by specifying the resources, for example, EBS and its components, WebLogic, database, hosts, load balancers, and more. Next, specify all the alarm conditions for these resources, including custom metrics created using Metric Extensions. This provides a one-stop-shop to understand exactly what alarm thresholds have been defined across your app and infrastructure. If alarm settings need to be reviewed or thresholds changed for an EBS application, there’s a single place to do so using this template. Once a Monitoring Template has been defined and applied, Stack Monitoring will take care of creating the necessary alarm rules that OCI Monitoring will use to evaluate and generate alarms.
Quick and seamless setup of alarm rules
With just a few clicks, you can:
-
Create a monitoring template tailored to your stack.
-
Apply comprehensive alarm definitions instantly—whether for a single resource (e.g., WebLogic Server) or an entire infrastructure (e.g., WebLogic Domain/Cluster/servers, hosts, load balancers, databases, and more).
-
Specify notification destination service and topic.
-
Use the intuitive UI to ensure an efficient and hassle-free alarm setup process.
Monitoring Templates simplify and standardize monitoring by including all the necessary alarm rule definitions and notification destination topics to holistically monitor nearly any application or individual resource type. Every metric alarm definition can be customized, this includes the evaluation interval, statistic (mean, max, min, etc.), operator, and both warning and critical thresholds. Another helpful feature is the customizable alarm body. When defining the alarm body, you can provide a link that navigates your engineers directly to the controlled work instruction on how to quickly and appropriately address each alarm based on the specific metric and its severity.
Oracle-certified Monitoring Templates for out-of-the-box resource types provide pre-built alarm definitions
Monitoring Templates can be created from scratch as described above where every resource and metric are individually tailored to meet unique business requirements. To get started faster, leverage the provided Oracle-certified templates. The Oracle-certified template library includes pre-built alarm definitions tailored for various applications and technology stacks, including:
-
Hosts
-
E-Business Suite
-
Concurrent Processing, Notification Mailer, etc.
-
-
PeopleSoft
-
Elasticsearch/OpenSearch, Application Server Domain, PIA, etc.
-
-
GoldenGate
-
Replicat, Extract, Distribution Server, etc.
-
-
WebLogic Domain
-
WebLogic Cluster, WebLogic Server
-
-
Apache Tomcat
-
Oracle Database System
-
Container DB, Pluggable DB, ASM, Cluster, Listener
-
-
SQL Server, and more.
These templates are designed by Oracle experts, leveraging best practices and domain knowledge to deliver comprehensive alarm definitions specific to each resource.
Monitoring Templates are fully customizable to fit unique business needs
While Oracle-certified templates are ready to use as provided out-of-the-box, Stack Monitoring understands that every application stack is unique. Here is how you can customize templates:
-
Add or remove resource types to be included in the template
-
Add or remove specific metrics
-
Adjust pre-set thresholds to align with your unique needs
-
Specify notification destination such as email, Slack, etc.
Begin by creating a blank template and then include Oracle-certified templates (e.g. Container DB, Pluggable DB, Listener, WebLogic, and hosts). When an Oracle-certified templates is added to a blank template, Stack Monitoring will automatically populate the best practice metrics and their thresholds. From there, adjust any metric thresholds and add or remove metrics to the template to meet unique business needs. For example, when monitoring file system utilization, define different thresholds based on the specific filesystem, such as 70% utilized on root, and 90% on/tmp. Next, select the notification destination such as notifications or steaming, then choose the appropriate topic (e.g. production on-call DL, on-call Slack channel). When defining the notification message grouping, it is recommended to select “Split notifications per metric stream”. This will provide seamless integration with Stack Monitoring’s Maintenance Windows feature. Finally, apply any applicable tags to the Monitoring Template (e.g. Oracle-standard, environment, Prod).
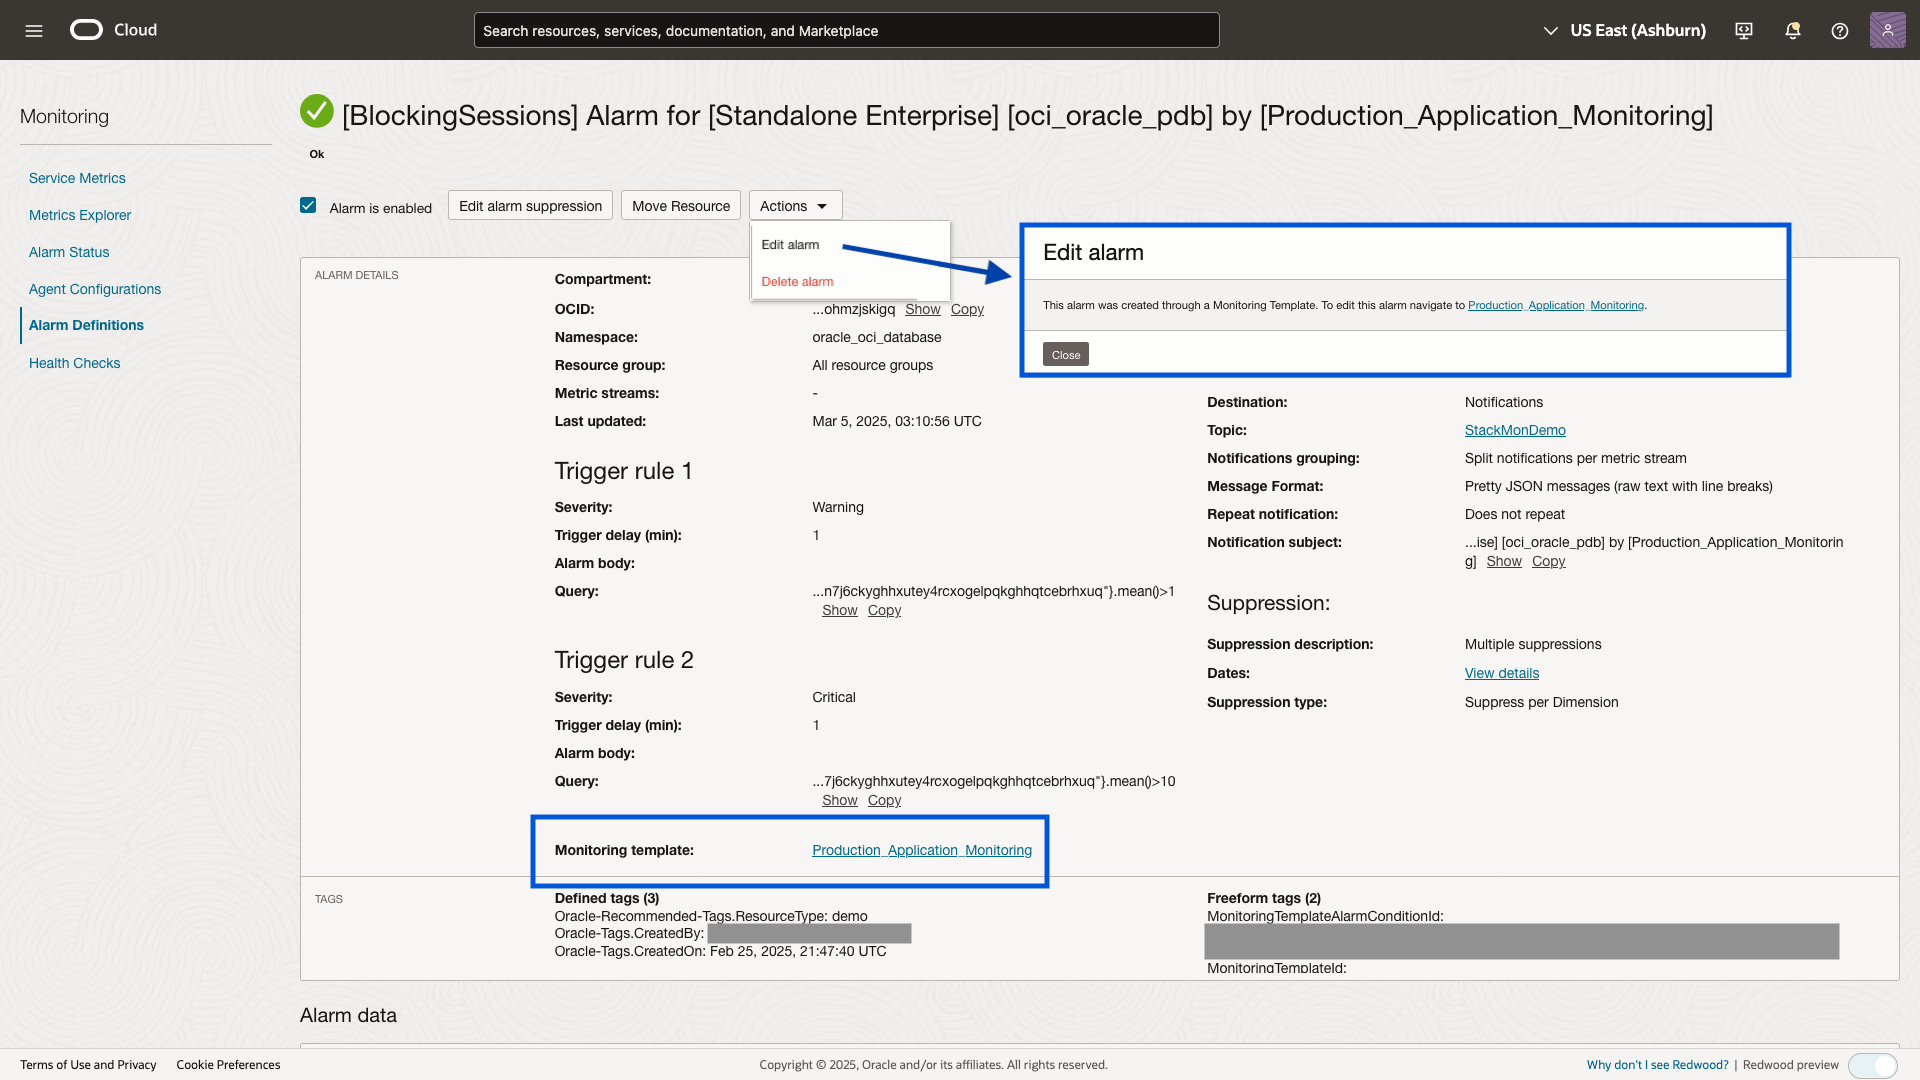
Once a customized template has been created, use the action button to apply the template to the resources included in the template. Once the apply job completes, Stack Monitoring will generate all the alarm rules within OCI Monitoring. The alarm rules definitions created within OCI Monitoring include a direct link back to Monitoring Templates where the alarm rule was created should changes need to be made.
Alarm Management in OCI has never been easier! By leveraging Stack Monitoring’s Monitoring Templates along with Maintenance Windows, you can streamline your monitoring strategy and achieve greater monitoring efficiency at scale. Get started today!
Happy Monitoring!
Resources: