Exciting news for all of you Oracle Cloud manageability fans! Using Application Performance Monitoring (APM), an Oracle Cloud Infrastructure (OCI) native service, Developers, DevOps and application administrators can now truly monitor the end users experience by tracing multiple components and application logic distributed across various clients, third-party services, and backend tiers, in the Cloud or on-premises.
How does Distributed Tracing work?
Application Performance Monitoring collects and processes transaction instance data from pre-defined data sources, open-source tracers, or directly using APIs. The support for OpenTracing, an API and vendor-neutral instrumentation framework, allows application developers to instrument their application code themselves and analyze the trace data in APM.
Distributed Tracing monitors transaction performance, volume, and error rate and helps pinpoint failures or poor performance. It analyzes load, usage patterns, performance, and capacity across out-of-the-box and custom dimensions. This method is particularly well suited for microservices-based applications.
Instrumenting your code
With support for OpenTracing, the possibilities are endless! In this blog we will show you an example of how you can analyze the end-to-end performance of a Python program using APM’s Distributed Tracing capability.
To instrument Python programs and collect timing data, we use the open-source distributed trace system, Zipkin. We integrate Zipkin with our Python programs and in turn Zipkin will trace our Python code and upload this trace data to APM Trace Explorer.
At a high level, here’s how the various components integrate:
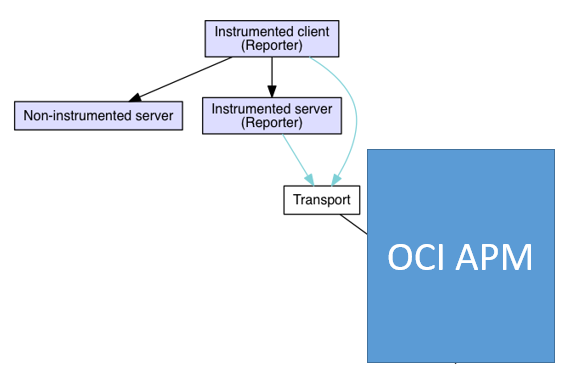
At the code level, here’s how the code is structured:

The configuration steps are simply this:
- Import a customized py_zipkin into the Python code (APM only supports the Zipkin format for now).
- Create an APM Domain using the APM console and note its details (the upload end point and data keys).
- Configure the Zipkin Transport for Python to include the data upload endpoint where trace data will be uploaded.
- Analyze your data in APM Trace Explorer.
When the configuration is complete and your Python program is invoked, Zipkin will automatically send trace data to the selected APM Domain and the traces can be analyzed using the APM Trace Explorer. In addition, the OCI APM Console will allow you to see the overall time taken by the Python program.
Take a closer look at how this was done in this step by step tutorial.
The content of this blog was based on examples created by Ye Wang and Shengjun Zhu of Oracle’s Solution Engineering Hub. Click here to learn about Oracle Solution Engineering Hub..
To learn a lot more about Application Performance Monitoring visit: