Application monitoring involves data sources like traces and logs available in dedicated services like OCI’s Application Performance Monitoring (APM) and Log Analytics. Ultimately, these sources bring visibility to the same stack. Therefore, correlation and integration between sources are critical for holistic monitoring and continuous workflows from one service to another – like combining shards of glass into one window. OCI APM has features to strengthen its correlation and collaboration with other services:
- Log injection: APM Java agents can inject trace and span IDs to Java application server logs. Explore traces in APM and correlate them with logs sharing the same IDs.
- Custom drilldowns: Create dynamic links for spans to drill down to any relevant data in any service outside APM. Use this with, for example, external monitoring or ticketing services and build efficient workflows from APM to other tools.
This blog demonstrates how to take advantage of both features, use the APM Java agent to inject span/trace IDs into logs, and combine it with a custom drilldown as a shortcut to those very same logs in OCI Log Analytics. Familiarity with OCI APM and Log Analytics is assumed.
APM Java Agent Log Injection expedites troubleshooting
Based on distributed tracing, APM collects traces as end-to-end chains of operations known as spans – from a page click, update, or load in a user’s browser to related calls and method executions in the back end. APM’s Java agent captures the spans in Java application servers. All spans and traces have IDs. The APM Java agent can inject these IDs into application server logs. This reveals which traces and spans are related to which logs for quicker troubleshooting.
Log injection is supported for:
- Apache Log4j 1.2, Log4j 2, and Logback
- Java.util.logging
- WebLogic Server Access Logs
- Mapped Diagnostic Context (MDC)
Enabling log injection is straightforward:
- After provisioning and deploying the APM Java agent (more about that here), go to oracle-apm-agent/config/<VERSION>/ProbeConfig.acml
- Make sure the LOG_LIB probe is set to “true” on the list of enabled_probes:
# If you need to disable a particular probe, set the value to false.
enabled_probes:
SERVLET: true
ASYNC_SERVLET: true
JDBC: true
HTTP_CLIENT: true
SPRING: true
CUSTOM: true
JAXRS_SERVER: true
JAXRS_CLIENT: true
SOA: true
INJECTION: true
OSB: true
LOG_LIB: true
- Enable the relevant log injection in the LOG_LIB section of the same file – e.g. to enable WLS access log injection:
LOG_LIB:
[...]
# Configuration for injection into the WLS access log
-
name: "WLS_ACCESS_LOG"
enabled: false ➡️ true
format_string: " {oracle.apm.spanId} {oracle.apm.traceId}"
append: true
[...]
NOTE: Log injection comes with APM Java agent version 1.7. If the log injection probe and section are not visible in ProbeConfig.acml or the version number in the file path is below 1.7, make sure the agent is upgraded (more about that here).
APM Custom Drilldown to Log Analytics
While log injections correlate traces and logs, the custom drilldowns take you straight to those logs using dynamic links. OCI Log Analytics can create a query URL for desired log results (more about searching logs here).
Below is a WebLogic access log with trace and span IDs injected into the Supplemental Detail field in Log Analytics. Click on the IDs and add extended fields to the log source. This way, the IDs are parsed as separate attribute values:
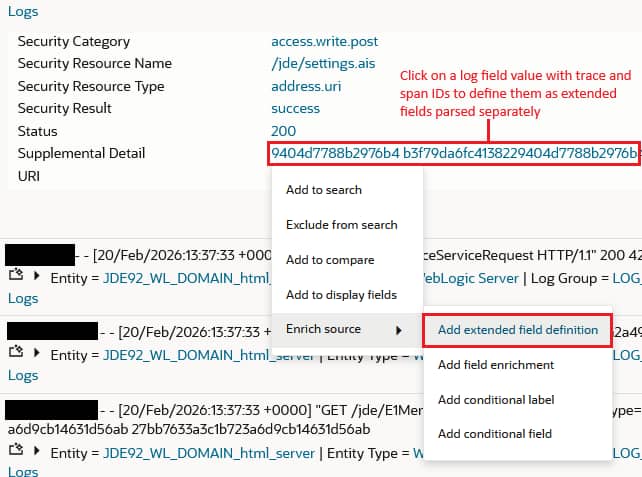
Insert the following extract expression for Trace ID and Span ID:
{Span ID:(\S*)} {Trace ID:(\S*)}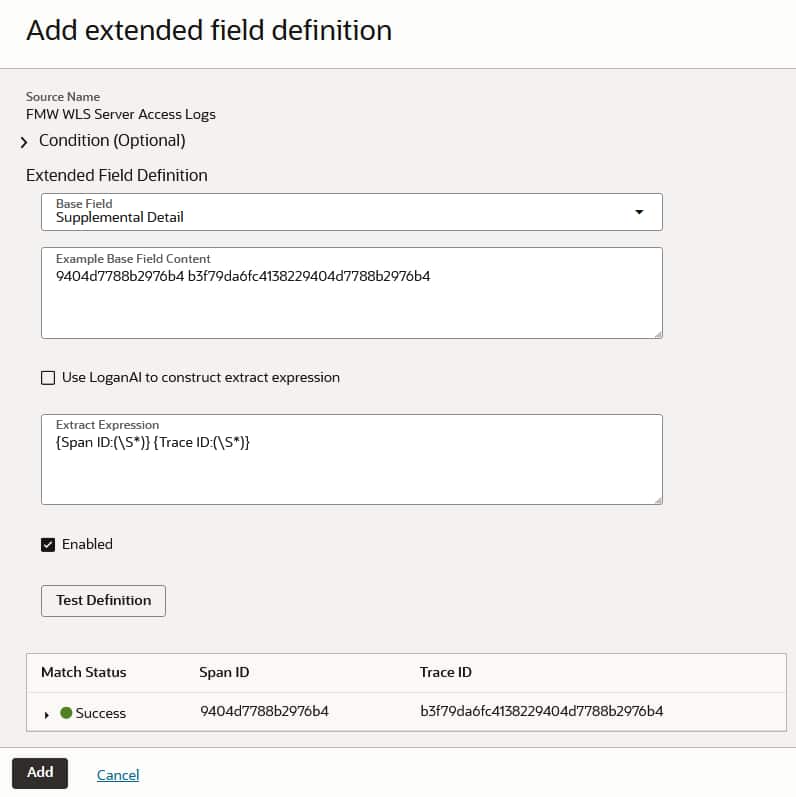
NOTE: If other information is added to Supplemental Detail, the suggested extract expression might unintentionally capture it as Span ID or Trace ID fields. To avoid this, add static text to the format_string in the LOG_LIB configuration of ProbeConfig.acml:
format_string: "spanId={oracle.apm.spanId} traceId={oracle.apm.traceId}"Now, a more specific extract expression can be used for the extended field definition:
spanId={Span ID:(\S*)} traceId={Trace ID:(\S*)}In the Log Explorer, create a query to visualize and group logs as desired. You do not need to add the Span ID or Trace ID log fields as filters to the query. This will be done later when creating the custom drilldown in APM. For this blog, I will use a simple query as an example:
* | stats count as logrecords by ‘Log Source’ | sort -logrecords
When the query is ready, copy the query URL from the Actions-drop down menu:

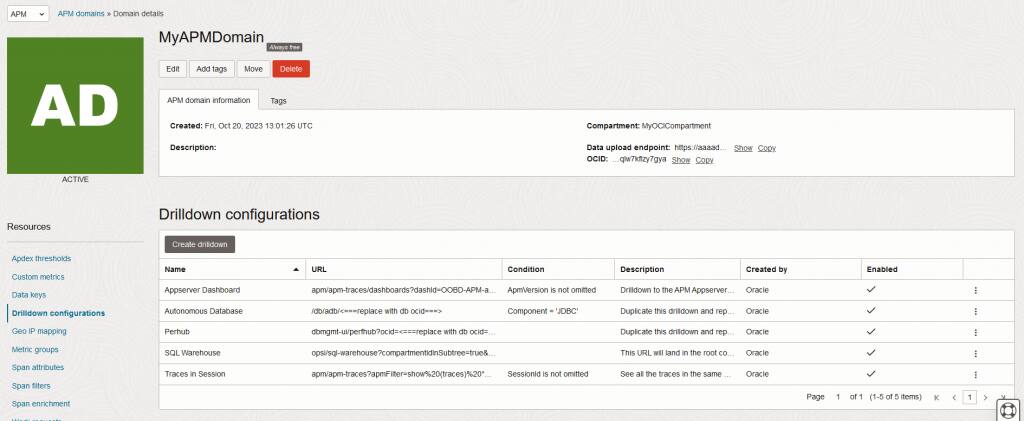
Under Administration in APM, select your APM domain. Then go to Drilldown configurations under Resources. From here, you can manage all drilldowns. Several are already provided out-of-the-box by Oracle, such as:
- Appserver Dashboard: Drill down to the span’s related app server metrics
- Autonomous Database: Drill down to the span’s related SQL ID in the ADB Performance Hub
- Perfhub: Drill down to the span’s related SQL ID in Database Management’s Performance Hub
- Traces in Session: Drill down to all traces belonging to the span’s session in APM’s Trace Explorer
NOTE: Remember to follow the instructions in the description of each drilldown created by Oracle to enable them properly.
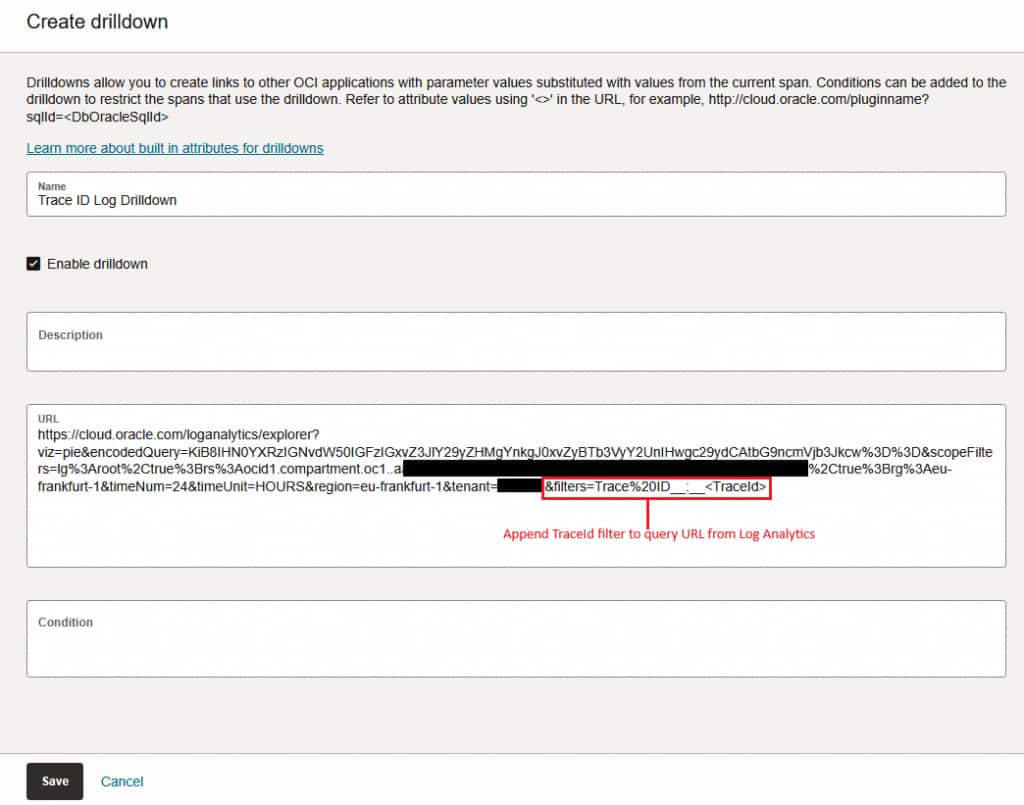
Click Create drilldown to get started. Enter a name for the drilldown and paste the copied query URL from Log Analytics into the URL field. Append the following filter parameter to the URL:
&filters=Trace%20ID__:__<TraceId>Click Save to complete your drilldown:
NOTE: If the drilldown takes place within the OCI tenancy (e.g. from APM to Log Analytics), only the path and query components of the URL are required. In the image above, this would correspond to “/loganalytics/explorer…” and onward. It is of course also possible to use the full URL.
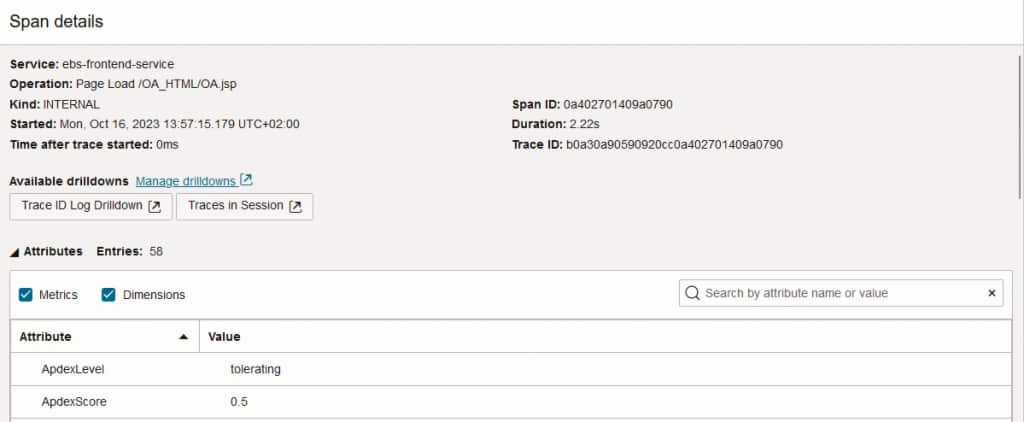
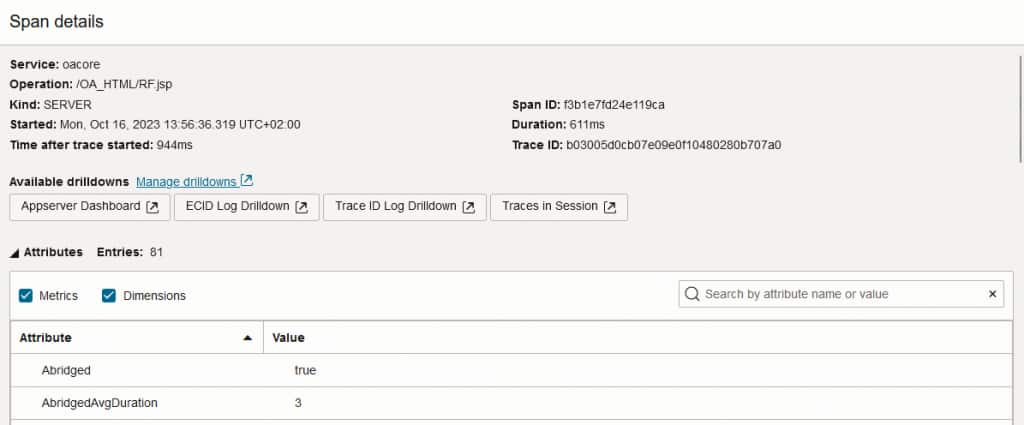
You will see all enabled drilldowns in Span details when investigating data in Trace Explorer. You can use any attribute listed here or under the details of other spans, including TraceId, SpanId, DbOracleSqlId, OkeClusterId, and many others.
Another low-hanging drilldown could be for ECIDs. These are both collected by the APM Java Agent and reported in logs:
Here is another example for drilling down to an error message in Jira:
https://jira.oci.oraclecorp.com/issues/?jql=text ~ "<ErrorMessage>"Conclusion
Enable OCI APM’s application server log injection to create meaningful relations with OCI Log Analytics or other services. Enhance application monitoring and management further with APM’s custom drilldowns to build continuous workflows from APM trace data to other critical tools.
Additional Resources
Get Started with OCI Application Performance Monitoring
Enable the APM Java Agent Log Injection Probe
Create custom drilldowns in APM