Use the App from the Marketplace to save time and automate OCI Management Agent and Logging Analytics configuration
Utilizing the Oracle Cloud Marketplace you can configure OCI Management Agent out of-the-box alarms with pre-defined metrics threshold in just a few clicks. As a best practice, there are several key metrics recommended that should be enabled by default and you can utilize the App from the Cloud Marketplace to configure and start monitoring them. In one step you can set up alarms for all the Management Agents in a compartment and all its sub-compartments which is much easier than perform individual Management Agent configurations in each and every compartment where they reside.
Benefits of using this approach:
- Resource Manager Stacks include metric trigger rules like 70%+ CPU usage, disk usage, agent health status, etc.
- Create alarms for all Management Agents under the tenancy (root compartment) in one step.
- Alarm definitions are created before Management Agents are installed.
- Automatic setup is performed by the OCI Resource Manager and then you just select to enable out-of-the-box alarm configurations and start monitoring immediately.
The App defines these key Management Agent alarms in the Management Agent and pre-defines thresholds for them:
- Agent Availability Alarm
- CPU Usage Alarm
- Disk Space Alarm
- JVM Memory Usage Alarm
The App defines these key Logging Analytics alarms and pre-defines thresholds for them:
- Logging analytics upload data size alarm
- Logging analytics upload failure Alarm
The App creates the following resources in this order:
- Notification Destination topic (if create new option selected) without a subscription.
- Alarm Definitions for the selected metrics. By default, four Management Agent metrics alarms and two Logging Analytics metrics alarms are created.
Architecture
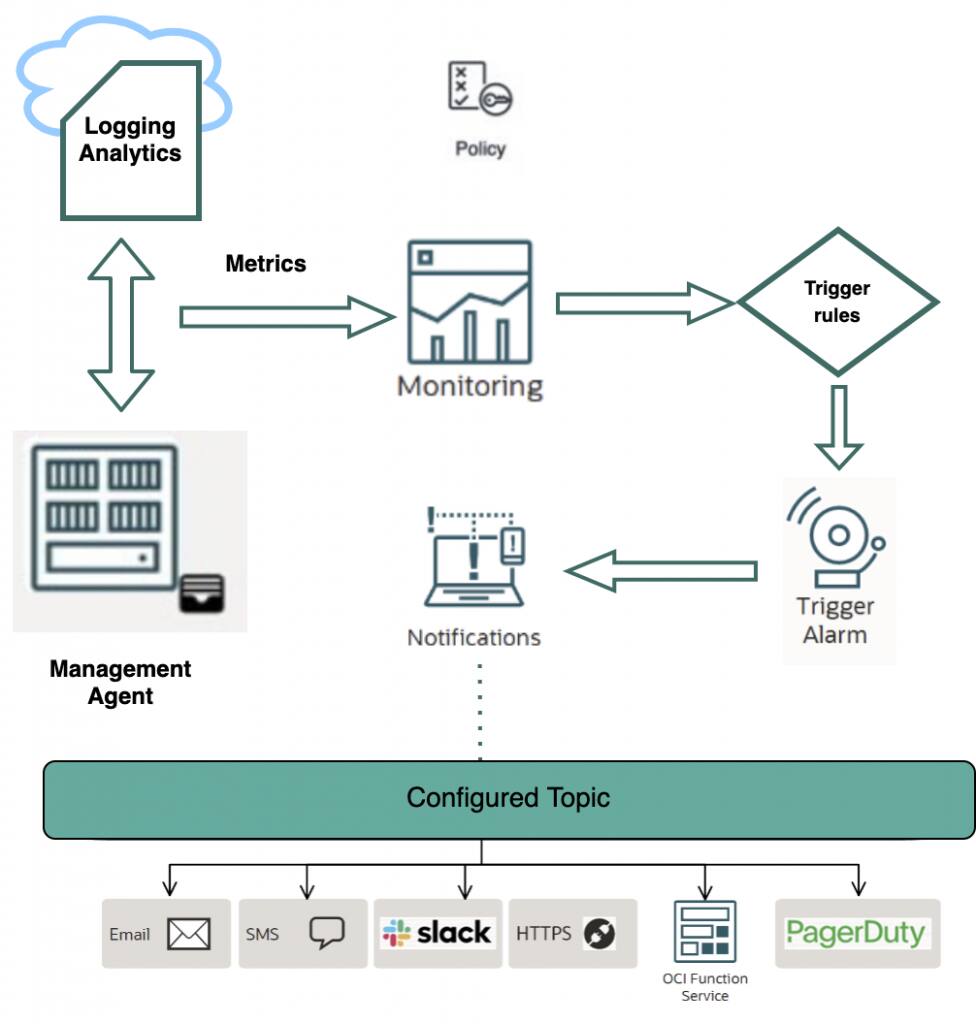
The architecture has these components:
Logging Analytics
Logging Analytics is a service in Oracle Cloud Infrastructure (OCI) that enables you to index, enrich, aggregate, explore, search, analyze, correlate, visualize and monitor log data from your applications and system infrastructure.
Management Agent
Management Agent is a service that provides low-latency interactive communication and data collection between OCI and other sources of data. It is used in the App to collect log data from the Oracle Database ATP instance.
Resource Manager & Stacks
OCI Resource Manager provides a simplified User Interface to execute a collection of Terraform scripts, also known as Stacks. The Resource Manager also provides the ability to perform dry-runs (plan) which is useful to troubleshoot problems and provides the ability to clean up (destroy) resources after they are no longer in use.
Terraform
Is the underlying technology used by the Resource Manager to develop and deploy cloud services as well as infrastructure?
Dynamic Groups & Identity and Access Management Policies
Dynamic groups enable you to group OCI Compute instances or other resources like the Management Agent (in this case) as “principal” actors (similar to user groups). Users create policies for this group to permit principal actors to make API calls against OCI services. Dynamic groups enable the ability to define a set of matching rules to define group members which eliminate having to add members explicitly to the group.
Metrics
Metrics are measurements related to the health, capacity, or performance of a given resource. Resources, services, and applications emit metrics to the OCI Monitoring service.
Monitoring Service
The OCI Monitoring service enables you to actively and passively monitor your cloud resources using the Metrics and Alarms features. The Monitoring service uses metrics to monitor resources and alarms to notify you when these metrics meet alarm-specified triggers.
Alarms
The Alarms feature of the Monitoring service works with the configured destination service to notify you when metrics meet alarm-specified triggers. Alarms passively monitor the resources by using metrics in the Monitoring service.
Notifications
The OCI Notifications service enables you to set up communication channels for publishing messages using topics and subscriptions. When a message is published to a topic, the Notifications service sends the message to all of the topic’s subscriptions.
Prerequisites and required policies to invoke the Resource Manager stack
- User must be part of the Admin group or have permission to invoke the Resource Manager stack.
- User must have permissions or policies to manage management agents, metrics, and notification topics.
Policies
If the executing user is not part of the Admin group, they should have these permissions to invoke the Resource Manager stack. Please refer to this document for more details on creating and managing user groups.
# Policies required to manage stacks and jobs in OCI Resource Manager ALLOW GROUP <User-Group> TO MANAGE orm-stacks IN TENANCY ALLOW GROUP <User-Group> TO MANAGE orm-jobs IN TENANCY # Policies required to read and manage IAM resources ALLOW GROUP <User-Group> TO READ compartments IN TENANCY ALLOW GROUP <User-Group> TO READ tenancies IN TENANCY ALLOW GROUP <User-Group> TO MANAGE dynamic-groups IN TENANCY ALLOW GROUP <User-Group> TO MANAGE policies IN TENANCY # Policies required to manage Management Agents ALLOW GROUP <User-Group> TO MANAGE management-agents IN TENANCY ALLOW GROUP <User-Group> TO READ metrics IN TENANCY # Policies required to create and manage alarms and notification topics ALLOW GROUP <User-Group> TO MANAGE alarms IN TENANCY ALLOW GROUP <User-Group> TO USE ons-topics IN TENANCY |
To restrict policies explicitly to specific compartments, specify <COMPARTMENT_NAME> in place of TENANCY
eg: ALLOW GROUP <User-Group> TO MANAGE ALARMS IN COMPARTMENT <COMPARTMENT_NAME>
Deploying the Stack from the Marketplace app
1. Login into Oracle Cloud
2. From the navigation icon in the upper left (looks like a hamburger) select Marketplace > Marketplace (again) to view all the available Apps
3. Type in the search keywords ‘Management Agents’ to find the ‘Default Alarms for Management Agents’ App
4. Select Stack Version and Compartment
5. Review the Oracle standard terms and Restrictions and then check the ‘I have reviewed and accept’ checkbox
6. Press the blue Launch Stack button
7. Then continue on to the Applying Stack using the Resource Manager section below
Deploying the Stack from Github
Quick Deploy
1. Browse to https://github.com/oracle-quickstart/oci-observability-and-management/o11y-ingestion-monitoring
2. Click on the Deploy to Oracle Cloud button in the README.md section of the page
3. Check “I have reviewed and accept the Oracle Terms of Use” and press Next
4. Continue on to Applying Stack using the Resource Manager section below
Deploy using Source Code
1. Clone the git repository
git clone https://github.com/oracle-quickstart/oci-observability-and-management.git
2. Browse to the o11y-ingestion-monitoring directory
cd o11y-ingestion-monitoring
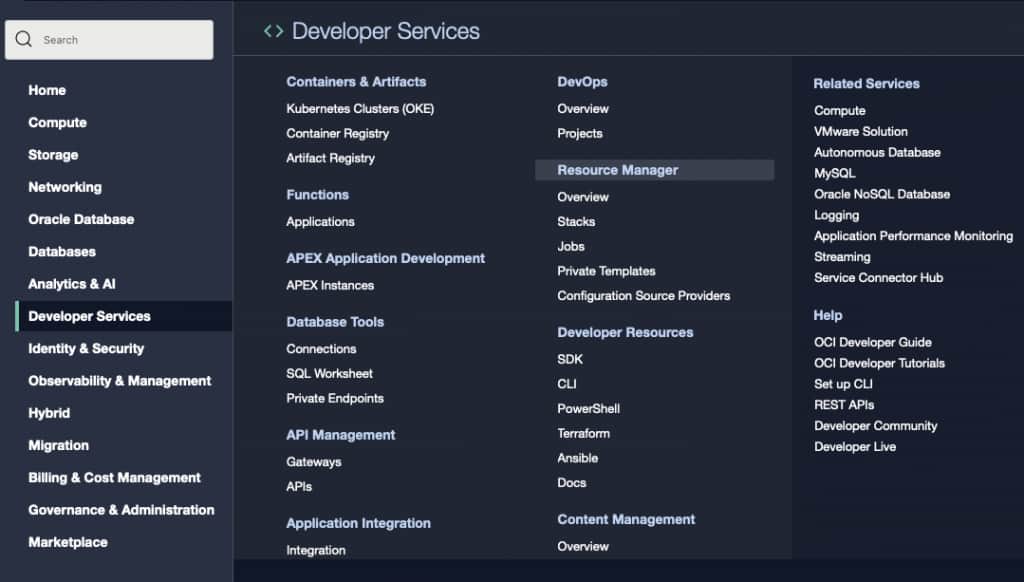
3. From the navigation icon, select Developer Services and then Resource Manager
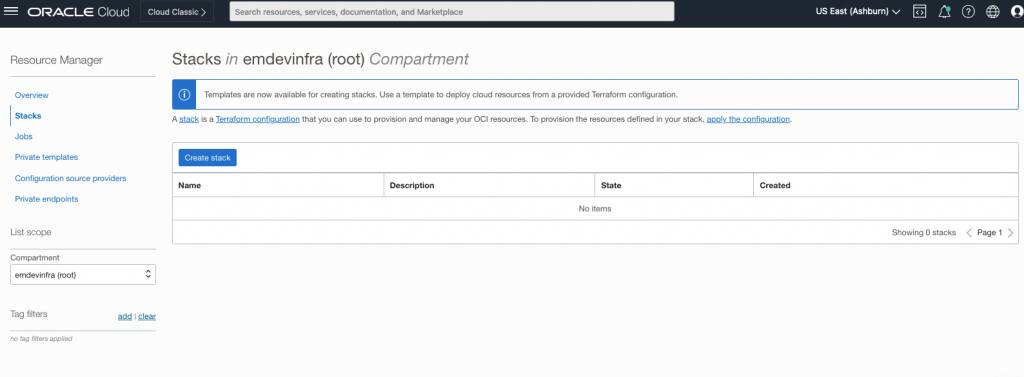
4. Click Stacks from the Resource Manager menu on the left
5. Press the Create Stack button to begin stack creation
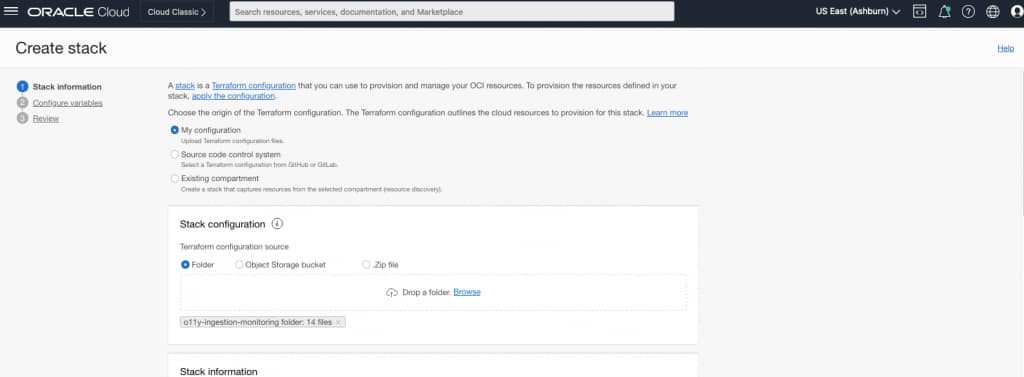
6. Choose My Configuration as the origin of the Terraform configuration
7. Choose Folder as the Terraform configuration source
8. Drag-drop the folder contents in the assigned area
9. Continue to the Applying Stack using the Resource Manager section below
Apply the Stack using Resource Manager
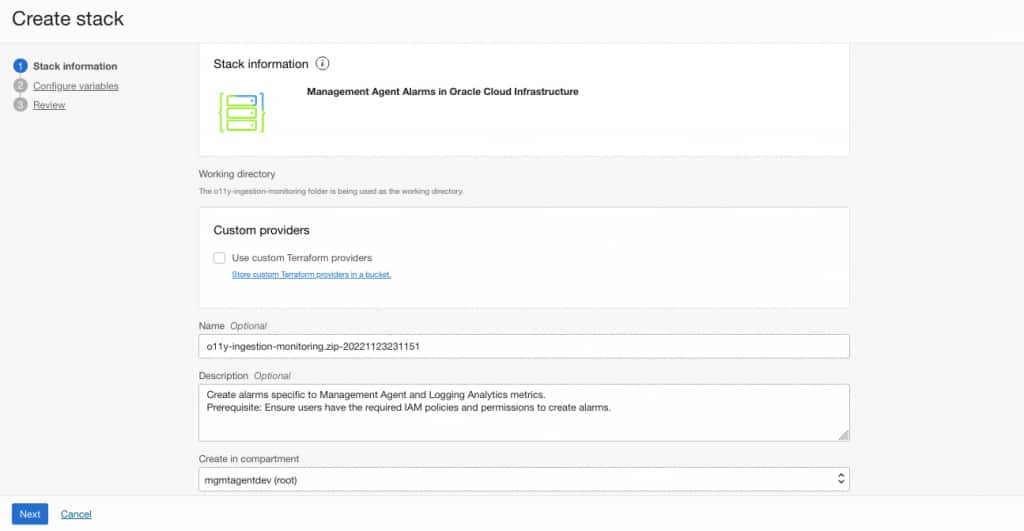
Stack Information section
1. Confirm the Stack Information is correct
2. Name field is populated uniquely identifying the stack
3. Optionally add a description that describes this stacks deployment
4. Select a compartment from the ‘Create in compartment’ drop-down menu
5. Optionally specify namespace tags to organize and track resources
6. Press the blue Next button to advance to the Configure Variables screen
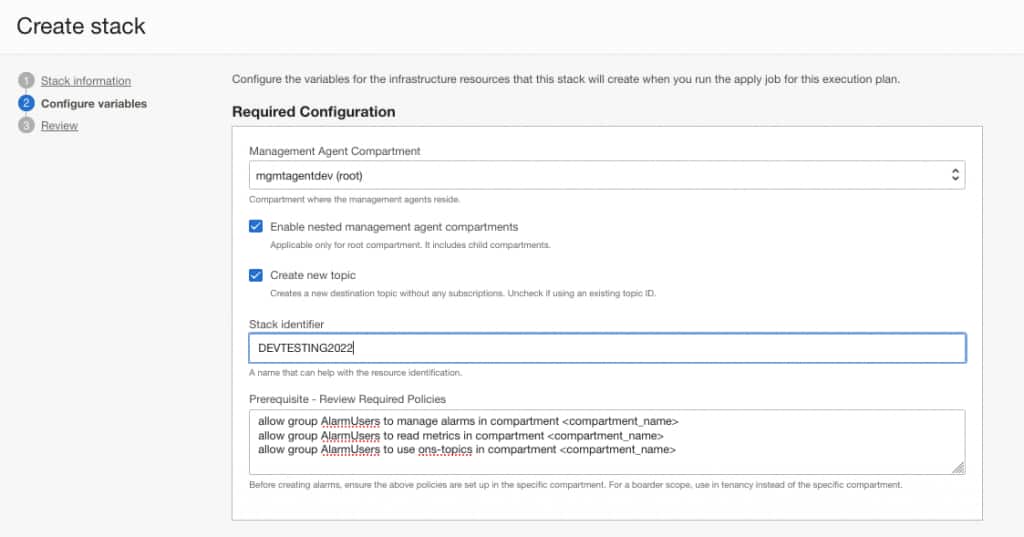
Configure variables section
1. Select the Management Agent Compartment to identify where the Management Agent(s) are installed.
2. If root compartment / tenancy is selected, the ‘‘ checkbox is displayed.
3. Uncheck the ‘‘ checkbox if there are not any agents in sub-compartments to enable monitoring.
4. Using the ‘Create new topic’ checkbox creates a new notification destination topic without any subscriptions.
5. If a notification destination topic was already created, uncheck the ‘Create new topic’.
6. Enter a unique value in ‘Stack Identifier’ to identify the alarms and notification topics that are to be created.
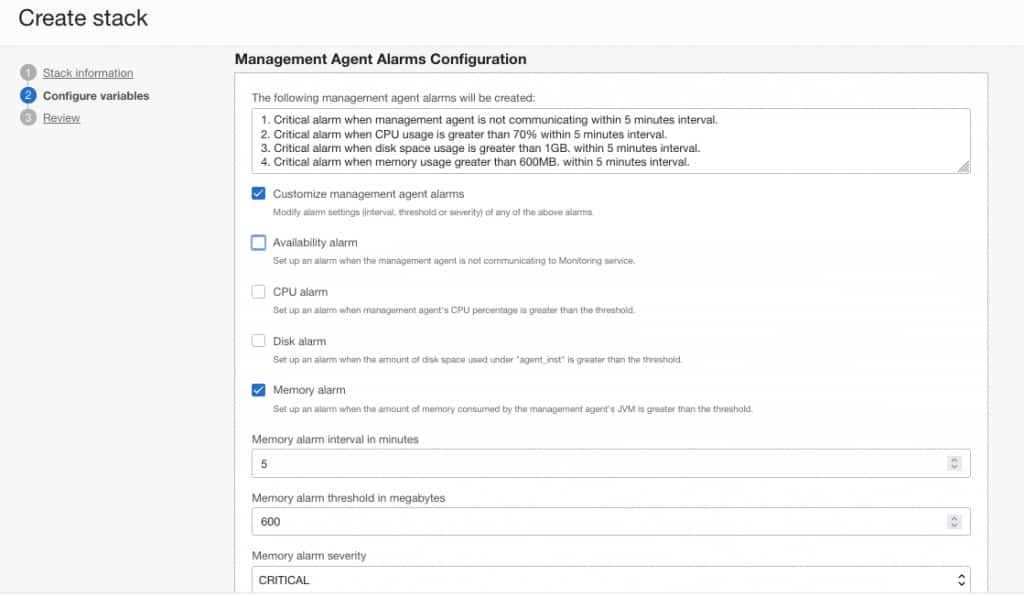
Management Agent Alarms Configuration
1. By default, the stack creates four alarm definitions.
2. Check the ‘Customize management agent alarms‘ checkbox to disable / modify the settings of any alarms.
3. To remove any alarms, uncheck the corresponding alarm checkbox.
4. Modify the interval, threshold, and severity of any alarm if needed.
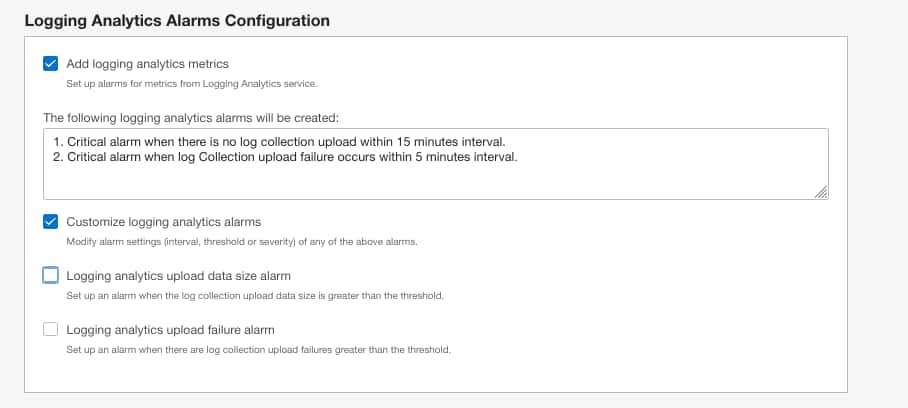
Logging Analytics Alarm Configuration
1. By default the stack creates two alarm definitions specific to Logging Analytics metrics.
2. Uncheck ‘‘ if the alarms are not needed.
3. Check ‘Customize logging analytics alarms’ to remove or modify the settings of any of the alarms.
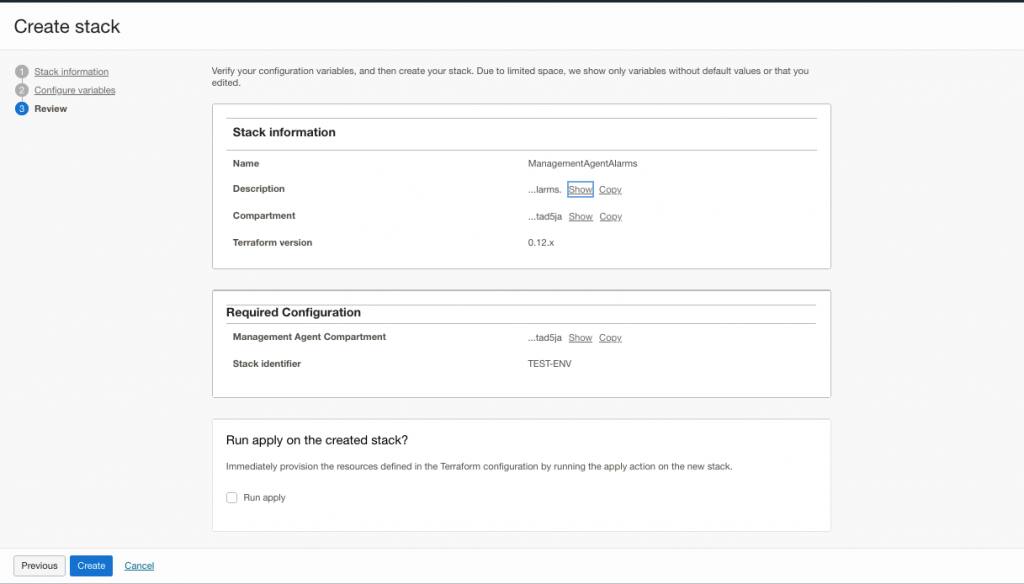
Review Section
1. Review all the information entered is correct and complete.
2. Leave the Run Apply checkbox unchecked at this time.
3. Press the blue Create button to finish creation of the stack.
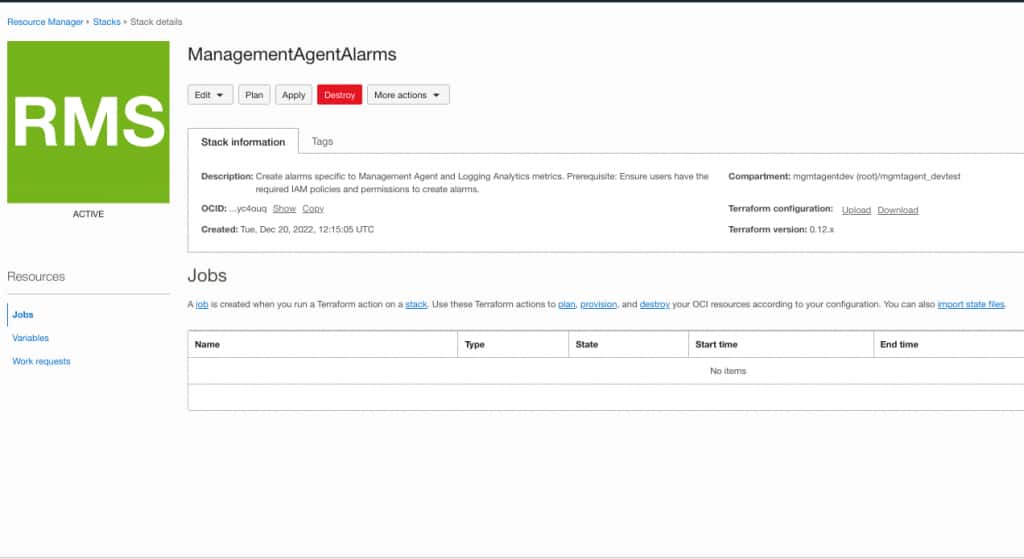
Stack Details and Execution
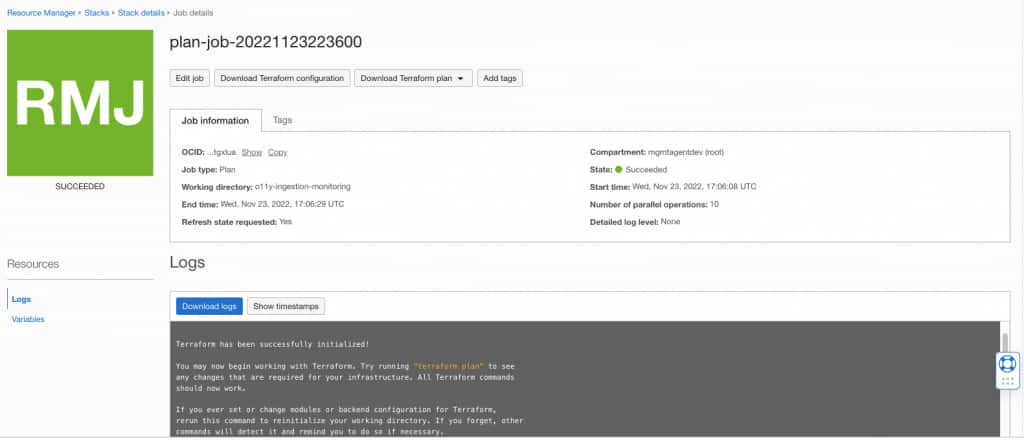
To validate that there will be no issues when applying the steps in the next phase, we recommend running a plan and log verification before performing the Apply.
1. Press the Plan button to create a Plan job.
2. Provide a unique for the Plan job.
3. Press the blue Plan button to execute it.
4. Review the logs section on the same page to ensure there were no problems identified.
5. Select Stack Details tab from the top navigation menu (Resource Manager > Stacks > Stack details).
6. Verify in the Jobs section plan state displays ‘Succeeded’.
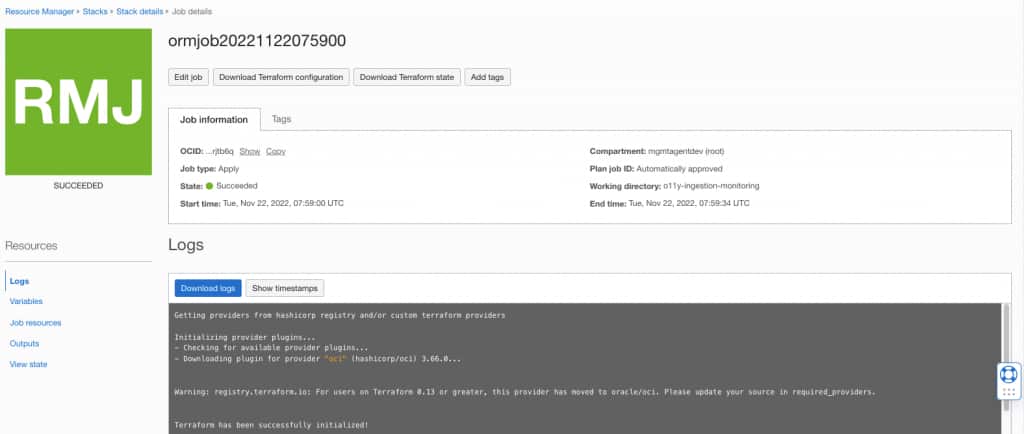
Apply
Next, Apply the stack to create the alarm definitions and bind them to the notification topic.
1. Press the Apply button to create the Apply job.
2. Provide a unique name to identify the Apply job.
3. Keep the Apply Job Plan Resolution to Automatically approve the selected.
4. Press the blue Apply button to execute the Apply job.
5. Review the logs section on the same page to ensure no problems were identified.
6. Verify in the Job Information section that the apply job state displays ‘Succeeded’.
7. Click on Outputs under Resources on the left to view the execution output information.
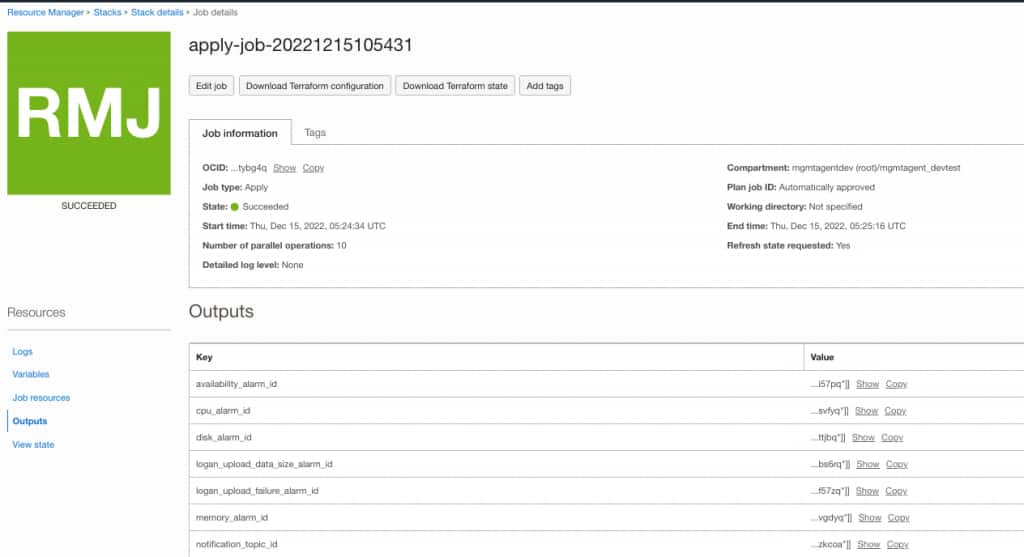
In Summary
You’ve learned how you can use the App in the Oracle Cloud Marketplace to help automate the configuration of Management Agents out of box alarms with pre-defined metrics thresholds. And it is much easier than performing individual Management Agent configuration in every compartment manually. You understand the recommended key metrics to have enabled by default and how monitoring can be started for them whether all the Management Agents are in one compartment or exist also in sub-compartments.
Related Document Links:
Management Agents – https://docs.oracle.com/iaas/management-agents/index.html
Management Agents Metrics – https://docs.oracle.com/iaas/management-agents/doc/agent-metrics.html
Logging Analytics – https://docs.oracle.com/iaas/logging-analytics/index.html
Logging Analytics Metrics – https://docs.oracle.com/en-us/iaas/logging-analytics/doc/administer-other-actions.html
Monitoring Service – https://docs.oracle.com/iaas/Content/Monitoring/Concepts/monitoringoverview.htm
Alarms – https://docs.oracle.com/iaas/Content/Monitoring/Tasks/managingalarms.htm
Notifications – https://docs.oracle.com/iaas/Content/Notification/Concepts/notificationoverview.htm