Cloud Native computing has brought several changes in how services offer their observability and monitoring capabilities. Prometheus is an open-source project that provides system monitoring and alerting capabilities. There is a large and active development community, developing and maintaining exporters with growing product adoption. Prometheus relies on metrics that are exposed either using software that is built with Prometheus client libraries or Prometheus exporters. Oracle Cloud Infrastructure Management Agent (OCI Management Agent) aims to tap into this by offering several capabilities. One of these capabilities is described in this blog.
The Management Agent has added support for collecting metric data from any resource that exposes metric data in the Prometheus format (closely related to the Open Metrics format). Using dashboards in OCI Logging Analytics, customers who already are using Prometheus can now take advantage of OCI functionality like OCI Logging Analytics and can visualize monitoring information from the same tool.
This blog describes how to configure the Management Agent with any Prometheus exporter (or any software that exposes metrics in Prometheus format) to collect metrics data. In this blog, we will use Prometheus Node Exporter to collect OS metrics and ingest them in OCI using Management Agent.
Prerequisite for creating policies for Management Agent
Policies will be needed for ingesting metrics in OCI Monitoring. These policies are described later in the document. As part of the prerequisites for creating policies, ensure that the dynamic group exists for the Management Agent resource.
Create a dynamic group for the Management Agent if it already doesn’t exist, for example, Management-Agent-Dynamic-Group:
ALL {resource.type='managementagent', resource.compartment.id='ocid1.compartment.oc1..aaaaaaaa …mia'}
|
Where: resource.compartment.id is the compartment OCID of the Agent.
Visit the Managing Dynamic Groups documentation on details on how to create a Dynamic Group.
Management Agent set up for monitoring a cloud-native environment with Prometheus Node Exporter
The following set of instructions will guide you through the steps required to set up the agent with a Prometheus exporter. We will use Node/System exporter to demonstrate this. The Prometheus Node Exporter exposes a wide variety of hardware and kernel-related metrics for UNIX/Linux kernels.
Visit the Node Exporter Github link for more details.
- Install and run a Node Exporter on a VM.
- Install and set up a Management Agent on the same VM or on a VM that has access to the Node Exporter’s endpoint. This Management Agent will be configured to scrape metrics from the running Node Exporter.
Install and run a Node Exporter
Download and install the Node Exporter as follows:
# Download tarball for Node Exporter
wget https://github.com/prometheus/node_exporter/releases/download/v*/node_exporter-*.*-amd64.tar.gz
# Untar the downloaded file
tar xvfz node_exporter-*.*-amd64.tar.gz
# Run the Node exporter
cd node_exporter-*.*-amd64
./node_exporter
Executing the above command will result in an output on the terminal that looks like this. This indicates that the exporter is now running and exposing metrics on the default port, 9100:
Node Exporter install output:
INFO[0000] Starting node_exporter (version=0.16.0, branch=HEAD, revision=d42bd70f4363dced6b77d8fc311ea57b63387e4f) source="node_exporter.go:82"
INFO[0000] Build context (go=go1.9.6, user=root@a67a9bc13a69, date=20180515-15:53:28) source="node_exporter.go:83"
INFO[0000] Enabled collectors: source="node_exporter.go:90"
INFO[0000] - boottime source="node_exporter.go:97"
...
INFO[0000] Listening on :9100 source="node_exporter.go:111"
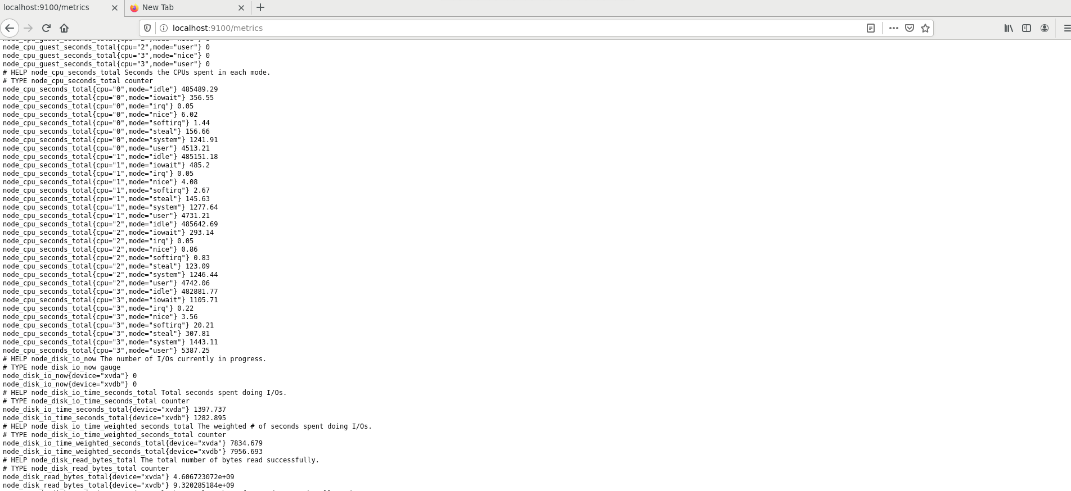
Once the exporter is installed and running, you can verify that the metrics are being exported by visiting http://localhost:9100/metrics
You should see the output similar to this:
Or, you can also run a curl command on the same endpoint to verify metrics being exported:
$ curl http://localhost:9100/metrics
# Output:
# HELP node_cpu_seconds_total Seconds the CPUs spent in each mode.
# TYPE node_cpu_seconds_total counter
node_cpu_seconds_total{cpu="0",mode="idle"} 485489.29
node_cpu_seconds_total{cpu="0",mode="iowait"} 356.55
node_cpu_seconds_total{cpu="0",mode="irq"} 0.05
node_cpu_seconds_total{cpu="0",mode="nice"} 6.02
node_cpu_seconds_total{cpu="0",mode="softirq"} 1.44
node_cpu_seconds_total{cpu="0",mode="steal"} 156.66
node_cpu_seconds_total{cpu="0",mode="system"} 1241.91
node_cpu_seconds_total{cpu="0",mode="user"} 4513.21
node_cpu_seconds_total{cpu="1",mode="idle"} 485151.18
node_cpu_seconds_total{cpu="1",mode="iowait"} 485.2
Install and set up the Management Agent to register agents with Oracle Cloud Infrastructure
This lists the high-level steps for installing and setting up the Management Agent. Visit this link for detailed instructions on workflow for Installing Management Agent and other prerequisites. The prerequisites cover all the policies needed to successfully register the agent with OCI.
Once you have the Management Agent RPM downloaded, install the agent by running the command as shown below:
$ sudo rpm -ivh oracle.mgmt_agent.rpm
Password:
Preparing... ################################# [100%]
Checking pre-requisites
Checking if any previous agent service exists
Checking if OS has systemd or initd
Checking available disk space for agent install
Checking if /opt/oracle/mgmt_agent directory exists
Checking if 'mgmt_agent' user exists
'mgmt_agent' user already exists, the agent will proceed with installation without creating a new one
Checking Java version
JAVA_HOME is not set or not readable to root
Trying default path /usr/bin/java
Java version: 1.8.0_302 found at /usr/bin/java
Checking agent version
Updating / installing...
1:oracle.mgmt_agent-211108.1722-1 ################################# [100%]
Executing install
Unpacking software zip
Copying files to destination dir (/opt/oracle/mgmt_agent)
Initializing software from template
Checking if JavaScript engine is available to use
Creating 'mgmt_agent' daemon
Agent Install Logs: /opt/oracle/mgmt_agent/installer-logs/installer.log.0
Setup agent using input response file (run as any user with 'sudo' privileges)
Usage:
sudo /opt/oracle/mgmt_agent/agent_inst/bin/setup.sh opts=[FULL_PATH_TO_INPUT.RSP]
Agent install successful
As instructed by the above install output, set up the agent by running:
$ sudo /opt/oracle/mgmt_agent/agent_inst/bin/setup.sh opts=/scratch/input.rsp
Executing configure
Parsing input response file
Validating install key
Generating communication wallet
Generating security artifacts
Registering Management Agent
Starting agent...
Agent started successfully
Agent setup completed and the agent is running.
In the future agent can be started by directly running: sudo systemctl start mgmt_agent
Please make sure that you delete /scratch/input.rsp or store it in a secure location.
Once the Management Agent is installed and set up correctly, verify that the agent is up and running by executing the status command:
# Output:
mgmt_agent.service - mgmt_agent
Loaded: loaded (/etc/systemd/system/mgmt_agent.service; enabled; vendor preset: disabled)
Active: active (running) since Mon 2021-11-08 09:53:48 PST; 19min ago
Process: 67740 ExecStart=/opt/oracle/mgmt_agent/agent_inst/bin/agentcore start sysd (code=exited, status=0/SUCCESS)
Main PID: 67818 (wrapper)
Memory: 376.7M
CGroup: /system.slice/mgmt_agent.service
├─67818 /opt/oracle/mgmt_agent/agent_inst/bin/./wrapper /opt/oracle/mgmt_agent/agent_inst/bin/../config/wrapper....
└─67836 /usr/lib/jvm/java-1.8.0-openjdk-1.8.0.302.b08-0.el7_9.x86_64/jre/bin/java -Dorg.tanukisoftware.wrapper.W...
Nov 08 09:53:35 systemd[1]: Starting mgmt_agent...
Nov 08 09:53:35 agentcore[67740]: Starting mgmt_agent...
Nov 08 09:53:43 agentcore[67740]: Waiting for mgmt_agent..........
Nov 08 09:53:48 agentcore[67740]: .....running: PID:67818
Nov 08 09:53:48 systemd[1]: Started mgmt_agent.
In addition, the Management Agent UI can verify that the agent is active and able to talk to OCI.
Note: If the policies are not set correctly, the agent will appear silent.
Configuring the Management Agent to collect metrics using Prometheus Exporter
The agent’s scraping of Prometheus metrics is triggered by the configuration files placed in the agent’s detection-directory (the detection directory is /opt/oracle/mgmt_agent/agent_inst/discovery/PrometheusEmitter/). Name the configuration files appropriately: the base name of the file should be indicative of the metrics scraped, the extension of the file should be .properties. Each line of the file is a name/value pair (format: propertyName=propertyValue). The presence of a file in the detection-directory indicates the current settings for the monitoring/scraping – keep the file in the directory, unchanged, as long as the monitoring is needed.
The comments in the configuration file are ignored by the agent and are any lines starting with the hashtag (#) character.
Create a configuration file to scrape metrics
In order to scrape all metrics exposed by node_exporter to namespace poc_prometheus, specifying nodeName as a dimension on every metric datapoint, create a file as shown here. Replace the IP address with the IP Address or a resolvable hostname where the node exporter is running.
Example 1
$ cat /opt/oracle/mgmt_agent/agent_inst/discovery/PrometheusEmitter/nodeVM1-ol7.properties
# property file scraping all metrics of the node_exporter that has been set up on 10.20.30.40
url=http://10.20.30.40:9100/metrics
namespace=poc_prometheus
nodeName=nodeVM1-ol7
metricDimensions=nodeName
allowMetrics=*
compartmentId=ocidl.compartment.ocl..aaaaaaaa...kovd6xlq
The agent will process this configuration file in a few minutes after you place it in the detection directory (/opt/oracle/mgmt_agent/agent_inst/discovery/PrometheusEmitter/) and the metrics will then start flowing to OCI Monitoring.
Policies for the Management Agent resource to post metrics to OCI Monitoring service
Make sure you have the policies in place for the Management Agent resource to post metrics to the OCI Monitoring service in the compartment that you have chosen (compartmentId property) in the above configuration file. If the policies are not set up or are incorrect, you will see HTTP 404 NotAuthorized error messages in the Agent logs.
The required policies are specified in the Pre-requisites section of this document.
The following policy statement will allow the agent to post the metrics collected through the configuration file mentioned above
allow dynamic-group Management-Agent-Dynamic-Group to use metrics in compartment <PROMETHEUS METRIC COMPARTMENT> where target.metrics.namespace = ‘poc_prometheus’
Note:
- The compartment should be the name of the compartment whose OCID you have used in the above property file.
- The namespace must match what you have used in the above property file.
You will need to restart the agent before the policy changes will be applied to the agent.
Management Agent Optional and Advanced Configuration Properties to collect metrics using Prometheus exporter
Configuration Properties
Required Properties:
There are three required properties in the configuration file.
| Name |
Meaning |
| url |
The url through which the Prometheus Exporter publishes its metrics. (http only) |
| namespace |
The OCI monitoring namespace to which scraped metrics should be uploaded. |
| compartmentId |
The OCID of the compartment to which the scraped metrics should be uploaded |
Optional Properties:
Several optional properties can be added to the configuration file.
| Name |
Units/Format |
Meaning |
| metricDimensions |
comma-separated property name list |
The names of other user-supplied properties expressed as fixed values to be used as dimensions for every uploaded datapoint. |
| allowMetrics |
comma-separated metric name list |
The complete set of desired scraped metrics. Use this to limit the set of metrics uploaded if necessary. |
Optional Advanced Properties:
These are advanced properties if you need to fine-tune your configuration.
| Name |
Units/Format |
Meaning |
| scheduleMins | minutes | Scheduling interval in minutes for collecting the metrics. Default value is 5 minutes. Minimum value allowed is 1 minute. Scheduling the collection to happen frequently can have an impact on the CPU. |
| resourceGroup | string | If this property is specified then the resource group will be assigned to each of the emitted metrics. A valid resourceGroup value starts with an alphabetical character and includes only alphanumeric characters, periods (.), underscores (_), hyphens (-), and dollar signs ($). |
| proxy-url |
url |
The url of the network proxy that provides access to the Prometheus Exporter’s endpoint (url required property). |
| connection-timeout |
milliseconds/number |
The timeout for connecting to the Prometheus Exporter’s endpoint. |
| read-timeout |
milliseconds/number |
The timeout for reading the response from the Prometheus Exporter’s endpoint. |
| read-data-limit |
kilobytes/number |
The limit on the data being sent, not to exceed the agent’s fixed limit of 400 (KB). |
Creating an OCI Logging Analytics Dashboard to visualize metrics from the same tool
Once you have all the above setup ready, create a dashboard in OCI Logging Analytics to visualize the metrics. In OCI Logging Analytics, create a Dashboard by adding a Metric Source Data and choosing the Compartment, Metric namespace as provided to the Management Agent while setting up the property file. Then, select the metrics that you want to chart.
Note that the Compartment id is specified in the property file whereas its equivalent Compartment name is in the OCI Logging Analytics Dashboard.
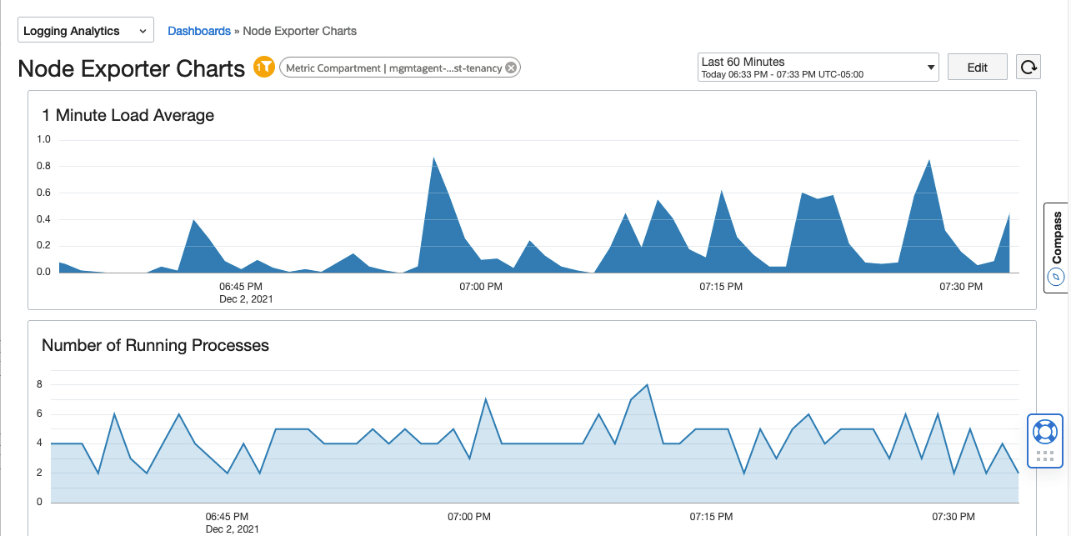
This is an example of a dashboard that shows a chart for metric node_load_1 (1 Minute Load average)
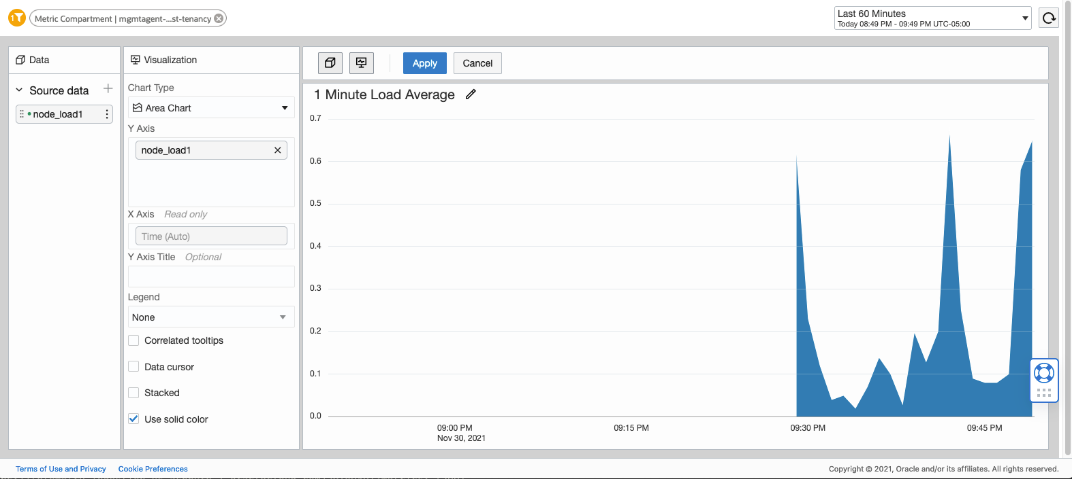
Once you Apply the changes, it will appear in the dashboard as shown here.
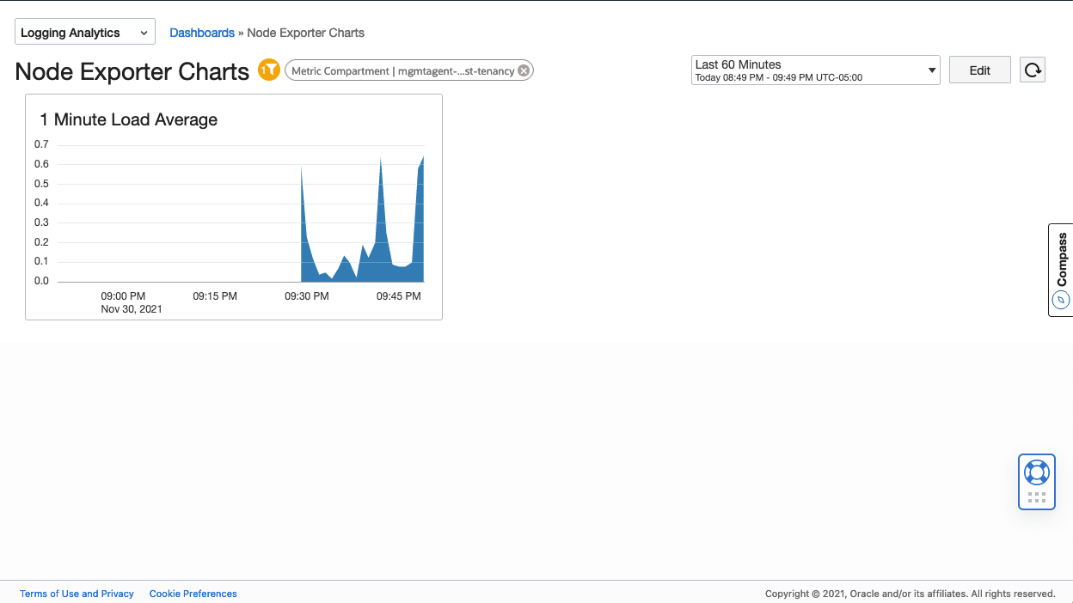
The following example shows the dashboard that was created with 2 metrics:
- node_load_1
- node_procs_running
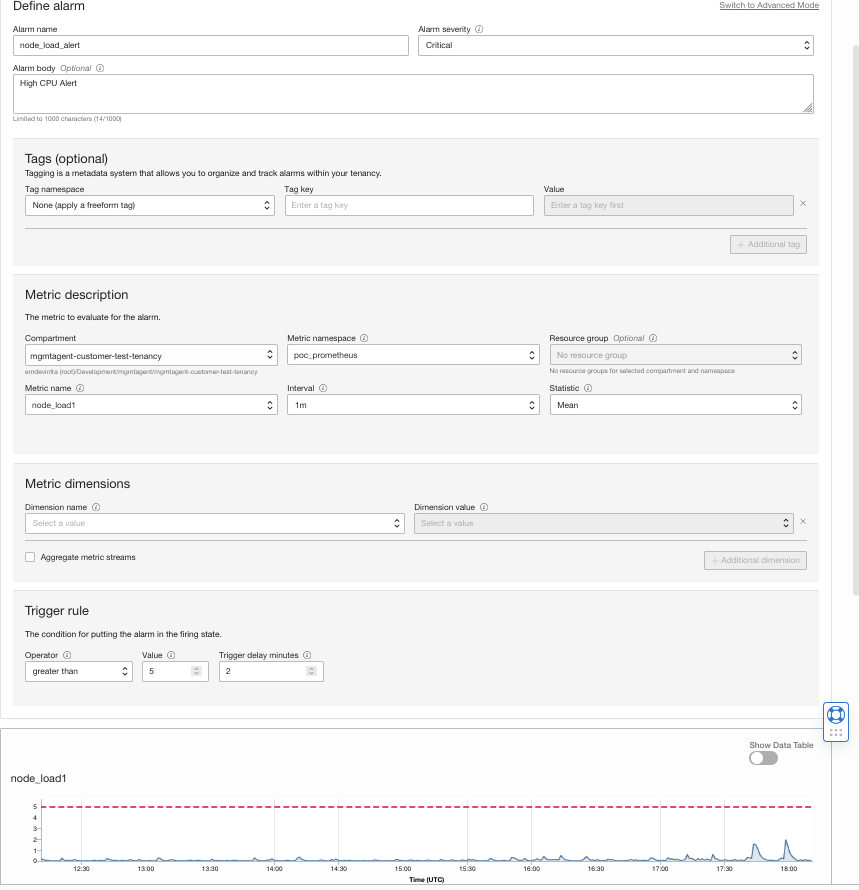
Setting alarms on metrics in OCI Monitoring
You can start setting alarms on any of the scraped metrics. The following screen shows how to create an alarm on the node_load_1 (1 Minute Load Average) when the value reaches a load average of 5.
Resources
OCI Management Agent documentation – more details on concepts, setup, configuration, installation, and usage
Prometheus Emitters documentation – details about configuring Management Agents to collect metrics from Prometheus Emitters