MySQL observability is essential in modern enterprises, whether you run a few critical databases or operate at massive scale. With the right real‑time monitoring, teams reduce MTTD/MTTR, avoid cascading failures, and continuously track workload health—CPU, memory, I/O, buffer pool efficiency, session contention, transaction/replication lag, error rates, and query latency.
This Grafana monitoring template helps teams understand how to add practical MySQL observability by extracting advanced signals from each target’s performance_schema and information_schema, persisting them in a dedicated repository MySQL database (repo DB), and visualizing them through actionable Grafana dashboards. Beyond the out‑of‑the‑box views, it also provides a foundation teams can extend to build custom, application‑specific observability for their own workloads
👉 Full documentation:
https://github.com/tripplea-sg/mysql-heatwave-grafana-monitoring/tree/main/docs
🔍 Why Monitoring Matters
Regardless of where MySQL runs, HeatWave or on-premise, the need is the same: clear visibility into system behaviour. You need to understand how queries perform, how resources are consumed, and how the system behaves over time. Without this, troubleshooting becomes reactive and performance tuning becomes guesswork.
A well-designed monitoring solution turns database activity into actionable insight, enabling faster decisions and more stable operations.
🏗️ Architecture: Centralized Metrics Repository
This solution is designed around a centralised monitoring model, which is a key differentiator. Instead of Grafana connecting directly to each MySQL target, metrics are first collected by custom collectors and stored in a central MySQL repository database. The architecture works as follows:
- Grafana → Connects to the repository database for visualisation
- MySQL Targets (HeatWave / On-Premise) → Source systems
- Custom Collectors → Extract and push metrics
- Repository MySQL Server → Stores all monitoring data
This means: Grafana only needs one MySQL data source (the repository), targets are decoupled from visualisation, and monitoring scales more easily across many systems. Optionally, you can add: OCI Metrics Data Source → For infrastructure-level metrics (HeatWave only)
⚙️ Installation: Fast and Straightforward
👉 Step-by-step guide:
https://github.com/tripplea-sg/mysql-heatwave-grafana-monitoring/blob/main/docs/0-Installation.md
The installation process is intentionally simple. You install the monitoring package, set up Grafana, install MySQL as repository database for metric data, and deploy dashboards, all within 6 minutes.
sudo yum install -y https://github.com/tripplea-sg/mysql-heatwave-grafana-monitoring/raw/main/releases/mysql-monitor-3.1-1.el9.noarch.rpm

install_grafana

deploy_grafana_dashboard

sudo dnf downgrade grafana-12.4.1-1
Once installed, Grafana is initialised and dashboards are deployed using built-in commands. Minimal database permissions are then granted to enable secure, read-only access for monitoring.
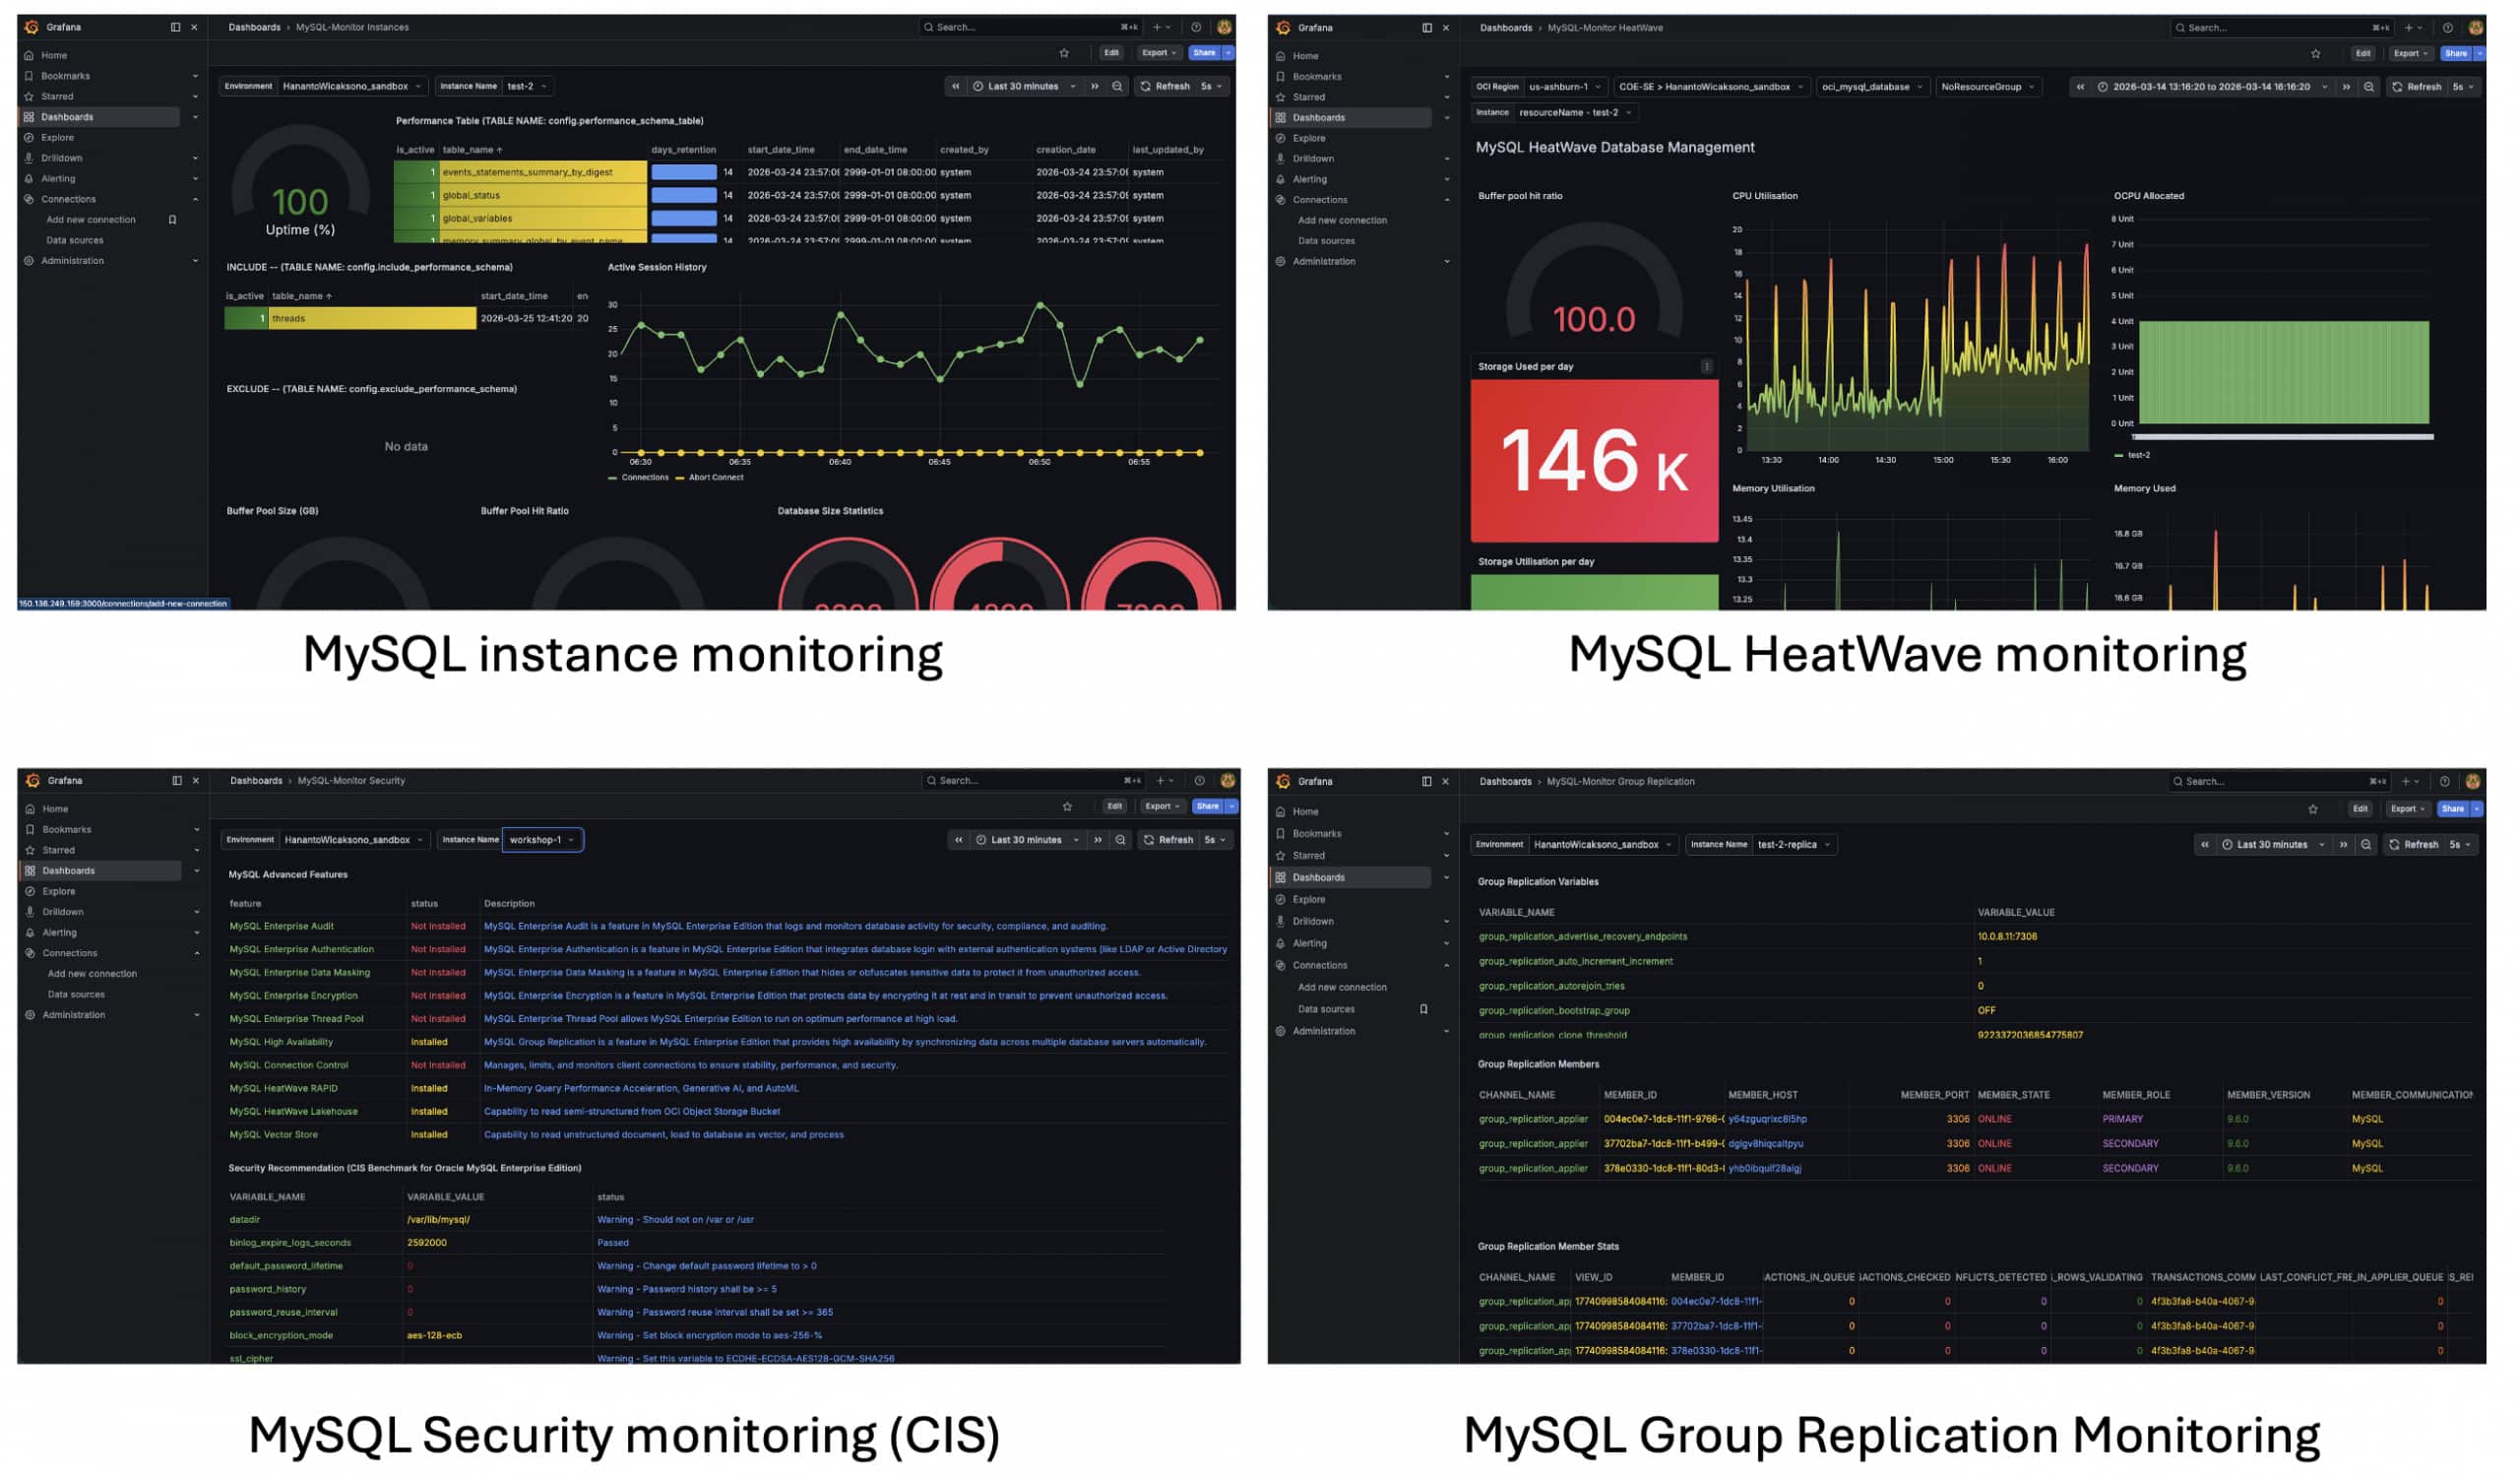
📊 Built-in Dashboards: Immediate Value
👉 Dashboard walkthrough:
https://github.com/tripplea-sg/mysql-heatwave-grafana-monitoring/blob/main/docs/4-Walkthrough%20Your%20New%20Grafana%20Dashboard.md
As you watch the video, the solution includes prebuilt Grafana dashboards, so you can start monitoring immediately. These dashboards provide:
- Clear system overviews
- Drill-down analysis for queries and resources
- Time-series visualization for trends
- Filtering across environments
They are ready to use out of the box and can also be customized as your needs evolve.
⚡ Why This Approach Works
This architecture avoids common limitations of direct database monitoring. Instead of connecting Grafana to each MySQL instance:
- Data collection is centralised
- Visualisation is simplified
- Systems are loosely coupled
This results in better scalability across many databases, reduced load on production systems, and easier management of monitoring configurations
🛠️ Day-to-Day Operations Made Simple
👉 Command reference:
https://github.com/tripplea-sg/mysql-heatwave-grafana-monitoring/blob/main/docs/2-Start%2C%20Stop%2C%20Show%20status%20and%20logs.md
Operational control is handled through a small set of commands to start all stacks:
sudo systemctl start mysqld
sudo systemctl start grafana-server
sudo systemctl start mysql-monitor.timer
sudo systemctl start mysql-uptime.service
To stop all stacks:
sudo systemctl stop mysql-uptime.service
sudo systemctl stop mysql-monitor.timer
sudo systemctl stop grafana-server
sudo systemctl stop mysqld
To monitor the status or catch error
journalctl -u mysql-monitor.service -n 50 -f
journalctl -u mysql-uptime.service -n 50 -f
Those commands manage the collector and monitoring services, ensuring that data continues to flow into the repository database.
🧩 Scaling Across Environments with Control Fleet
👉 Control Fleet details:
https://github.com/tripplea-sg/mysql-heatwave-grafana-monitoring/blob/main/docs/3-Working%20with%20Control%20Fleet.md
As your environment grows, monitoring multiple databases individually becomes inefficient. Control Fleet enables centralised management of multiple MySQL targets. It allows you to define monitoring configurations once and apply them across environments. Because all data is stored centrally, scaling to dozens or hundreds of targets becomes much easier.
⏱️ Advanced Scheduling for Efficient Monitoring
Control Fleet also introduces advanced scheduling for data collection. Instead of collecting all metrics at fixed intervals, you can control:
- What collection metric to collect globally, what collection metric to collect for some MySQL instances, and what collection metric to avoid for some MySQL instances.
- When collection runs and how frequently it executes
- Which workloads require higher granularity
This allows you to: increase visibility during peak periods, reduce overhead during off-peak times, and optimise storage and performance. At scale, this flexibility becomes essential.
☁️ Optional: Extending with OCI Metrics
👉 OCI setup guide:
https://github.com/tripplea-sg/mysql-heatwave-grafana-monitoring/blob/main/docs/1-Setup%20Oracle%20Cloud%20Infrastructure.md
For MySQL HeatWave on OCI, you can optionally integrate OCI Monitoring metrics. In this case: Grafana uses an additional OCI data source to include infrastructure metrics (CPU, network, etc.) complement database metrics.
This provides a full-stack monitoring view, but is not required for standard MySQL monitoring. All MySQL HeatWave targets are auto discovered.
🧩 Customisation and Long-Term Scalability
👉 Customization guide:
https://github.com/tripplea-sg/mysql-heatwave-grafana-monitoring/blob/main/docs/6-Customising%20Dashboards.md
Because all metrics are stored in the repository database, dashboards are highly flexible. They use a dynamic schema pattern which allows dashboards to adapt automatically across multiple targets.
${compartment}#${display_name}You can also: Modify existing queries, Add new panels, and Create custom metrics using the monitor_tools schema. This ensures the solution can evolve with your environment.
🧠 Key Takeaways
Fully customisable and extensible Optional OCI integration for infrastructure metrics:
- Uses a central repository database for all metrics
- Grafana connects to one MySQL data source (repository)
- Works across HeatWave and on-premise environments
- Scales easily using Control Fleet
- Supports advanced scheduling for efficiency
- Fully customisable and extensible
- Optional OCI integration for infrastructure metrics
🚀 Final Thoughts
This solution is more than just dashboards, it’s a scalable monitoring architecture. By separating Data collection, Storage, and Visualisation; it enables a flexible and efficient observability model for MySQL environments of any size. Whether you’re monitoring a single database or an entire fleet:
Install → Collect → Store → Visualise → Scale