Performance issues are often stubborn things to cure. Suddenly a query or operation seems slow, or slower-ish. Sadly, the database is often pointed at as the culprit by developers who are either positive their code cannot be at fault or those who see databases as a mysterious box that does odd things at the direction of an odd language. So how do you start looking for what is impacting the performance of your MySQL instances?
1. Conduct benchmarks regularly
Hopefully you made benchmarks of your queries when you went into production. Being able to compare performance with hard numbers is vital for analysis. Knowing that query X runs in .56ms now versus .52ms six months previously provides a basis for forensic analysis of the cause of a slowdown.
Somewhere in your documentation you should have a copy of the query plan to compare with the current query plan to spot differences. Is there a new index being used or is a filesort now needed to complete the query?
The output of EXPLAIN ANALYSE is valuable as it shows the real numbers of the various parts needed to execute your query and is not based on historical information. If you see a skew between the outputs of EXPLAIN, which uses historical data for a guesstimate of what is needed to execute a query, and EXPLAIN ANALYSE, which uses actual time, then you need to run OPTIMIZE TABLE.
Also try to narrow down your search to see if all queries are slow or is the slowness isolated to one or a few queries. It is easier to work on a few problematic queries than to fight the ‘everything is slow’ problems.
2. Check What’s Running on the Instance
Oftentimes benchmarks are made on quiescent systems. But does your app run in such an environment? Sometimes you have others contending for your data with things like end of quarter inventory analysis. Or other MySQL instances on the same server are contending for system resources. And do not forget the connectivity to that server may be contending with new network routes, servers moved to other domains, increased demand, DNS zone loads, or other similar tasks. Could your disk cache be re-learning you use patterns or is there something from dmesg warning you of issues?
Offloading work to other instances is much easier in these cloud centric days. Look to keep mission critical instances as lean and mean as possible.
3. Use the Latest Security Fixes
The recent Apache Log4j bug is an example of a security issue raising its ugly head and impacting operations. You need to regularly check on security issues on a daily basis (if not more often), check on your vendor announcements for possible issues, and check your servers for suspicious processes regularly. Occasionally a library with poorer performance will slip by, also slip by testing, and only show issues in production. Being aware of changes in the entire stack can be an onerous task but the impact can appear to be a poorer performing database.
Keep aware of software release cycles and apply updates as soon as practical. Not only do updates have security fixes but many times you will find new features like hash joins that can greatly improve performance.
For MySQL, download version 8.0.27 here.
Also purge old accounts that are not in use and rotate passwords on a regular basis. An old password found on a sticky note by someone curious should not be an attack vector.
5. Identify Which Queries Are Slow
If you can isolate the problem down, it is easy to triage the problem. If the customer billing system has slowed but the other systems are working as expected, it is easy to examine the tables in question, their indexes & histograms, and their queries.
Other times the problem is in two systems that are interrelated. Customer billing and shipping are slow? How do they relate? Could a lock in one system’s table be blocking queries in the other systems?
Run ANALYSE TABLE on the tables in the schema. Update histograms. Are the indexes being used the best match for the queries? Use EXPLAIN on queries and examine what is in the EXTRA field.
The growth of your data also has an impact. A small set of data used to get by with an in memory sort now needs to sort that data on disk (time for a new index?). Changes in your tables such as new columns or new indexes can have a dramatic impact.
Simple things like removing unused indexes can greatly reduce server overhead maintenance. It is recommended to make indexes invisible for a period of time before deletion if you have any doubts that there may be some rarely used query that uses it.
6. Use MySQL Tools to Get More Detailed Information
Before the Performance and Information schemas became available, there were very few ways of telling what is happening at a granular level. But for the last several major releases of MySQL, we have had the ability to get intimate with what the server is doing. The Sys schema has prepackaged much of the vital information you need to know.
The Sys schema can report on queries not using indexes, unused indexes, the top memory users, statements in the top 5 percent by runtime, and which queries are using temporary tables. And the Sys schema can be accessed from MySQL Workbench.
MySQL Enterprise Monitor or MEM is able to monitor multiple servers, their environment, backups, and queries. MEM will monitor replication, ACLs, firewalls, and clusters. This is the premier product for MySQL instance management.
But MEM is unsurpassed in its ability to continuously monitor MySQL queries and performance related server metrics. You can set alerts on significant deviations from the baseline performance trends. Imagine getting told a certain query is 5% slower now over historical records before you users notice. MEM will recommend changes to configuration and variable settings to improve performance.
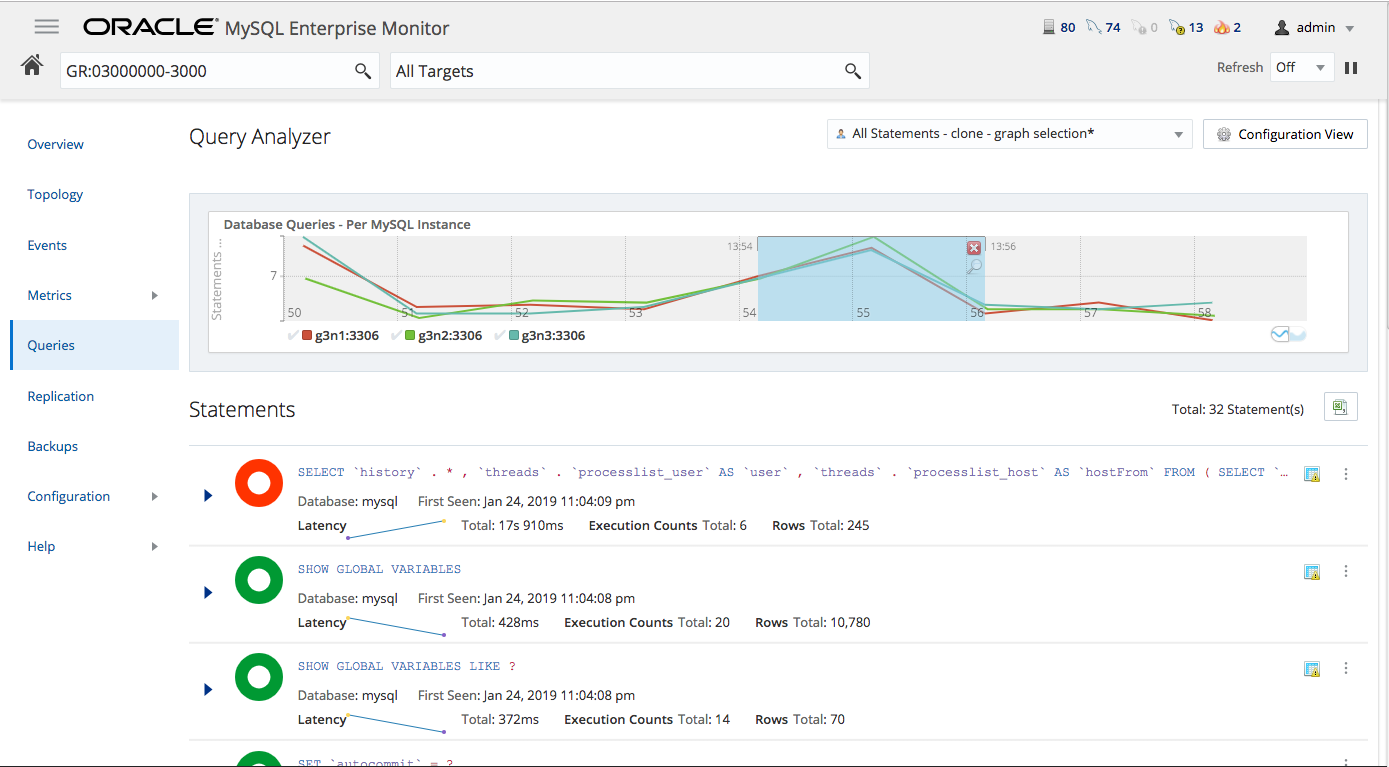
MEM’s Query Analyzer pinpoints SQL code that is the root cause of a slowdown. Information is presented in rich graphs that will allow you to drill down into detailed query information and provide visibility into database performance issues. It is recommended that you use the Query Analyzer during development and in production. This way developers can quickly improve SQL code during active development and continuously monitor and tune queries running on production systems.
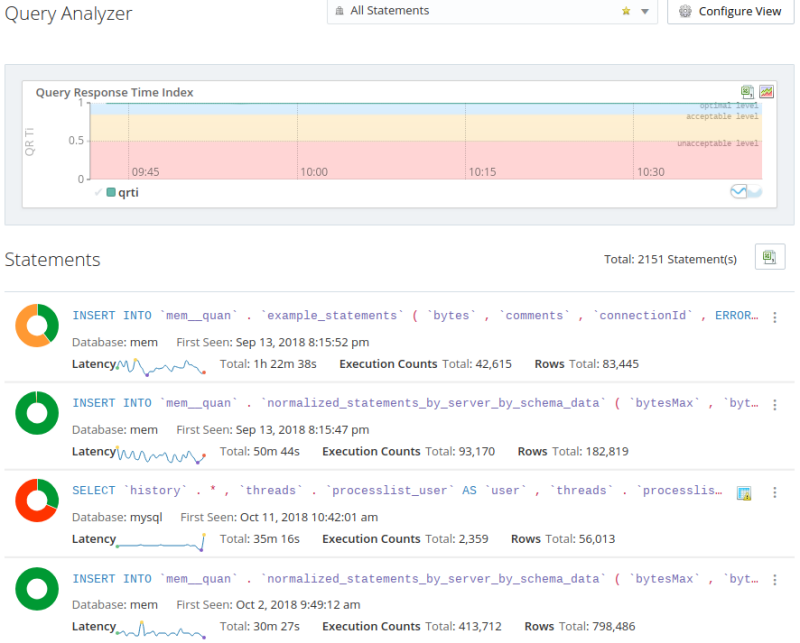
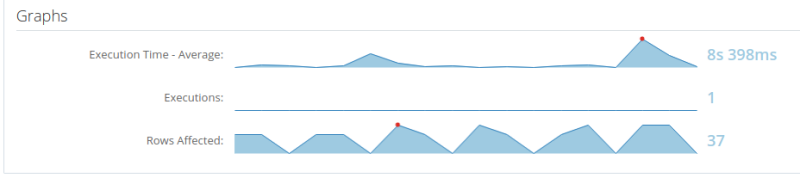
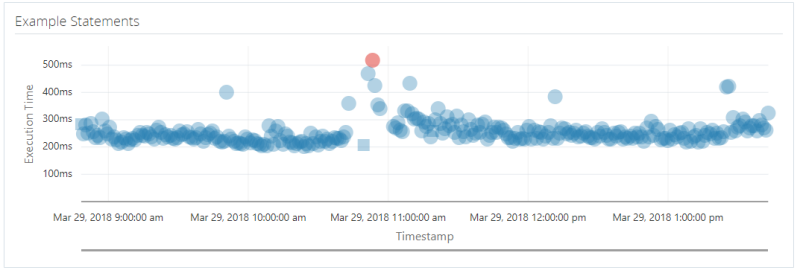
Watch the video below to see how MySQL Enterprise Monitor’s Query Analyzer allows you to quickly and easily identify the root cause of query-based performance issues on any MySQL server.
7. MySQL in the Cloud
The MySQL Database Service or MDS can provide other insights into the performance of your instances. It is very easy to find CPU utilization numbers, active connections, network transmissions rates, and information on disk writes. This is all from an intuitive GUI interface and not having to run a series of scripts and queries to get the same information.
MDS is run by MySQL engineers and they know what to monitor and how to monitor better than anyone else. These are the experts in this area. If you are serious about using your MySQL instances to their full potential it helps to use the same tools as the craftspeople who do this work regularly. Other cloud vendor’s with MySQL forks offerings may have some decent tools and some experience in the field but not to the level nor the experience you will find from the MySQL team and with the MySQL Database Service.
8. Use MySQL HeatWave on Oracle Cloud to Speed Your Queries
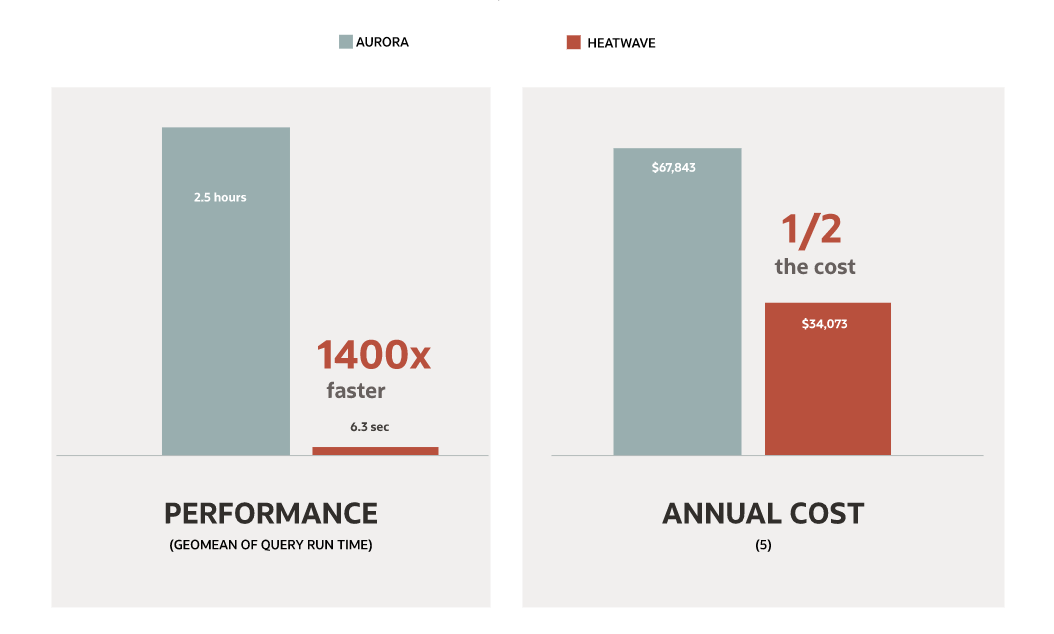
HeatWave is a massively parallel, high performance, in-memory query accelerator for MySQL Database Service that accelerates MySQL performance by orders of magnitude for analytics and mixed workloads. HeatWave is 6.8X faster than Amazon Redshift at half the cost, 6.8X faster than Snowflake at one-fifth the cost, and 1400X faster than Amazon Aurora at half the cost.
By enabling MySQL HeatWave in your MySQL Database Service environment you will get a massive performance improvement without changing a single query. Try it for FREE now!
Do not miss the upcoming webinar about “Maximizing Query Performance for MySQL On-Premises and In the Cloud” on 26 January at 10 am CET. Register here now!