
Thank you to Zehavi Rodriguez of Duke University for contributing this post.
The cost of maintaining a fleet of vehicles depends on timing. Service a vehicle too early and the organization incurs costs for repairs that were not yet necessary. Service it too late and the result is a more extensive repair along with unplanned downtime. For electric fleets, this margin narrows further. Signs of thermal stress, charging-system faults, battery degradation, and component wear emerge gradually across dozens of sensor and software signals. In some cases, waiting until a warning appears can reduce the opportunity for earlier intervention.
Predictive maintenance can use data a fleet has already collected to identify vehicles that may warrant attention before a potential failure. In practice, getting there usually involves several handoffs: an analyst pulls the sensor data, a data scientist cleans and models it, and an engineer integrates the result into the system that schedules service. Each handoff adds delay and creates another point where a promising model can stall before production.
Introducing the Data Science Agent
The Oracle Data Science Agent, available on Oracle Autonomous AI Database Serverless, can help streamline this process. Embedded in the Oracle Machine Learning user interface, it provides a conversational interface to the machine learning lifecycle: profiling data, preparing features, training models, evaluating results, and generating SQL code for scoring. Data preparation, model training, evaluation, and scoring run in Oracle Autonomous AI Database, which can help reduce data movement and allows applicable database access controls to be used across the workflow. The walkthrough applies the Data Science Agent to a specific case: identifying and ranking vehicles that should be prioritized for inspection based on their probability of needing an emergency repair.
Setting up the walkthrough
The walkthrough begins inside an Oracle Machine Learning project named Electric Vehicle Predictive Maintenance. Before starting a conversation with the agent, the interface presents a short set of guidelines: use a capable, reliable model, state the business goal at the outset, and keep each conversation focused on a single task. These practices can influence how the agent interprets a request and may help improve the usefulness of its results.
The walkthrough follows a single agent conversation from the first question to the SQL used for operational scoring. The synthetic dataset resides in a view named OMLUSER.EV_FLEET_HEALTH_V, which contains 100,000 vehicle records, with columns covering battery health (capacity retention, internal resistance, peak temperature), operational stress (thermal and charging stress scores), and risk indicators (diagnostic warnings, days since last service). The goal is to predict which vehicles will need an emergency repair, captured in the binary NEEDED_EMERGENCY_REPAIR flag, and to turn that prediction into a ranked inspection-priority list.
The EV fleet walkthrough
Discover and profile the data
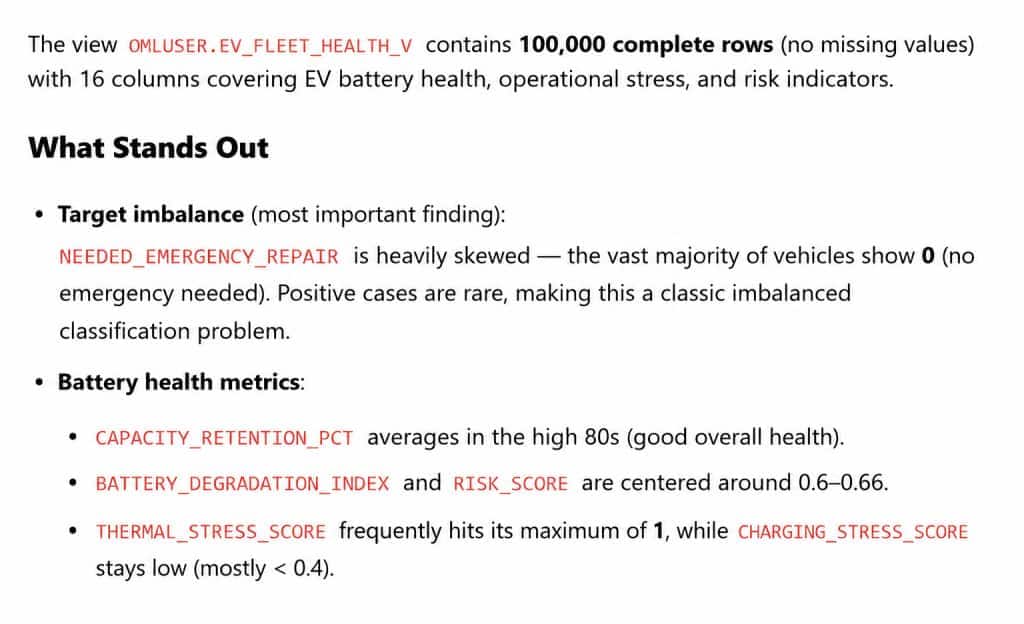
We begin by asking the agent what fleet data is available. It identifies the view, examines the columns, and profiles completeness and distributions.
What fleet battery health data is available? Summarize the data. What stands out?
The agent profiles the view and flags that emergency repairs are rare in the dataset. A follow-up, “How common are emergency repairs?”, confirms that positive cases make up roughly 6% of records, which makes this an imbalanced classification problem. Identifying the class imbalance early allows us to account for it when building and evaluating the model.
Engineer features in natural language
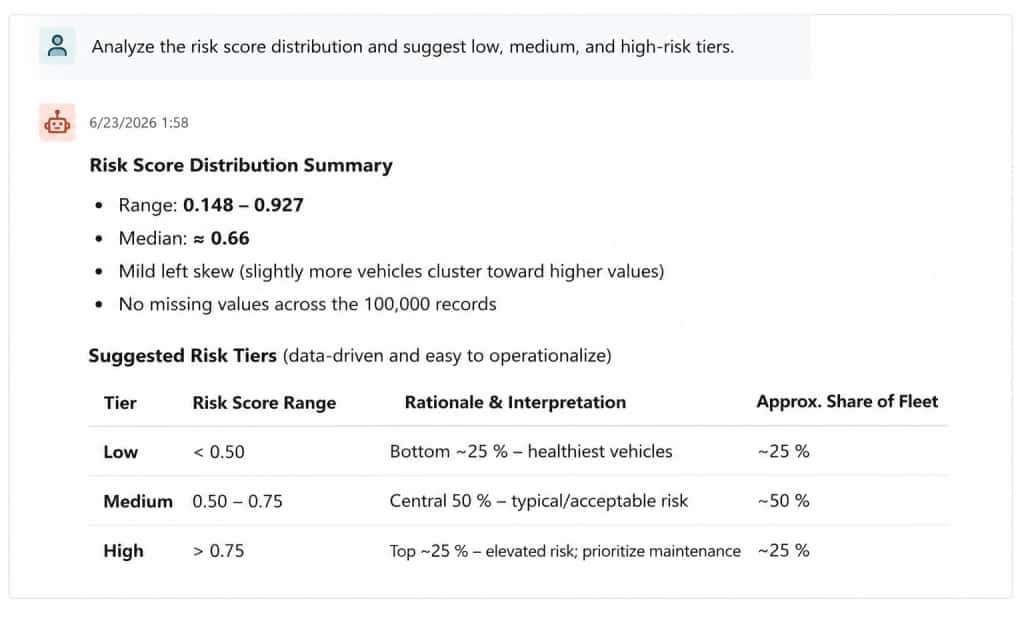
Raw sensor data does not match how fleet managers think about risk. They think in terms of low, medium, and high, not a continuous score between 0.148 and 0.927. We ask the agent to translate:
Analyze the risk score distribution and suggest low, medium, and high-risk tiers.
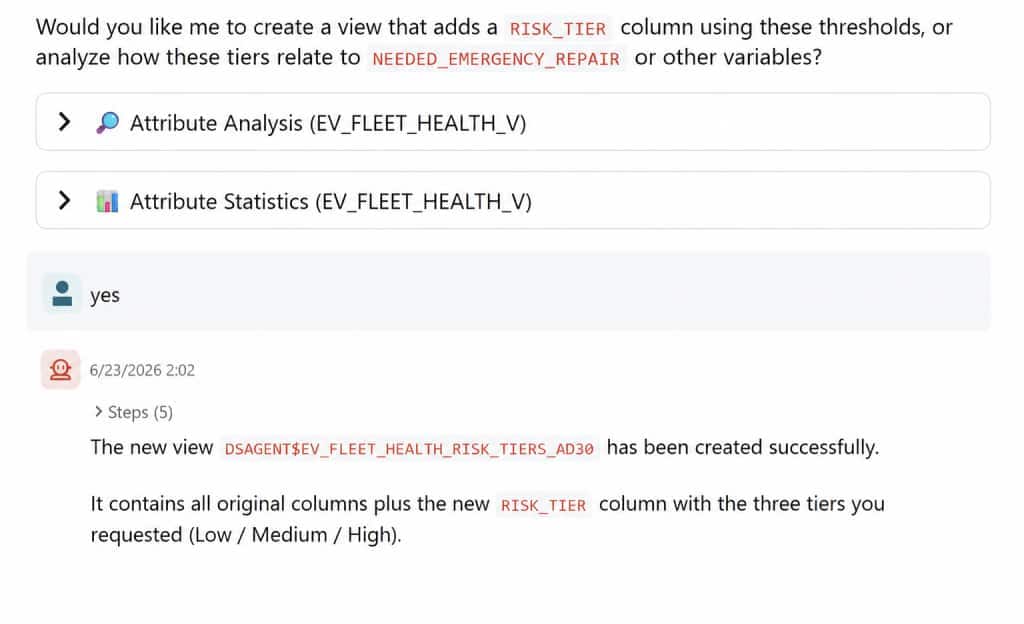
The agent analyzes the distribution of RISK_SCORE, proposes cutoffs at 0.50 and 0.75 that align with the quartiles, and explains the rationale. In this synthetic walkthrough, RISK_SCORE is treated as an upstream fleet signal available at scoring time; it should not be derived from the emergency-repair outcome or use future information. After confirmation, the agent creates a new view with a RISK_TIER column. RISK_TIER is an interpretable business segmentation, created to make the continuous risk score easier to interpret and compare across groups. It is not included as a feature in the predictive model built later in the walkthrough.
Validate the tiers
Before building a model, we check whether the engineered feature is meaningful:
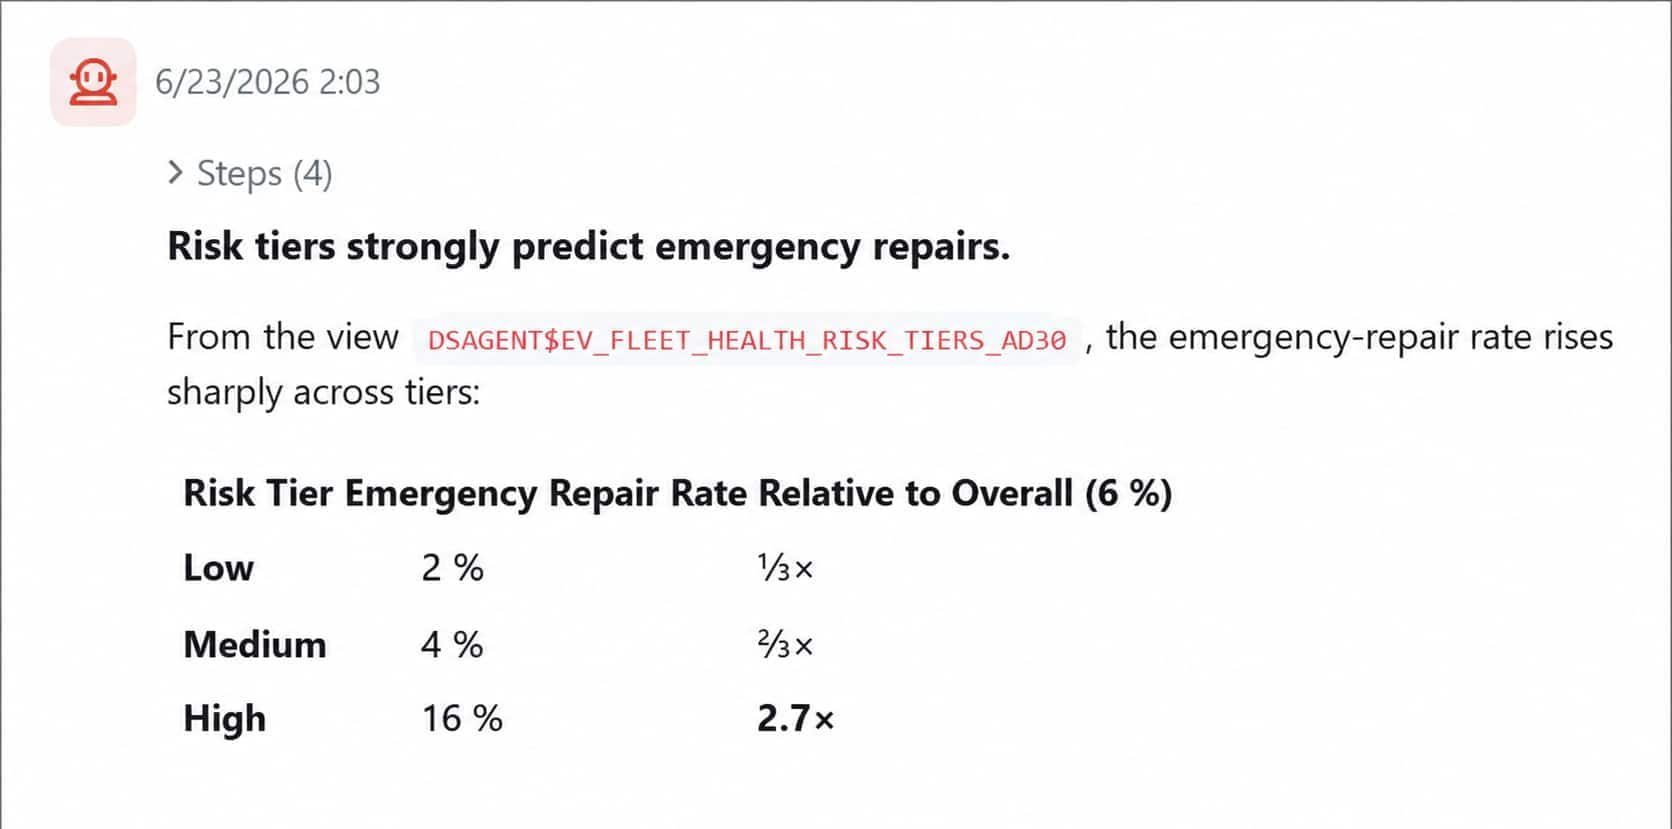
Check how the tiers separate repair outcomes.
The emergency-repair rate increases from 2% in the Low tier to 16% in High, indicating a strong association between the score-based tiers and repair outcomes. That separation indicates that the risk tiers meaningfully distinguish vehicles with different repair needs, suggesting that the tiers can help distinguish groups with different emergency-repair rates even before a predictive model is built.
Build the model with automated model search
To predict emergency repairs at the individual vehicle level, we ask the agent to compare candidate algorithms and identify the best-performing model for our evaluation objective.
Find a good model that predicts emergency repairs.
The agent recommends Automated Model Search, which ranks features by importance, then tests multiple in-database classification algorithms on validation data and keeps the model selected by the configured evaluation metric.
The search selects a Neural Network and reports its validation metrics along with a feature-importance table, which shows RISK_SCORE as the main predictor, followed by battery temperature and capacity signals.
Because RISK_SCORE is already a strong upstream signal, its dominance in the feature-importance results warrants comparison against a RISK_SCORE-only baseline before attributing incremental predictive value to the Neural Network. A numeric RISK_SCORE-only AUC was not available from the existing evaluation objects, so this walkthrough does not claim that the Neural Network provides incremental predictive value over RISK_SCORE alone.
Automated Model Search selects the candidate using the configured evaluation metric, in this case F1, and then the workflow examines recall and AUC to understand its suitability for the maintenance objective.
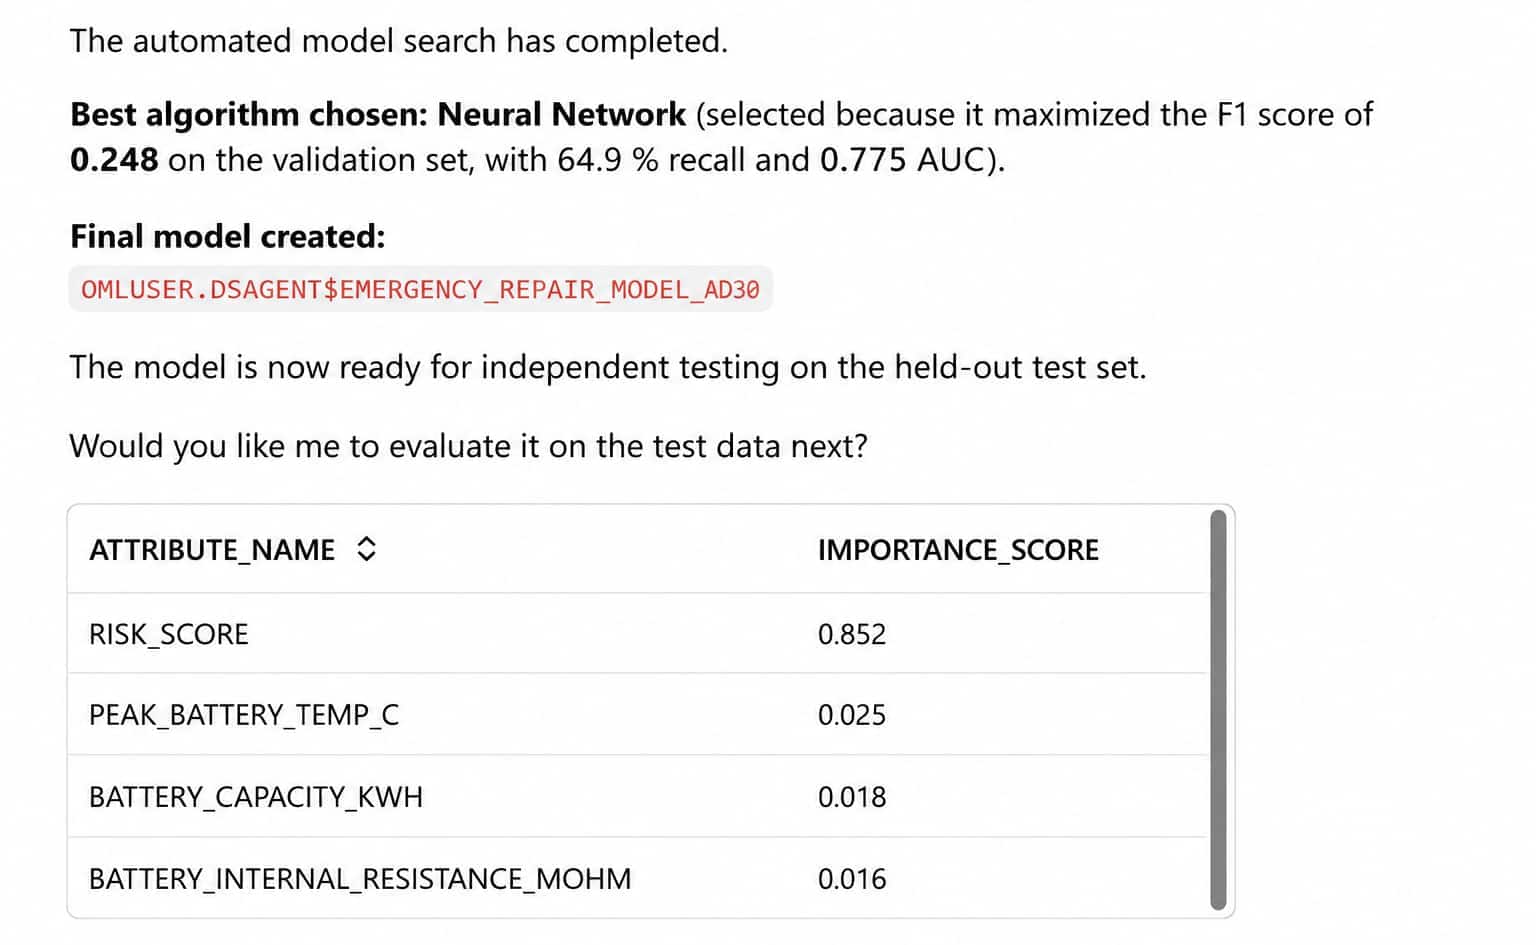
for the configured evaluation metric, and it reports validation metrics and feature importance.
Evaluate the selected model on test data
The data was split 70% for training (70,027 rows), 10% for validation (9,995 rows), and 20% for testing (19,978 rows). Automated Model Search selected the Neural Network based on validation F1 score (0.248), with 64.9% recall and 0.775 AUC, using a probability threshold optimized for F1 on the validation set. On the test set, evaluation at the default 0.5 threshold produced an AUC of 0.816, 0.25 precision, 0.53% recall, and 0.0103 F1. Although recall is low at the default classification threshold, the test AUC of 0.816 indicates that the model can discriminate between higher- and lower-risk records in this synthetic test dataset. Because the maintenance workflow prioritizes vehicles by predicted probability rather than a binary prediction, the next step is to use those probabilities to rank the fleet for inspection. When inspecting the top 15 percent of vehicles, recall is approximately 50 percent, precision is approximately 6.3 percent, and lift is approximately 3.35. The test set contained 376 emergency-repair cases among 19,978 rows. Because the split was not stratified, its class distribution differs from the roughly 6 percent rate in the full dataset.
Rank the fleet by risk
With the model trained, we can score the fleet:
Show the vehicles most likely to need an emergency repair based on model scores. Rank the vehicles by predicted repair probability.
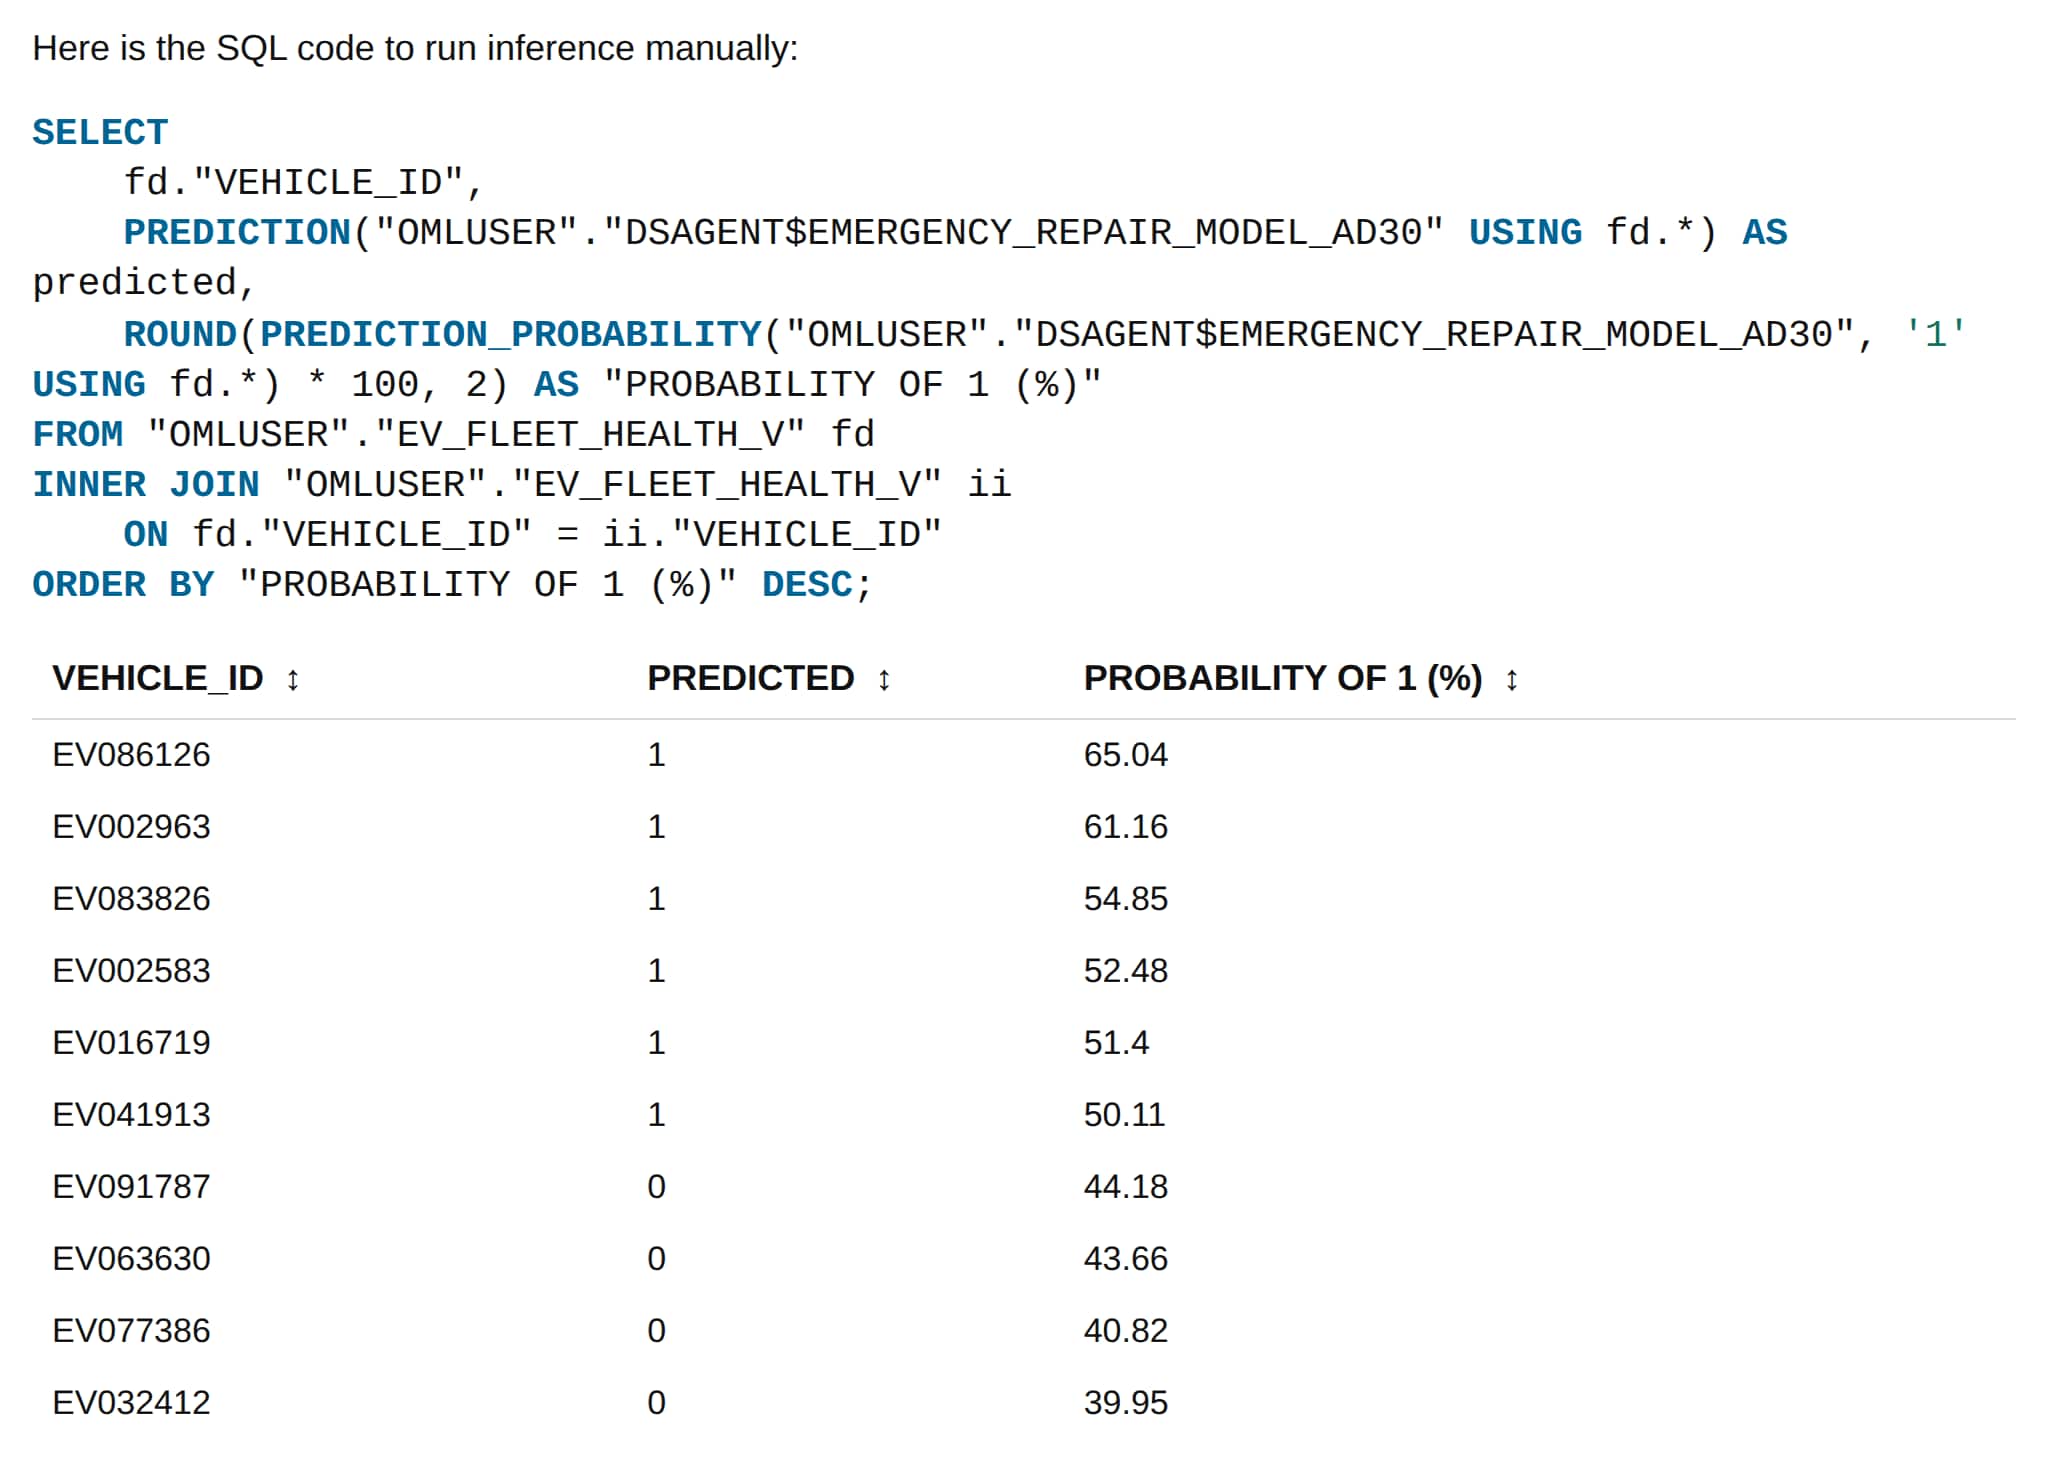
The agent scores the fleet and surfaces the top 100 vehicles most likely to need an emergency repair, ordered by descending probability. This top-risk preview is the kind of output a maintenance scheduling team would triage first; the query to score and rank the entire fleet is generated in the next step.
Illustrate potential cost exposure
Quantifying the ranked list’s potential savings makes it more useful for budget planning. Because the agent retains the context of the session, you can ask business questions about the work already completed:
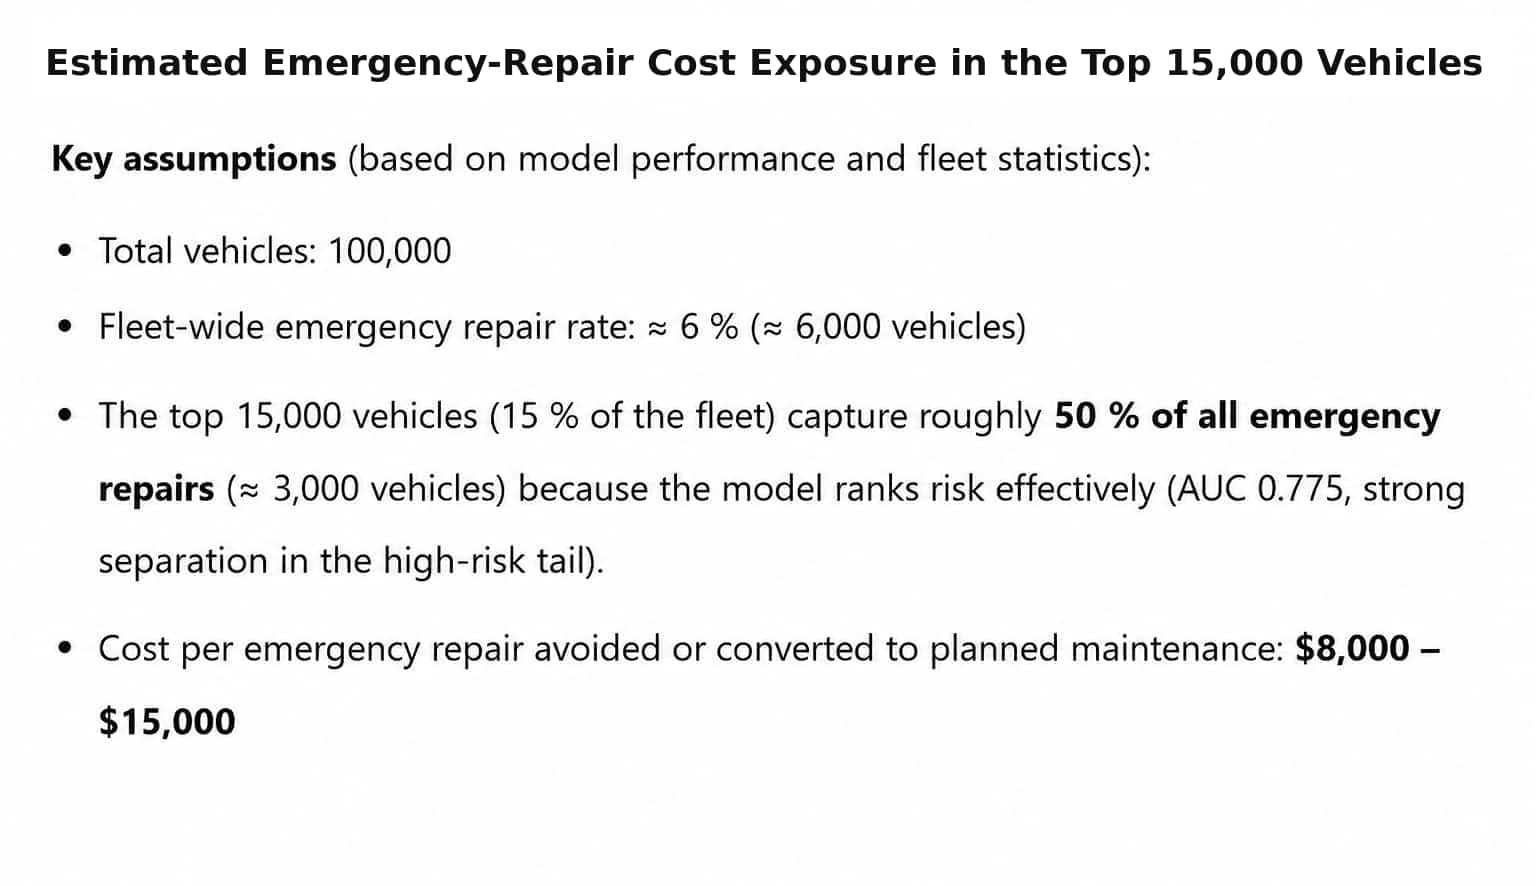
Assume each emergency repair costs $8,000-$15,000. What gross emergency-repair cost exposure is represented by the top 15,000 ranked vehicles?
For illustration, assume the top-ranked 15,000 vehicles capture approximately 3,000 of the fleet’s expected emergency repairs. At an assumed emergency-repair cost of $8,000-$15,000, those cases represent $24-$45 million in illustrative gross cost exposure. Actual net savings would depend on inspection costs, planned-maintenance costs, and the percentage of emergencies prevented or mitigated. The analysis does not estimate the percentage of emergency repairs that inspection would prevent or mitigate and therefore does not estimate actual savings. The dataset is synthetic, so this figure illustrates the method rather than benchmarking it.
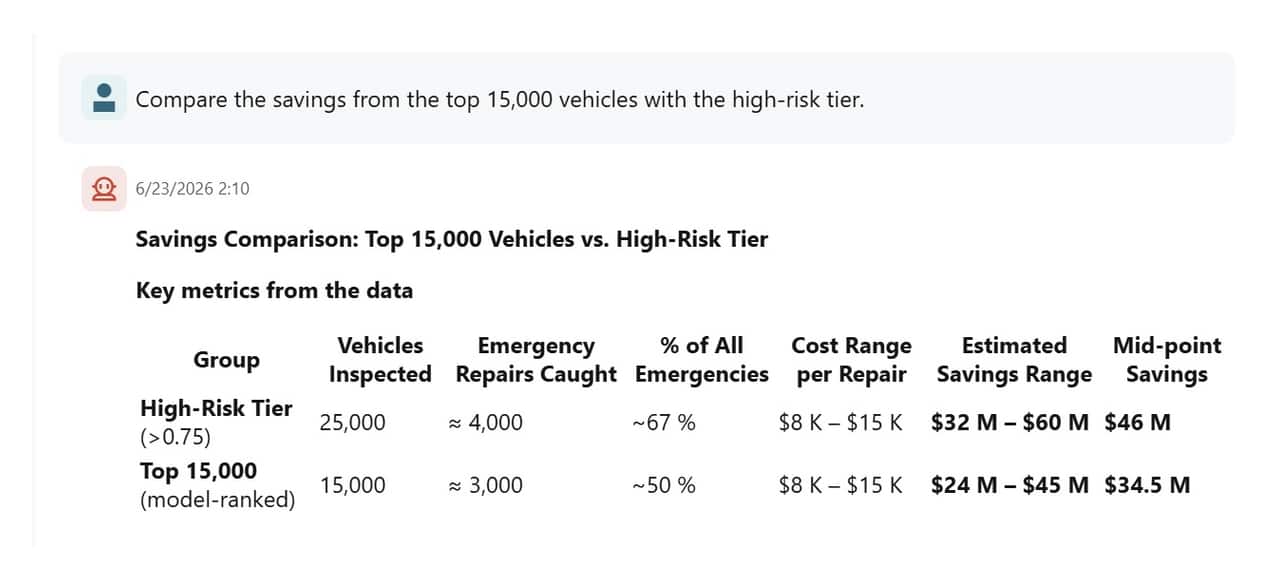
Using the same illustrative assumptions, a follow-up comparison against inspecting the entire high-risk tier shows the trade-off: the model-ranked top 15,000 represents about 75% of the estimated cost exposure of the full high-risk tier while requiring inspection of 10,000 fewer vehicles – 40% fewer vehicles in this illustrative comparison. This illustrates how a ranked list could help a maintenance team allocate limited inspection capacity.
Generate SQL code for scoring
After evaluating the selected model on the test data and reviewing the ranking trade-offs with the maintenance team, we ask the agent for SQL that applies it:
Generate the SQL query to rank the entire vehicle fleet by predicted repair probability.
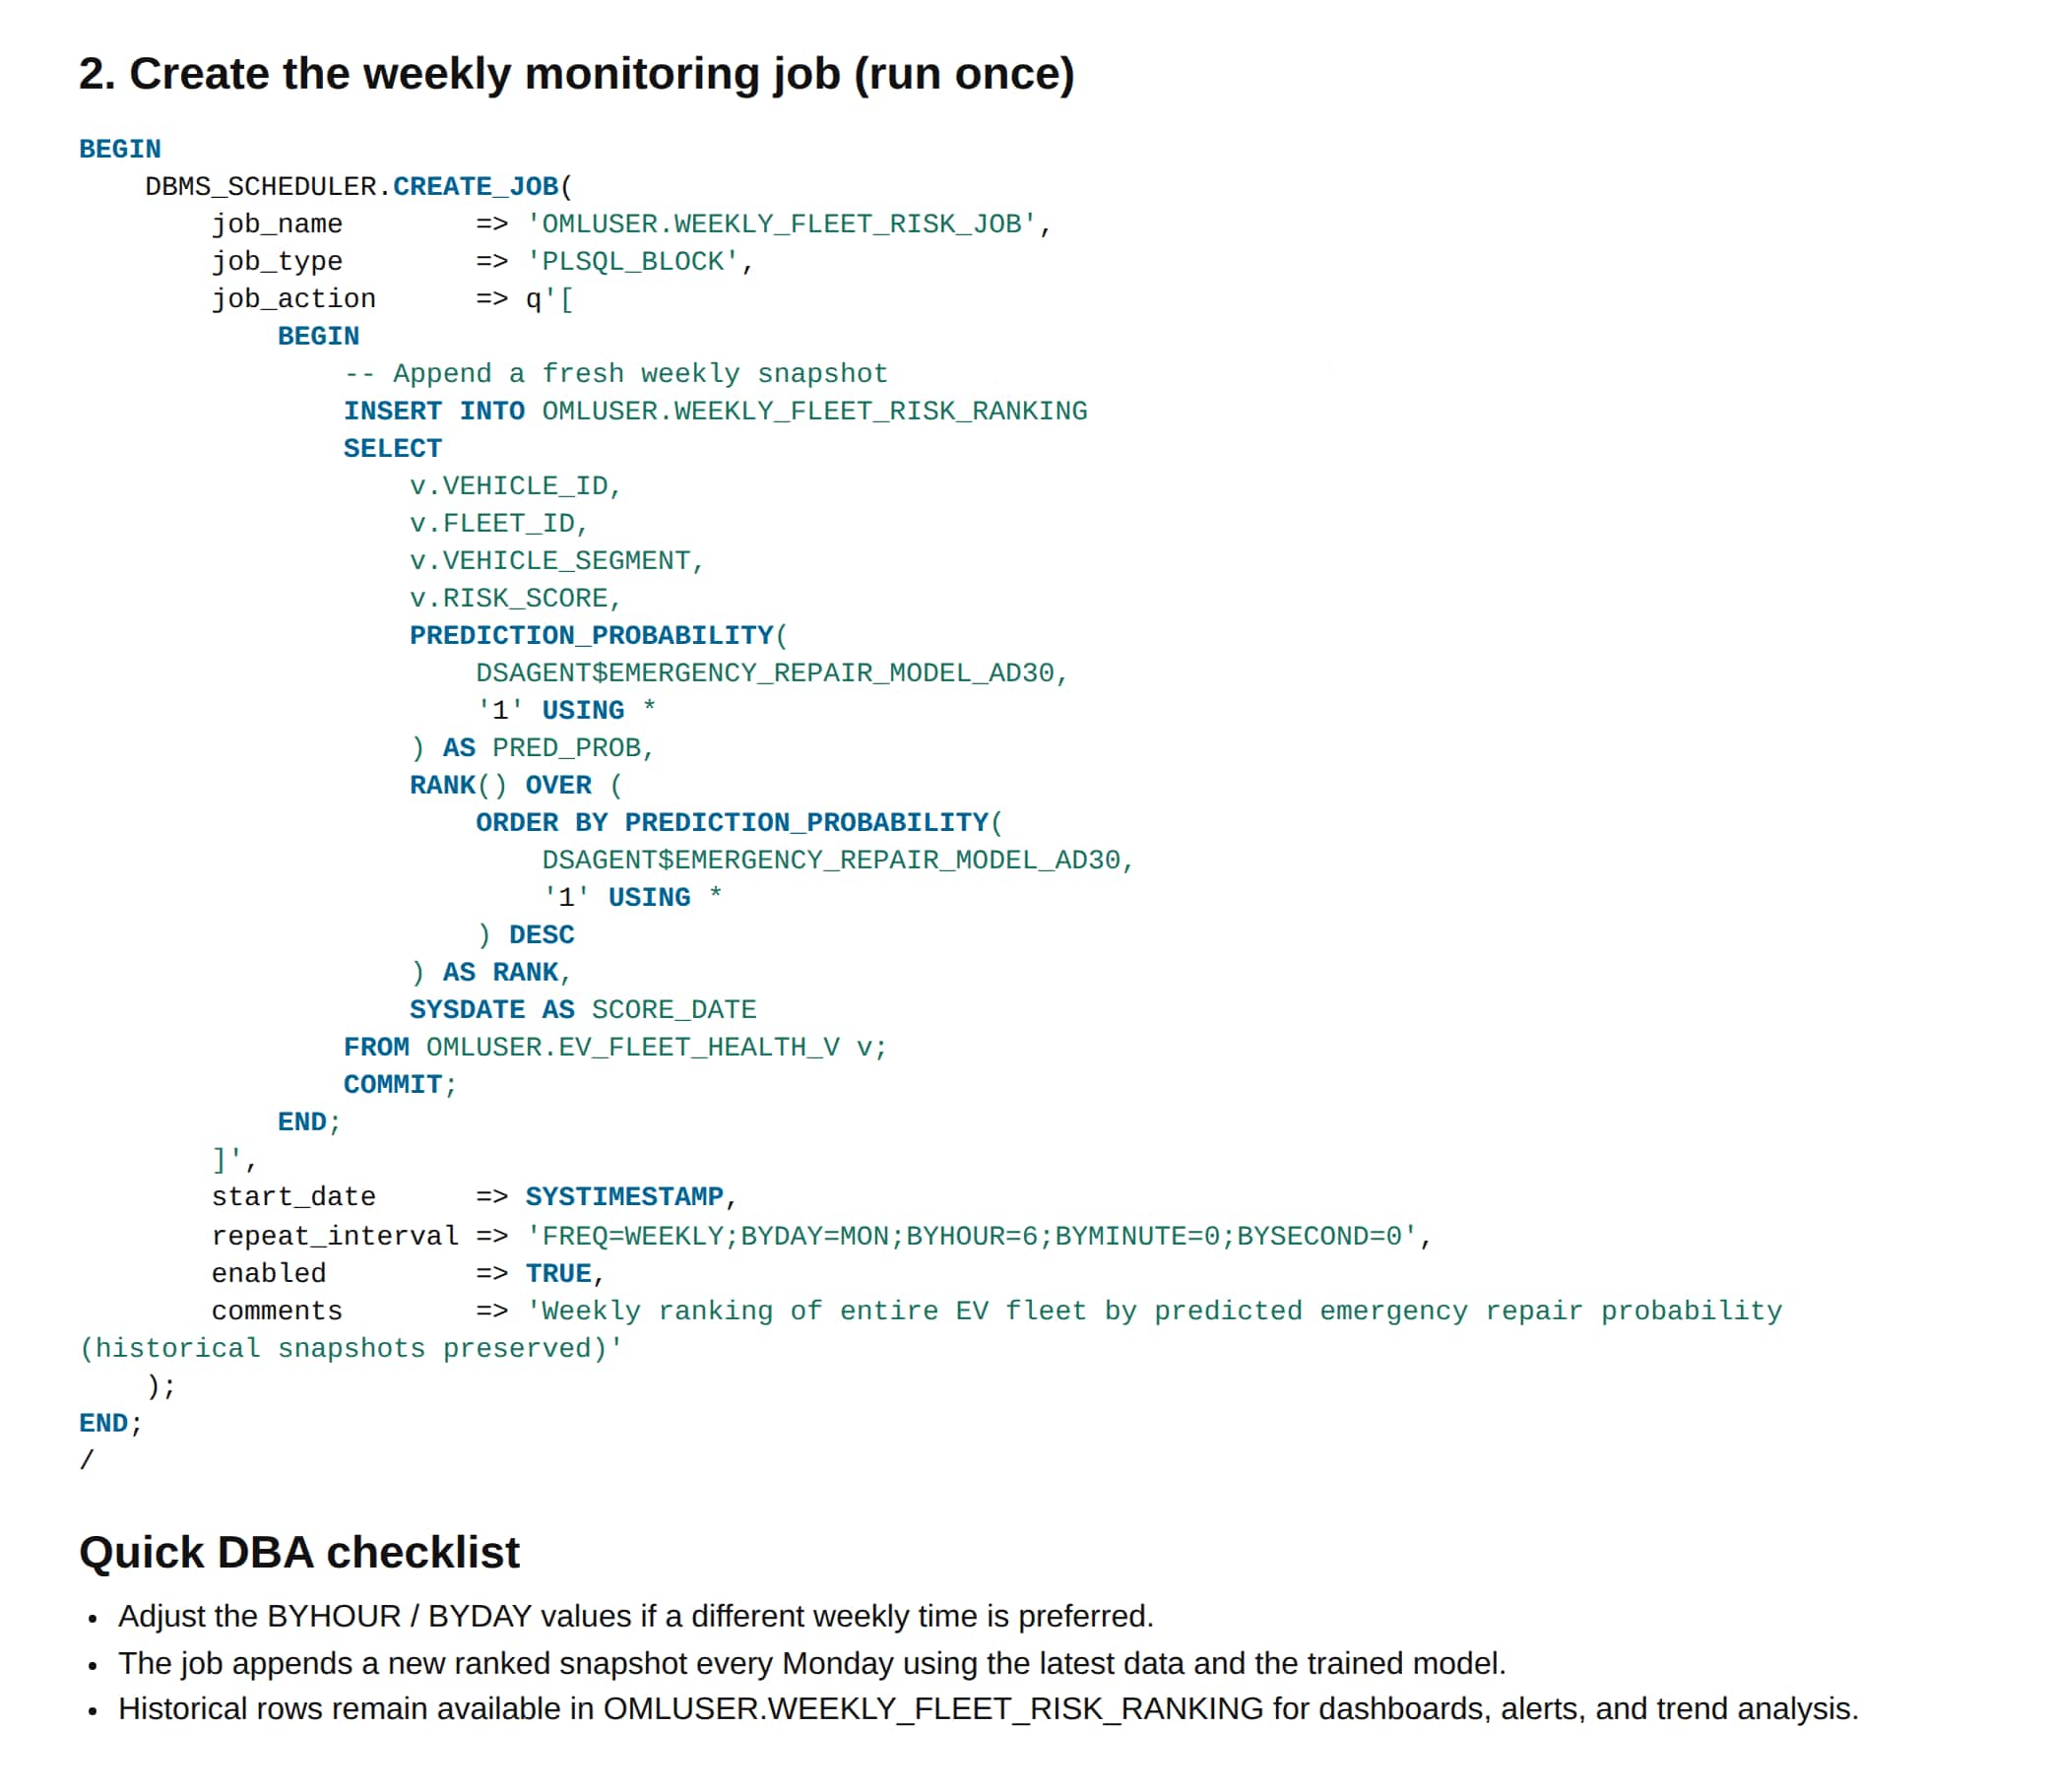
The agent returns in-database SQL code for scoring, using PREDICTION_PROBABILITY against the trained model. The query can now run on new data and be scheduled to run with DBMS_SCHEDULER or an Oracle Machine Learning notebook job.
From conversation to production
Once the model is producing useful rankings, there are a few ways to put it into production: a DBMS_SCHEDULER job that runs the query on a schedule, a scheduled Oracle Machine Learning (OML) Notebook job, or on-demand scoring through OML Services. We ask the agent to help set up the first of these:
How can my DBA use this query to set up a weekly fleet risk monitoring job?
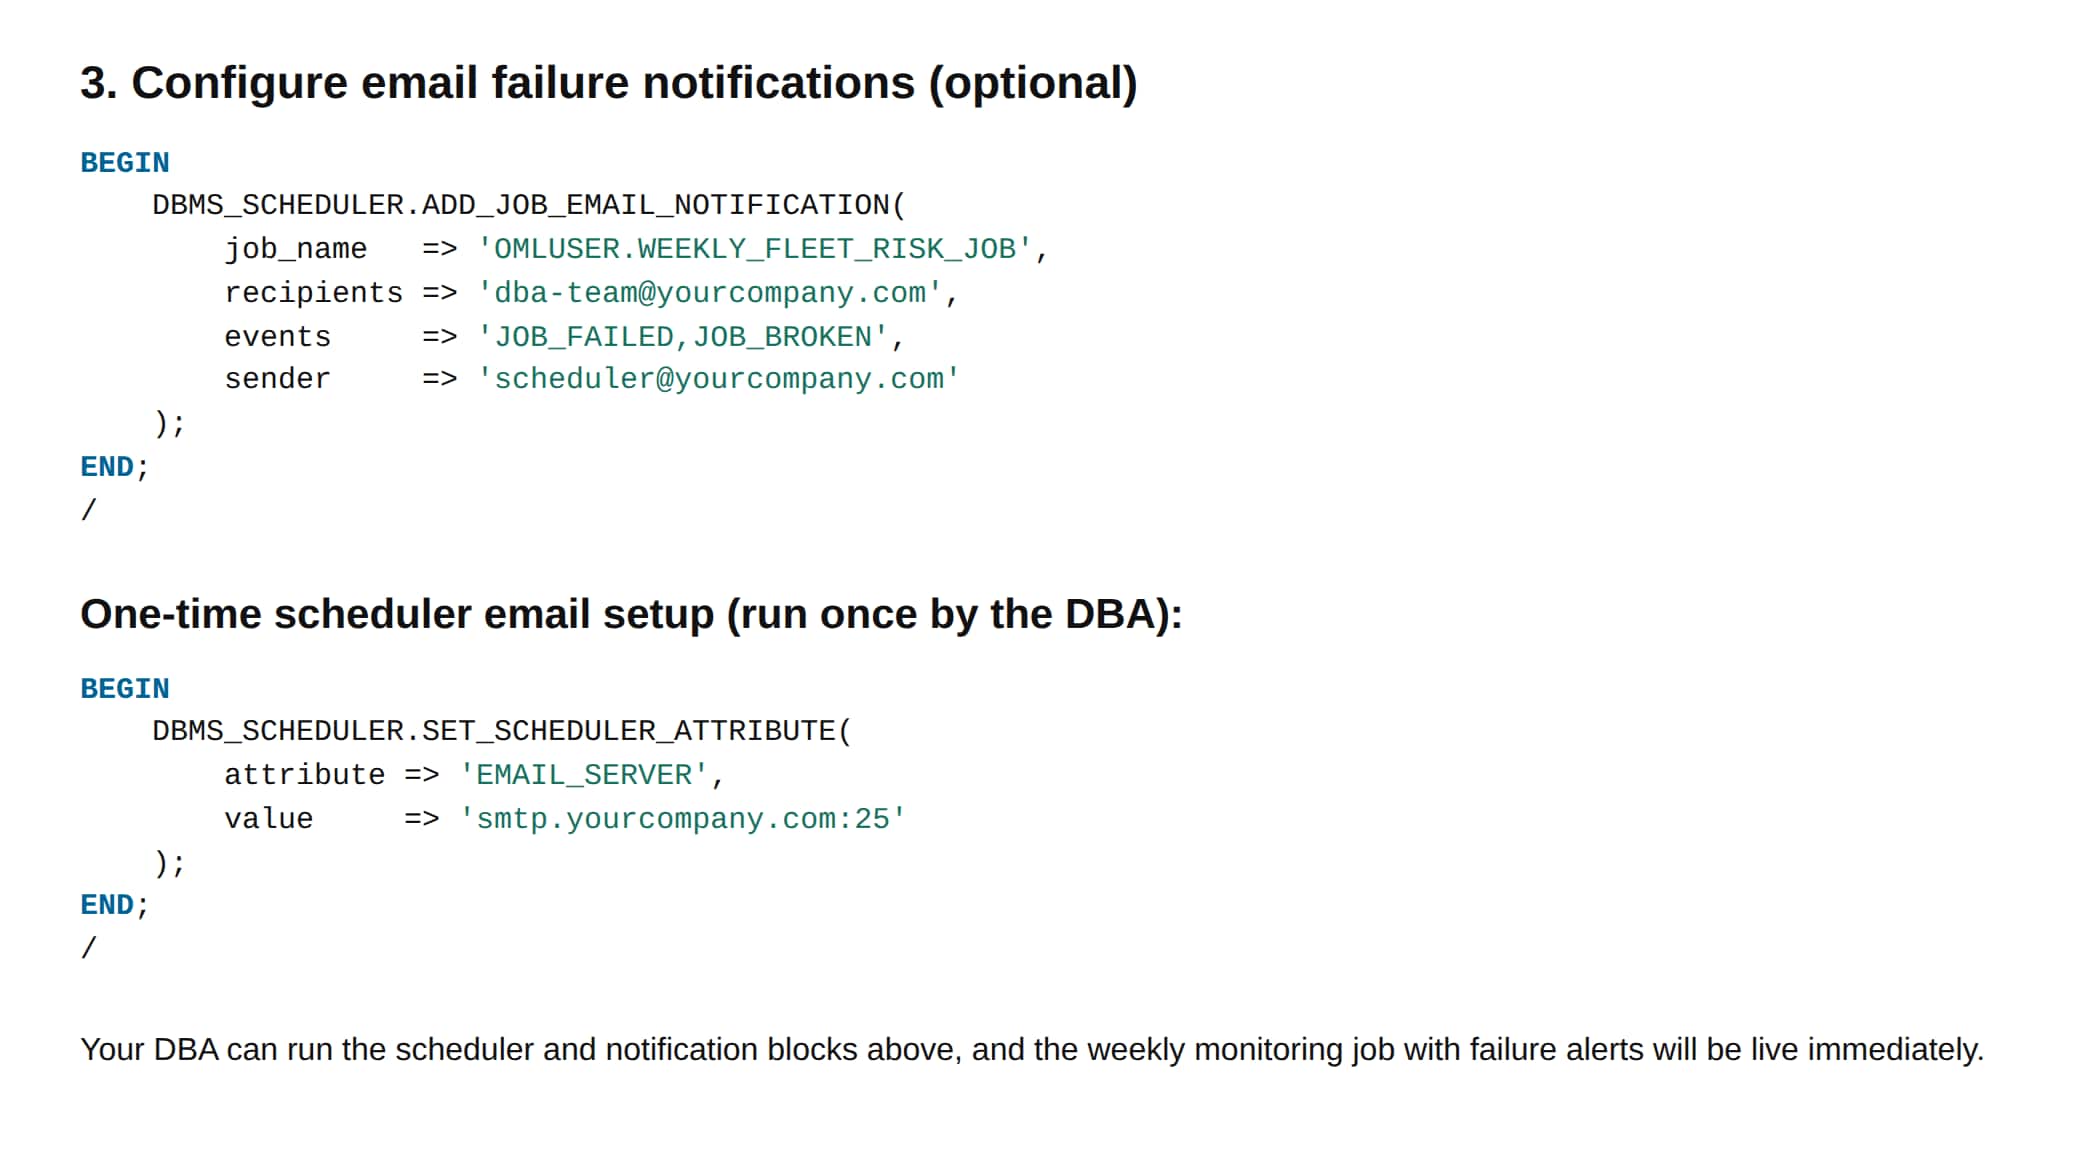
The agent generates a persistent results table and code for a DBMS_SCHEDULER job that re-ranks the entire fleet weekly using the latest data. It also includes an optional failure notification, which a DBA can implement and review with DBMS_SCHEDULER.ADD_JOB_EMAIL_NOTIFICATION, and a short checklist for enabling the job. A developer or DBA should review and test the generated SQL before deploying it, then can integrate the results table into a custom dashboard or alerting system.
The scheduled job produces a ranked list rather than a finished service plan, so a maintenance planner should review the top-ranked vehicles before work orders go out. As new repair outcomes accumulate, teams can monitor model performance and retrain when enough new labeled data or evidence of model degradation warrants it.
Beyond scheduled batch scoring, Oracle Machine Learning Services provides a REST API for on-demand scoring. Model monitoring is available through both REST APIs and the Oracle Machine Learning user interface.
Summary
For fleet operators, predictive maintenance means identifying service needs early enough to schedule maintenance before a breakdown. In this walkthrough, a single Data Science Agent conversation moves from data profiling and feature engineering through model development, business-value estimation, and SQL code for scoring. The workflow reduces handoffs among analysts, data scientists, and developers while keeping the data in the database.
The Data Science Agent is built into Oracle Machine Learning in Oracle Autonomous AI Database Serverless and uses the Oracle Select AI Agent framework behind the scenes. It works with supported LLMs from third-party AI providers, OCI Generative AI, or privately hosted models.