Background
Instance launch time, also called startup time, is an important performance metric for the Cloud. But what is meant by launch time? There are several related metrics that comprise launch time. In this blog post, we will describe three launch time performance metrics and explain the key components of each. Once these pieces are understood, we will describe how to build an infrastructure that measures and monitors launch time performance of cloud instances on a regular basis.
Why is launch time important? A key reason is that clouds are elastic by nature, which means that compute instances are created and destroyed in response to changes in workload demand. Hence, the time to launch instances is a critical factor in overall workload performance. Launch time metrics also help determine lead time for making instance provisioning requests, thereby playing an important role in how effective cloud elasticity is.
Cloud instances come in two varieties: virtual machine instances or bare metal instances.
-
A virtual machine is a set of compute resources (CPUs, memory, disks, etc.) that are presented to a user as a complete computer system
-
A bare metal machine is where all of the resources of an underlying physical machine are assigned to a single user.
Cloud Launch Time Performance Metrics
There are three key cloud launch time performance metrics:
-
Time to Runnable
-
Time to Boot
-
Time to SSH
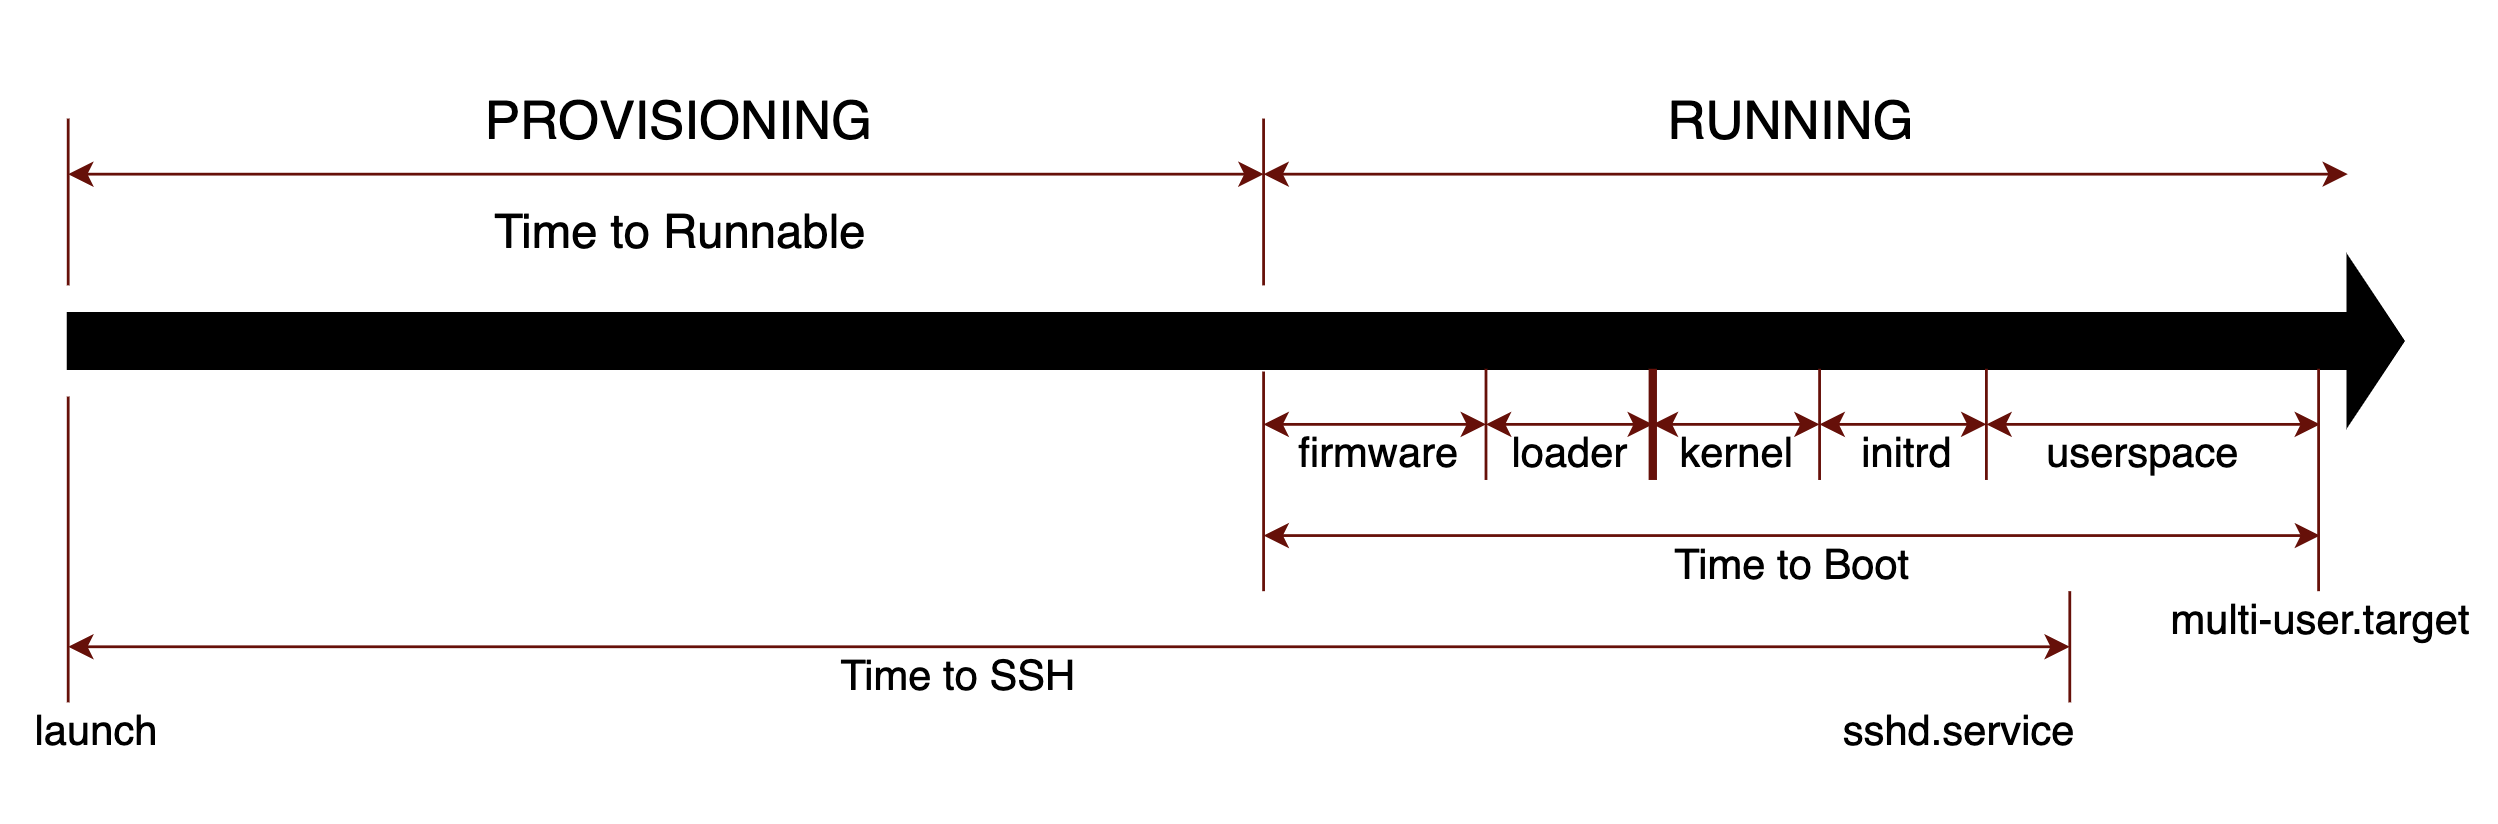
These three metrics and the temporal relationships between them can be seen in the following figure, which applies to Red Hat compatible Linux distributions including Oracle Linux (OL) and CentOS. Note that this figure and the ensuing discussion refer only to the initial booting of an instance. Metrics and methodologies for monitoring performance of subsequent boots may differ.
We break out each of the metrics in the following sections.
Time to Runnable
On Oracle Cloud Infrastructure (OCI), instances progress through a series of states. When an instance is launched, it enters into the “Provisioning” state. When provisioning finishes, the instance enters the “Running” state.
The metric “Time to Runnable” measures the time elapsed between when a request to launch a compute instance is made and when the status of the instance becomes “Running”. This is the time that is taken by the Cloud service provider to process the request, which includes the following factors:
-
The time required to acquire all the requested resources, including CPUs, memory, disks and networking capabilities
-
Included in this is the time to decide on which underlying physical system the requested CPUs and memory will be placed and then to update entries to indicate that the resources have been allocated to this particular user
-
The time to create the boot volume (and other requested disks), and
-
The time to copy over the selected operating system image (for VM instances)
Time to SSH
When a user launches an instance, often times the first operation will be to log in to the instance, typically using SSH. This may be done directly from a command console, or, more likely, using an automated script.
The metric “Time to SSH” measures the time elapsed between when a request to launch a compute instance is made and when the instance is able to be logged into via SSH. In other words, this is the time that a user needs to wait to use the instance i.e. an instance becomes ready for login via SSH. The network setup is complete once the SSH daemon (sshd.service) is up and the port (22) is open. However, it often takes longer to be able to log into the instance even after the sshd.service is running (for example, until other things like home directories are set up and SSH keys available).
Note that “Time to SSH” will always be larger than “Time to Runnable” since it is measured from when the provisioning starts. Thus “Time to SSH” includes the time the instance takes to reach the “RUNNING” state plus the additional time until SSH access is available.
The following factors impact “Time to SSH”:
-
Time for the cloud service provider to provision the instance
-
Time for the operating system to complete the kernel related boot sequence elements (firmware, loader, kernel and initrd)
-
Time for the operating system to complete sufficient user space initialization so that the SSH daemon is started and ready.
-
This time also includes sufficient networking initialization so that requests to SSH port 22 may be received
-
SSH will typically be available before the full operating system boot sequence has completed
Time to Boot
Once the provisioning of the requested instance is complete and the instance is in the “RUNNING” state, the operating system is signaled to start its boot up sequence.
The metric “Time to Boot” measures the total time needed to complete the operating system image boot process. Note that the boot process differs for a virtual machine (VM) instance and for a bare metal (BM) instance.
In both VM and BM cases, the boot process is complete when systemd reaches the multi-user.target milestone. The boot sequence consists of the following components, executed in the order shown:
-
Firmware Time – this is the time a BM system takes to initialize the hardware and execute the firmware sequence after the system is powered on. While systemd-analyze does not report firmware time for a VM instance, a VM has virtual firmware that is run during boot time.
-
Loader Time – this is the time on a BM system for the loader sequence to complete, primarily consisting of the time to load the OS image into memory, which depends upon choice of OS image. Again, there is no loader time reported by systemd-analyze on a VM instance. However, boot time on a VM does include a loader sequence.
-
Kernel Time – this is the the time for the system to load and start the kernel.
-
Initrd Time – this is the the time for the system to create the temporary root file system in memory and setup subsequent filesystem(s) after the kernel is started.
-
Userspace Time – this is the time for the system to complete any additional userspace initialization, which ends whens the systemd multi-user.target milestone is reached.
Each of the steps listed are factors that impact “Time to Boot” performance. Each of these steps may also be impacted by the time needed by the hypervisor to provide access to requested resources. Note that firmware is the only component over which the user can not exercise control.
Summary of key launch time metrics
The three key launch time metrics (for first boot of a cloud instance) may be summarized as follows:
-
“Time to Runnable” is a measure of cloud service provider performance, independent of the operating system image chosen.
-
“Time to SSH” is a measure that combines cloud service provider performance with operating system image boot up performance.
-
“Time to Boot” is a measure of operating system image boot up performance.
Measuring key launch time metrics
Given the explanations of the three key launch time metrics, how may an application be designed to measure them? Here are some ideas for each of the metrics – note that these methodologies are specific to the first boot and may differ for subsequent boots:
Time to Runnable
The time the state of the requested instance changes from “PROVISIONING” to “RUNNING”
-
Use cloud service APIs that allow users to query instance state. Wait until the instance reaches the “RUNNING” state
-
On OCI, this may be accomplished through use of the Python SDK [oci.wait.until() API)[https://oracle-cloud-infrastructure-python-sdk.readthedocs.io/en/latest/api/waiters.html] that accepts a parameter specifying maximum interval between queries. This value can be as low as 0.25 seconds.
-
On Amazon Web Services (AWS), this may be done through use of a similar Python SDK, [waiter.wait() API](https://boto3.amazonaws.com/v1/documentation/api/latest/reference/services/ec2.html#EC2.Waiter.InstanceExists).
Time to SSH
The time until SSH access is available
-
Repeatedly check for the SSH port to be available and attempt to SSH into the instance, or
-
Repeatedly check for a ping response, and then attempt to run a command using SSH. It is a good idea to have a timeout here so as to not wait too long between retries.
-
One has to wait until the instance is in the “RUNNING” state before attempting to SSH into it.
-
The NMap tool is one way to query the status of TCP ports on an instance.
-
“ssh machine /bin/true” is one command that when run successfully, would indicate SSH being available.
-
A timeout of 1 or 2 seconds would work well between SSH attempts.
Time to Boot
Once the instance is accessible via SSH, the timings for components of “Time to Boot”
Generate and parse the results of [systemd-analyze](https://man7.org/linux/man-pages/man1/systemd-analyze.1.html)
-
Useful systemd-analyze arguments include “blame”, “critical-chain” and “plot”
Launch Time Measurement Infrastructure
Using the definitions of the key launch time metrics and how to measure them, analysts may build an infrastructure to generate the measurements on a periodic basis. The following steps would be needed:
-
Define the sets of shapes and operating system images to be measured.
-
On OCI, the complete list of available shapes may be found on this page. These include shapes based on chipsets from Intel, AMD, and ARM which vary based on the number of cores, amount of RAM and number and type of disks requested.
-
On OCI, the list of available platform images is detailed on this page. These include various releases of Oracle Linux, as well as CentOS and Ubuntu Linux images.
-
The application accepts a list of shapes and images as input.
-
-
A launch time measurement application will loop through the set of defined (shape, OS image) combinations doing the following for each pair:
-
Get the latest cloud image for that particular OS
-
Check availability domains for resource availability (cores, RAM and / or disks)
-
Create a VM or BM instance in the cloud
-
Wait for the requested instance to enter “RUNNING” state
-
Wait until the instance can be accessed using SSH
-
SSH into the instance and capture systemd-analyze information
-
Terminate the instance
-
-
Save the launch time data into a database, for later analysis.
Monitoring Launch Time
In the Oracle Linux organization, we have built a measurement infrastructure as described in the previous section. We have extended this design in three ways to help continually improve OL launch time performance:
-
Automation allows us to achieve 24 x 7 constant monitoring so any glitches in operation or software are detected promptly with alerts generated.
-
Data Analytics is used to track the performance trends of OL based products and to compare them with similar products.
-
Machine Learning is used to automatically detect changes and to filter out noisy data. As as result, we can avoid issues related to human monitoring, such as exhaustion, fatigue, negligence or insufficient engineering time. We are able to identify performance changes early while reducing false positive rates.
Summary
We have described three key metrics by which launch time performance is measured and illustrated the relationships between them graphically. Approaches to measuring each of the metrics were discussed and shown how to be combined into a measurement infrastructure. Finally, we summarized how the Oracle Linux organization uses its measurement infrastructure to continually measure and monitor Oracle Linux launch time performance.