I’m excited to show you how LLMs can unlock the power of DTrace on your Linux systems. This blog is for system admininstrators and app developers who want better insights into what’s actually happening on their computers — maybe you’ve heard of DTrace, well, here’s how to make it work for you.
Over the years, we’ve worked hard to modernize DTrace and make it available to Linux users everywhere. We’ve done a ground-up rewrite of the DTrace code for Linux to make it faster and better incorporated into the Linux kernel and licensed dtrace-utils under the Universal Permissive License. Today, DTrace relies on ebpf and ftrace hooks to do everything that was previously accomplished with custom patches and libraries. We’ve made it faster, lower overhead, and easier to install – and with OLED tools, sometimes even rely on it for always-on diagnostics. But one barrier has remained, which is that most people don’t know how to write in the D language.
Here’s how you can dive into DTrace with the power of LLMs.
Unlocking DTrace with the power of AI
- Install dtrace.
dnf install dtrace - Download the dtrace llm file from github: https://github.com/oracle/dtrace-utils/blob/devel/llm/llms-dtrace-complete.txt
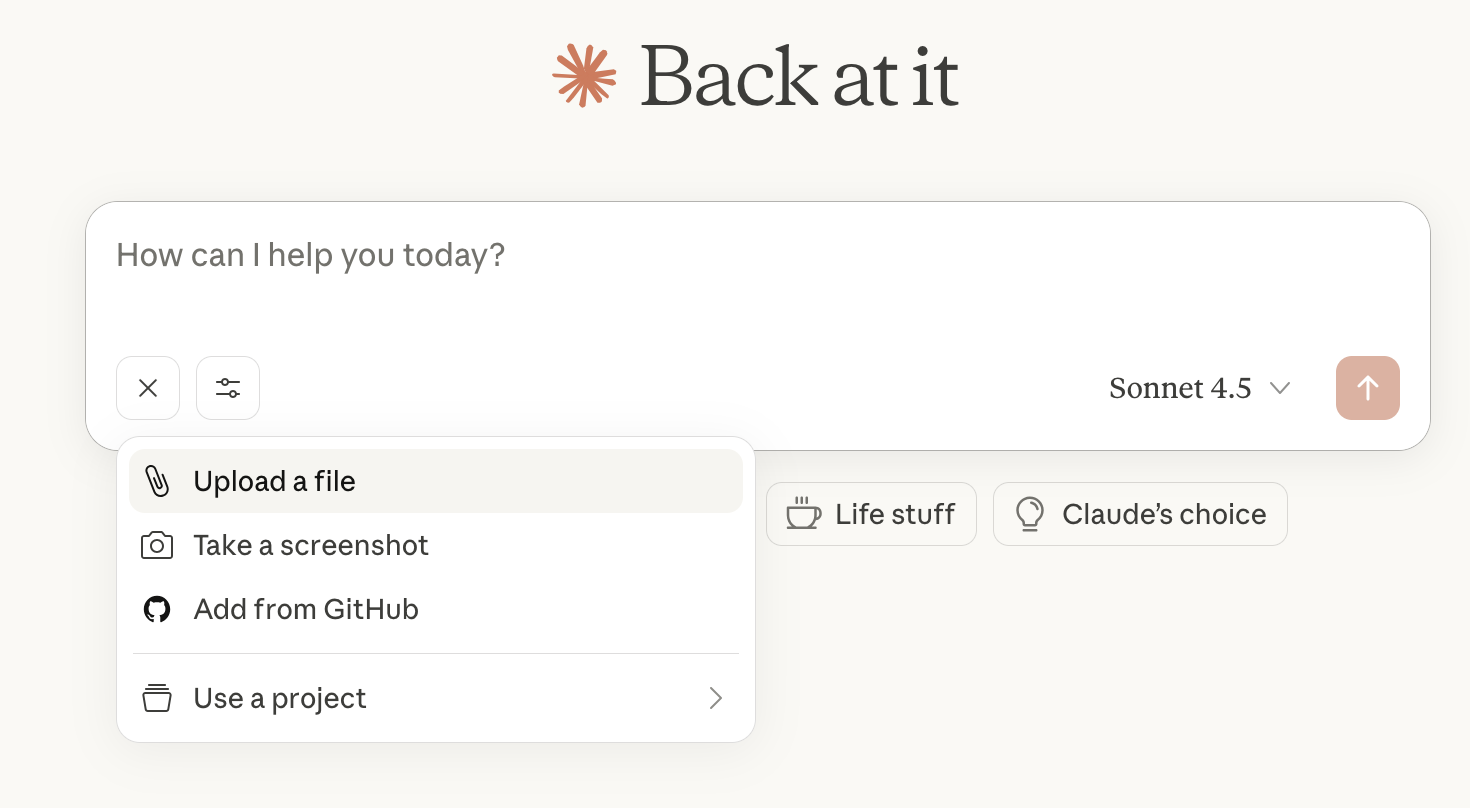
- Add it to your chat with the ‘+’ button.
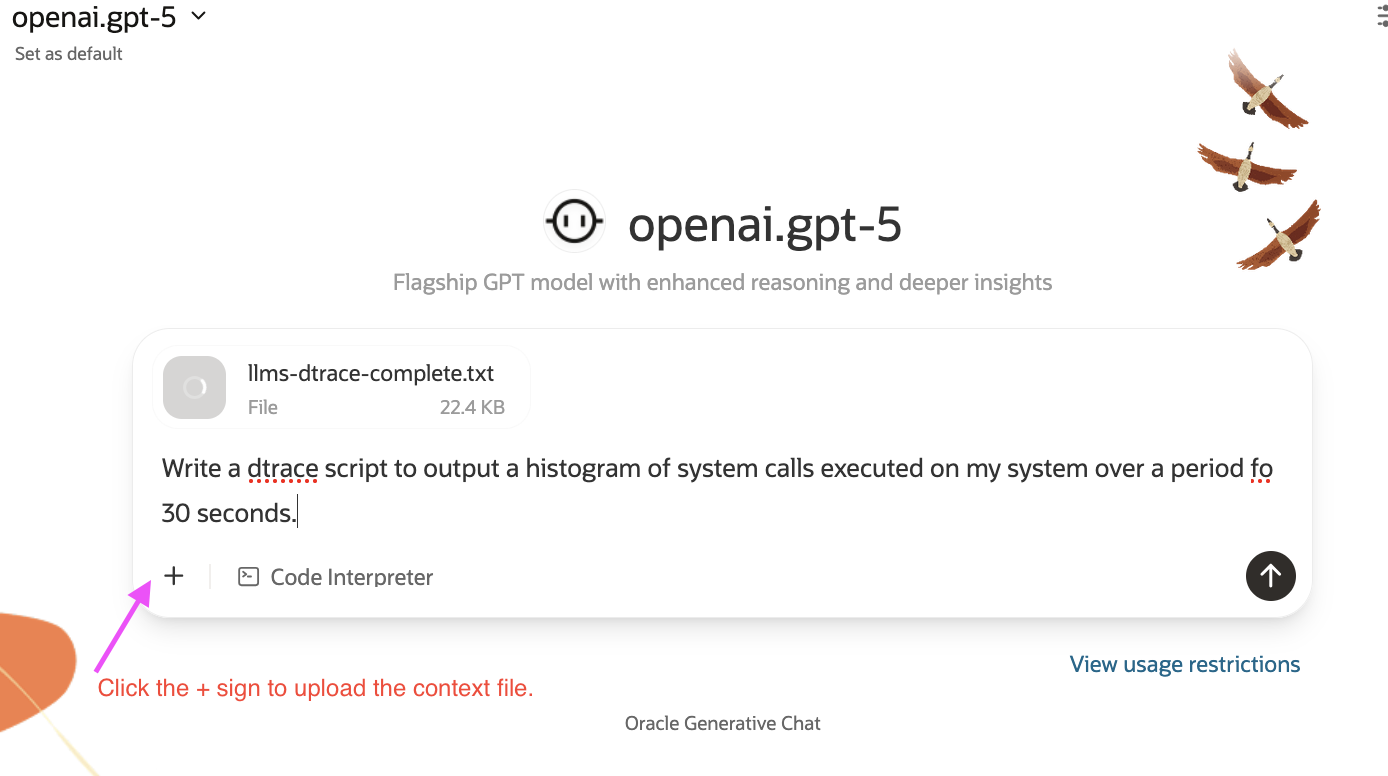
That’s it, from there you can ask the language model to suggest dtrace scripts for simple and complicated test cases!
I’m using Oracle’s chat tool with gpt-4.1 for this but you can do it just as easily in Claude, OpenAI, or your favorite LLM-assisted coding interface.
Loading the file as context gives the LLM context about how DTrace can be used to solve real problems. What should you ask? Here are some examples to get you started!
-
Write a DTrace script that will print the PID of any process that is accessing memory
-
Provide a DTrace script to count how many processes are started on the system in a 5 seconds time period
-
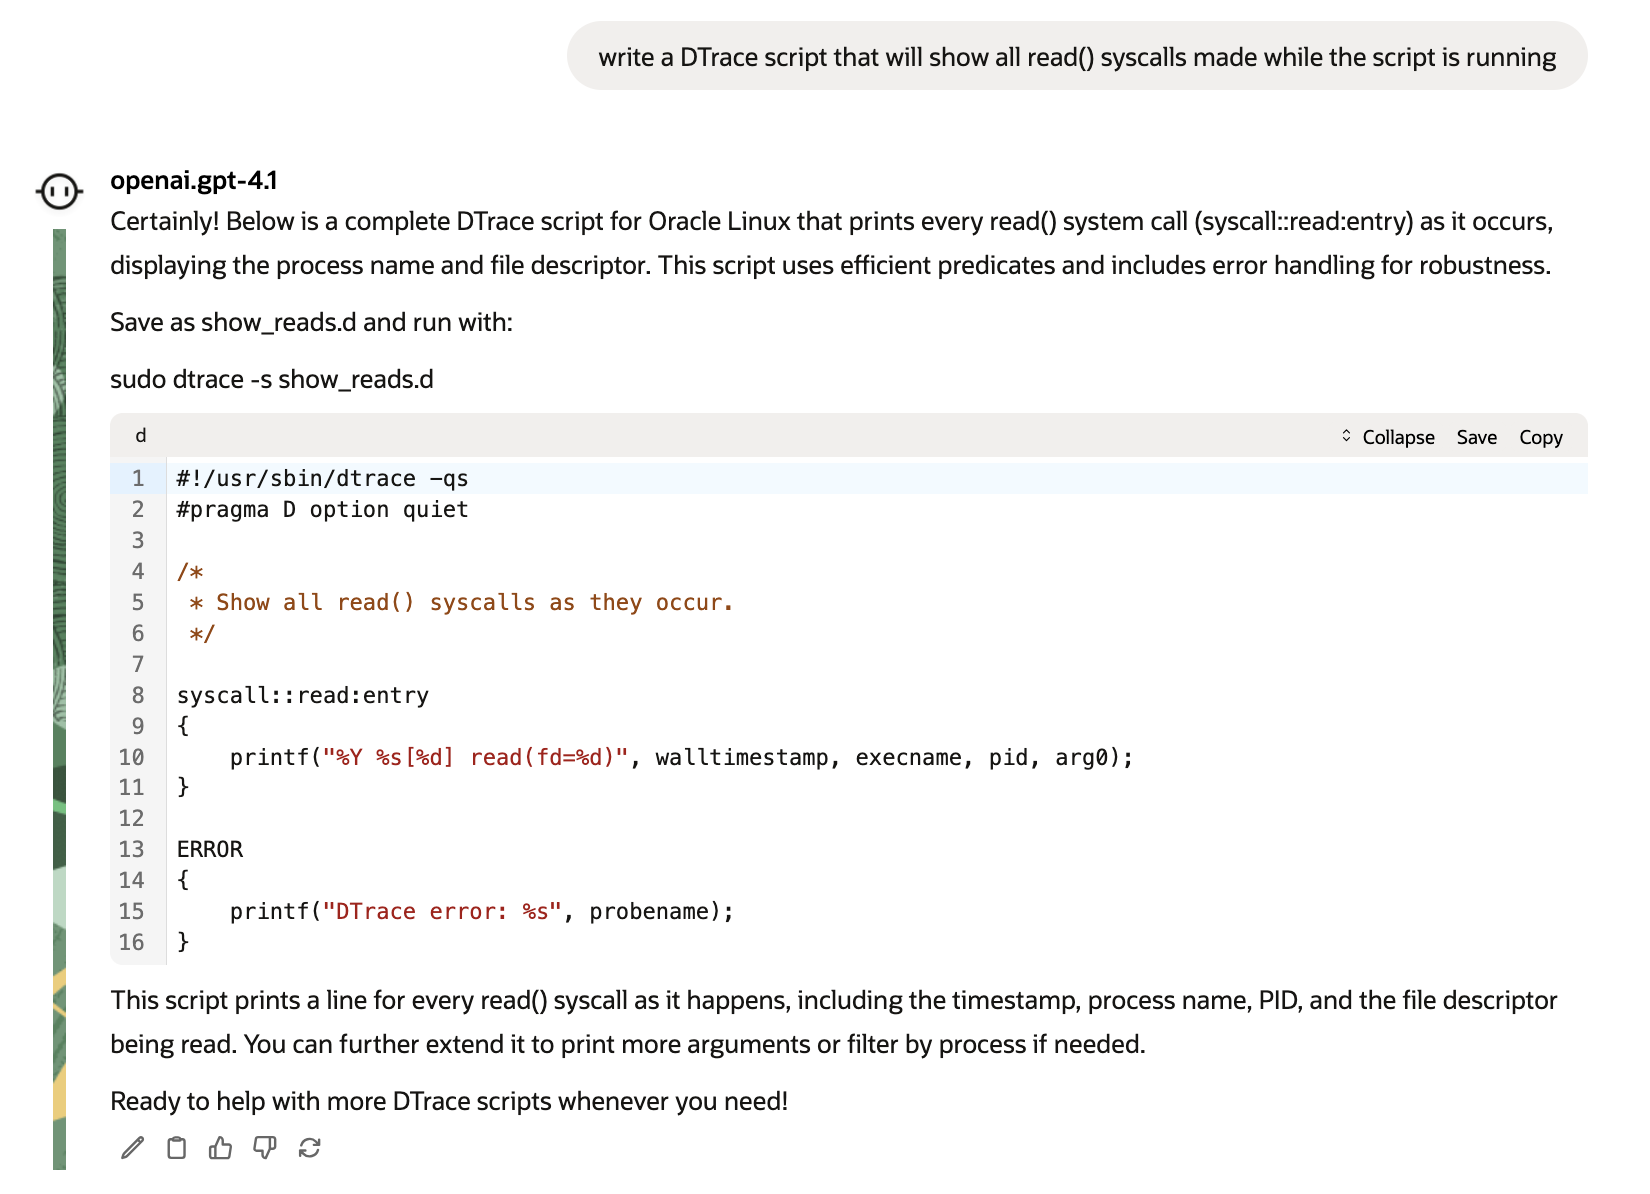
Write a DTrace script that will show all read() syscalls made while the script is running
About DTrace
DTrace is a powerful tracing tool that allows you probe up and down the stack, between your application and the kernel, seamlessly. The D language also present options for conveniently turning that data into histograms and other visualizations to help get insights quickly.
DTrace and Security
When leveraging AI language models to generate DTrace scripts the safety features of the D language, and DTrace’s default nondestructive mode, become apparent. LLMs, while helpful in quickly producing tracing scripts, will also produce code with errors, reference nonexistent probe points, or inadvertently suggest actions that could be disruptive if permitted. Because the D language is intentionally limited and DTrace operates in nondestructive mode by default, even scripts generated by an LLM are less likely to negatively impact your system.
Nondestructive mode acts as a guardrail, preventing scripts from performing any potentially harmful actions, even if the generated script includes such operations. This means you can experiment more freely with LLM-generated scripts, knowing that DTrace will refuse to execute actions that could modify the system state, damage files, or interrupt services.
DTrace’s design philosophy offers an extra layer of protection—especially helpful when running scripts you didn’t write by hand or fully review. For most observability and diagnostic scenarios, the language itself helps ensure that tracing remains safe and nonintrusive. Considering that tracing scripts run with elevated privileges, that’s an important guard rail.
It’s not perfect
This is a great way to get started with DTrace without having to learn the D language, but it doesn’t replace understanding what DTrace is doing behind the scenes. While we’ve had great success with simple DTrace scripts, as the complexity rises there are cases where the models won’t return valid DTrace scripts. But if you’ve gotten to that level of complexity, consider taking advantage of the free DTrace training resources on github and youtube!
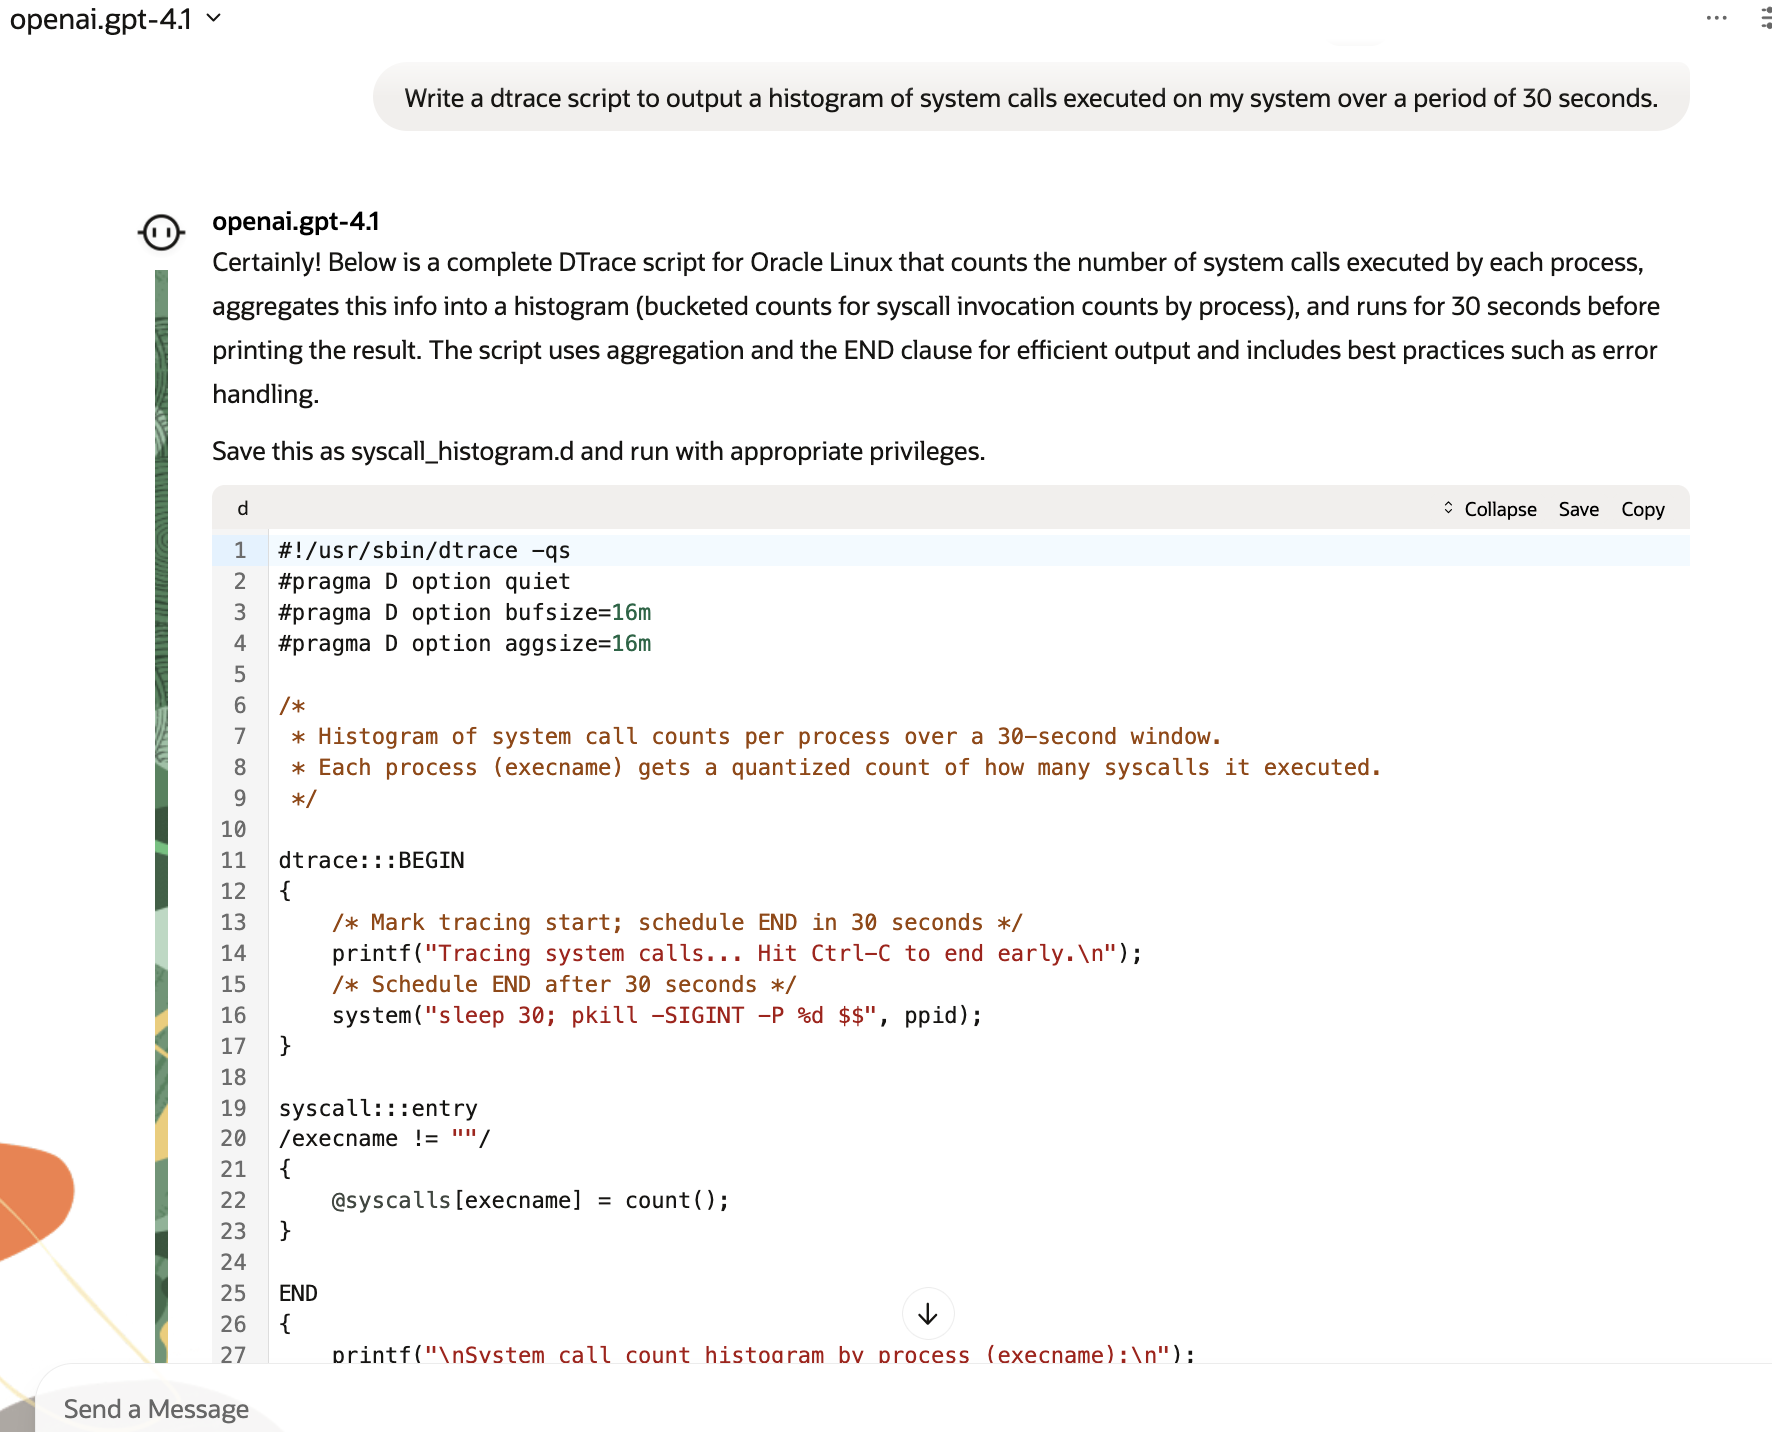
For example, even in the histogram example that’s screenshotted above, the first time I ran it I got the error, “dtrace: could not enable tracing: Destructive actions not allowed”. This speaks to the above comment about how DTrace is an intentionally nondestructive tracing language, and excels for this kind of “machine generation” as it will try hard not to do bad things to your system. In my case, I had two options: either enable destructive tracing (with the -w flag), or go back to the robot and tell it my error. I chose the second option, and the robot provided me two options to avoid the potentially destructive system() directives.
A full and freely available training module on advanced DTrace techniques (thanks Ruud van der Paas): https://oracle-samples.github.io/oltrain/tracks/ol/dtrace/.
And check out our other blog entries for plenty of other tips and tricks: https://blogs.oracle.com/linux/post/dtrace-for-the-application-developer-counting-function-calls.
Making it better
But we’re not done. One of the hazards with llm-generated tracing is that it may invent nonexistent tracepoints or operations. We haven’t solved that problem with our DTrace training script, and we’ve been hacking around on an MCP server that can also validate the correctness of a generated DTrace script. This will help for agentic debugging in the future, but I wanted to post this blog sooner since, well, it’s just really cool to be able to get simple DTrace scripts without having to learn the whole language.
Think of this as the successor to Brendan Gregg’s DTrace Toolkit, but instead of just example recipes, it’s tailored tracing just for your workload. Thanks to Bruce McCulloch for pulling this together!
Note on DTrace and Systemtap
Watch out which executable is being invoked: on some systems thedtraceexecutable on your $PATH was provided bysystemtap; the systemtap-provided `dtrace` does not have the same functionality. If you have problems, double check that you havedtraceinstalled or try calling the executable by its full pathsudo /usr/sbin/dtrace.