Introduction
RDMA over Converged Ethernet (RoCE) is a network protocol that allows remote direct memory access (RDMA) over an Ethernet network. This is accomplished by encapsulating an InfiniBand (IB) transport packet over Ethernet. Mellanox has introduced a few counters in MLNX_OFED 4.1 and kernel 4.12 to identify congestion related information in their RoCE networks. This blog provides information about these counters along with practical data to understand congestion.
The Counters
These counters are:
- rp_cnp_handled [Remote Point Congestion Notification Packets Handled]
- rp_cnp_ignored [Remote Point Congestion Notification Packets Ignored]
- np_cnp_sent [Notification Point Congestion Notification Packets Sent]
- np_ecn_marked_roce_packets [Notification Point Explicit Congestion Notification Marked Roce Packets]
Before diving in to understand the above counters, it is essential to know about Explicit Congestion Notification (ECN).
ECN enables end-to-end congestion notification between two endpoints which are ECN-enabled sender and receiver on TCP/IP based networks. Any device in the transmission path that does not support ECN disrupts the end-to-end ECN functionality. Unlike Congestion control algorithms like, slow start, restart, and AIMD (Additive Increase Multiplicative Decrease), the ECN algorithm works by informing the sender about congestion building up at the routers so that respective measures can be taken to avoid it. ECN is a Congestion Signaling Mechanism as defined in RFC 3168. It occupies two bits in the TCP header to negotiate about ECN and two bits in the IP header to indicate about congestion. The two bits in the IP Header are ECT (ECN Capable Transport) and CE (Congestion Experienced). Because of these two bits in the IP header, four code points are generated as shown below:
- [0 0] means non-ECT. That means the packet is not ECN supported. So there is no point in marking this packet. If there is congestion then this packet must be dropped instead of marking it.
- [0 1] is ECT(0) codepoint means the packet is ECT supported.
- [1 0] is ECT(1) codepoint, also means the packet is ECT enabled. If a packet is ECT(0) or (1) then this packet will not be dropped by the router instead it will be marked.
- [1 1] is CE codepoint. When the router is congested and the packet is ECT enabled then the router will mark this packet as CE. The router will flip the 0 bit of the ECT codepoint and make it CE. It does not drop the packet, just marks it and transfers it to the receiver.
The image below is a snapshot of tcpdump output, which highlights the congestion notification bits of a non-ECN enabled node.
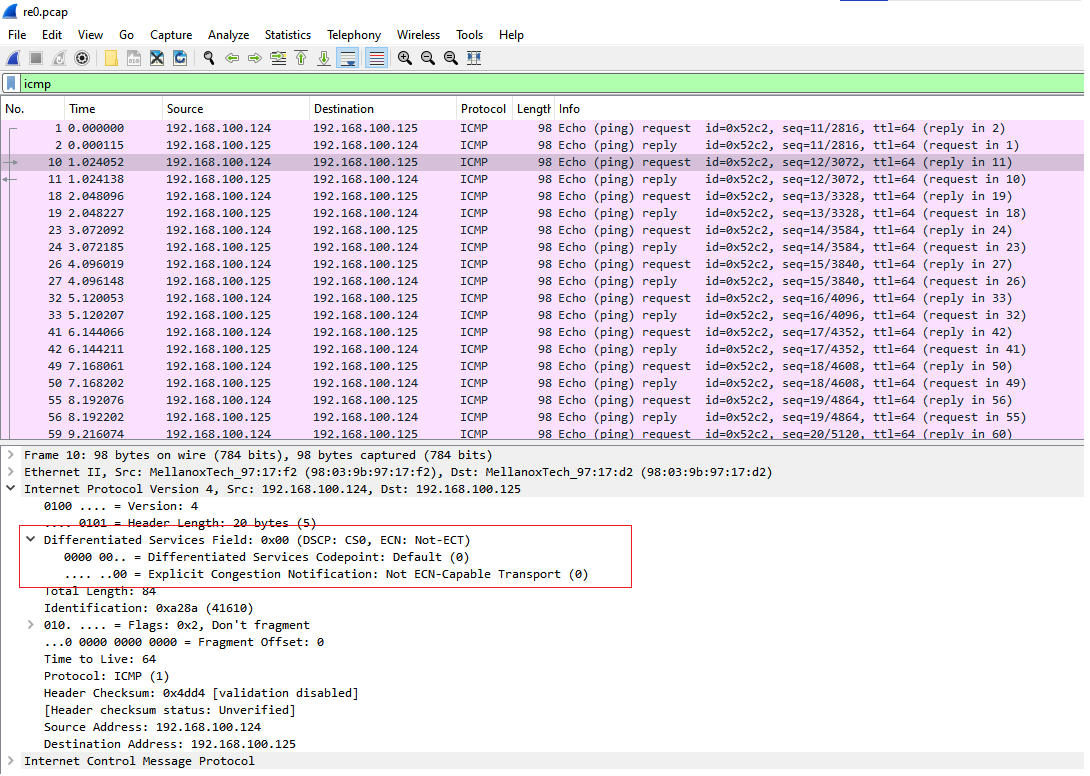
A Sender (Reaction Point – RP) who is capable of ECN, marks the packets with either ECT(0) or ECT(1). If these packets experience congestion during their transit through the ECN enabled switch, they will be marked as CE. Upon receiving these packets the Receiver Notification Point (NP) sends Congestion Notification Packets (CNP) to the Sender periodically. Reaction point, upon receiving these CNPs, will throttle down the speed at which the data is being sent.
CNP Counters
np_cnp_sent: This counter provides the number of congestion notification packets sent by the notification point when it has observed the CE bit in the RoCEv2 IP header (ECN bits).
rp_cnp_handled: This counter provides the number of congestion notification packets being handled by the reaction point to throttle the transmission rate.
These two counters get incremented in two different nodes, where congestion is being generated (rp_cnp_handled) and where congestion is being reported (np_cnp_sent). This phenomenon has been seen when a storage node experienced a surge in the number of rdma bytes being read – congestion is created and these CNP bits can be seen incrementing in the corresponding nodes
time      change in data traffic(Gbps)
--------------------------------------
10:37:52 0.394479
10:39:52 0.257222
10:41:52 8.17605
10:43:52 54.1771   <== Spike in the rdma bytes being sent from storage node (being read by compute node)
10:45:52 0.289964
10:47:52 0.344469
10:49:52 0.285193
10:51:52 20.9374
10:53:52 24.7994
10:55:53 4.85491
10:57:53 0.084384
10:59:53 0.0644531
11:01:53 0.0644531
11:03:53 0.0645313
11:05:53 0.0645617
time: 2022-06-15 10:43:40
np_cnp_sent                        0                             0
rp_cnp_handled                     0                             0
time: 2022-06-15 10:43:45
np_cnp_sent                        0                             0
rp_cnp_handled                     1106                          1552   <== At the same time, where there was a spike in the send_rdma_bytes, we see rp_cnp_handled growing.
time: 2022-06-15 10:43:50
np_cnp_sent                        0                             0
rp_cnp_handled                     790                           868
time: 2022-06-15 10:43:55
np_cnp_sent                        0                             0
rp_cnp_handled                     754                           1292
time: 2022-06-15 10:44:00
np_cnp_sent                        0                             0
rp_cnp_handled                     989                           1117
time: 2022-06-15 10:44:10
np_cnp_sent                        0                             0
rp_cnp_handled                     1290                          1287
time: 2022-06-15 10:44:20
np_cnp_sent                        0                             0
rp_cnp_handled                     1695                          1639
time: 2022-06-15 10:44:30
np_cnp_sent                        0                             0
rp_cnp_handled                     1471                          1240
time: 2022-06-15 10:44:40
np_cnp_sent                        0                             0
rp_cnp_handled                     1142                          918
time: 2022-06-15 10:44:50
np_cnp_sent                        0                             0
rp_cnp_handled                     155                           172
time: 2022-06-15 10:45:00
np_cnp_sent                        0                             0
rp_cnp_handled                     882                           715
time: 2022-06-15 10:45:10
np_cnp_sent                        0                             0
rp_cnp_handled                     109                           308
time: 2022-06-15 10:45:20
np_cnp_sent                        0                             0
rp_cnp_handled                     16                            19
time: 2022-06-15 10:45:25
np_cnp_sent                        0                             0
rp_cnp_handled                     0                             0
At the same time, we see another db node, which got affected because of this congestion reporting increment in the np_cnp_sent counter.
time: 2022-06-15 10:43:39
np_cnp_sent                        0                             0
rp_cnp_handled                     0                             0
time: 2022-06-15 10:43:44
np_cnp_sent                        5357                          9400 <== Increase in the np_cnp_sent on db node at the same time.
rp_cnp_handled                     20                            16
time: 2022-06-15 10:43:49
np_cnp_sent                        5149                          5352
rp_cnp_handled                     18                            13
time: 2022-06-15 10:43:54
np_cnp_sent                        4019                          7488
rp_cnp_handled                     10                            19
time: 2022-06-15 10:43:59
np_cnp_sent                        6065                          6628
rp_cnp_handled                     18                            17
time: 2022-06-15 10:44:10
np_cnp_sent                        8528                          5701
rp_cnp_handled                     15                            7
time: 2022-06-15 10:44:20
np_cnp_sent                        9960                          9042
rp_cnp_handled                     26                            11
time: 2022-06-15 10:44:30
np_cnp_sent                        7514                          5613
rp_cnp_handled                     20                            10
time: 2022-06-15 10:44:40
np_cnp_sent                        6935                          4623
rp_cnp_handled                     25                            6
time: 2022-06-15 10:44:50
np_cnp_sent                        940                           1496
rp_cnp_handled                     1                             1
time: 2022-06-15 10:45:00
np_cnp_sent                        5489                          4194
rp_cnp_handled                     13                            6
time: 2022-06-15 10:45:10
np_cnp_sent                        688                           5118
rp_cnp_handled                     2                             4
time: 2022-06-15 10:45:20
np_cnp_sent                        134                           607
rp_cnp_handled                     0                             0
time: 2022-06-15 10:45:25
np_cnp_sent                        0                             0
rp_cnp_handled                     0                             0
Two other counters are np_ecn_marked_roce_packets and rp_cnp_ignored. The first one provides details about the number of packets received by the Receiver (Notification Point) which are marked as Congestion Experienced whereas the second one provides the number of CNP packets received and ignored by the Sender (Reaction Point).
Summary
These congestion related counters provide information on which nodes in the cluster are creating/experiencing congestion, along with the intensity of the congestion. This helps in tracking down the applications which are responsible for generating congestion and take appropriate action.
References
- https://www.juniper.net/documentation/us/en/software/junos/cos/topics/concept/cos-qfx-series-explicit-congestion-notification-understanding.html
- ttps://www.geeksforgeeks.org/what-is-ecnexplicit-congestion-notification/
- https://enterprise-support.nvidia.com/s/article/understanding-mlx5-linux-counters-and-status-parameters