This blog entry was contributed by: Kurt Goebel, Ruud van der Pas, Vladimir Mezentsev. They work in the Oracle Linux Toolchain Team and are involved with gprofng on a daily basis.
Table of Contents
- Introduction
- Access the latest features: Build from source
- Getting started with the gprofng GUI
- Open Source community development
- Where to learn more about gprofng
Introduction
In this blog we explain how to build the latest version of gprofng and its GUI to make use of their latest features.
The GNU gprofng application profiling tool for Linux is a powerful, feature rich, and open source tool for C, C++, Java, Scala, and Fortran applications. It is part of GNU binutils.
Gprofng generates a runtime profile of an application. As the program executes, gprofng collects the performance data and stores the results in a directory, that is generally referred to as the “experiment directory” and is a directory that contains the results of the performance experiment. The performance data stored in this directory may be viewed in text format or in an html based format, through a browser.
In addition, gprofng has an add-on GUI (a FSF project hosted separately on Savannah.gnu.org), which further extends its analysis capabilities. This tool provides the ability to interactively explore the performance data that has been collected with gprofng.
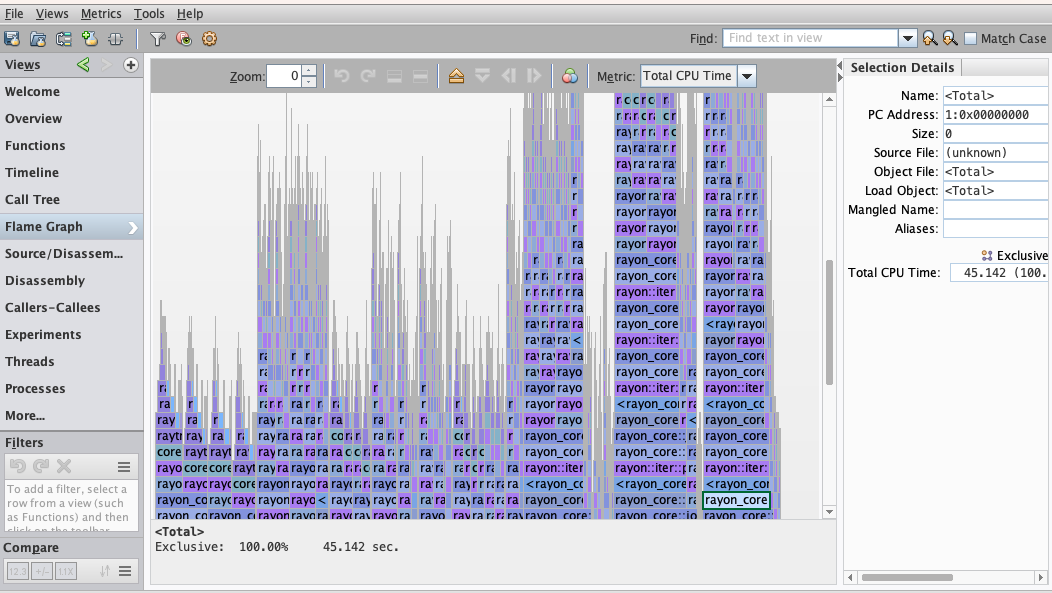
With the GUI, users can interactively collect runtime profile information, analyze application timelines, inspect multithreading behavior, compare multiple profiles, review runtime flame graphs, or browse through annotated source and assembly code listings to find the performance hot spots.
An example of gprofng GUI functionality (in this case a flame graph) can be seen in the screenshot below.
Both gprofng and its add-on GUI are active open source projects. New capabilities, additions, and bug fixes are constantly developed and added. Releases are made available asynchronously by both projects.
Examples of recently added features are the basic support for RISC-V, and the additional support for hardware event counters in processors from Arm, AMD (Zen4), and Intel (IceLake).
To learn more about these open source projects, and if you are interested to join and participate, please see the section Open Source Community Development below.
To learn more about gprofng, its GUI, and all they can do, please see the Where to learn more about gprofng below.
Access the latest features: Build from source
As mentioned in an earlier blog, several Linux distributions include packaged versions of gprofng, and possibly the GUI. Such packages are easy to install and may offer sufficient functionality, but they present an inherent delay relative to the latest upstream versions. There could actually be a significant lag between the packaged versions and the latest sources.
In order to take advantage of the latest features and bug fixes that are not available in such packages, it is possible to use the most recent upstream sources and build the tools yourself. In this section we describe how to do so.
Tips and tricks
Before we get to the steps and commands to build and install gprofng and the GUI, we would like to give some useful practical suggestions.
- Before you start, consider using the script(1) command to write a log of your session.
- GNU make supports the simultaneous execution of multiple targets (e.g. make --jobs=10). This may however make it difficult to find errors in the output. We recommend to use the --output-sync option to ensure that make saves the output from the commands it invokes, and prints it all, once the commands are completed.
- Carefully check the log for errors and warnings. For example the configuration step may show a message like this:
configure: WARNING: <package> is missing or unusable; some
features may be unavailable.
The above message suggests that package may need to be installed on the system used for the build and installation. Failure to resolve this, will most likely cause fatal errors later on. Note that package is just a placeholder here, you would see the name of a real package in the actual output. - Sometimes the above message is not sufficiently specific to guide you to the right package. In the directory where the failure happens, file config.log may identify a specific missing file, and your package manager may allow to search for it. For example, if config.log shows that javac is missing and the dnf package manager is used, you could try to find it using this command:
$ dnf --repo='*' whatprovides '*/javac'
- The --prefix option on the configure tool may be used to set an alternate installation directory. For example, it may be useful to have multiple versions of gprofng installed, or you might not have the permissions to store files in the default installation directory. We recommend that you use this option, as shown below below. After building and installing with such a custom prefix, make sure that the environment variables PATH, MANPATH and INFOPATH are set accordingly.
- Below it is explained how to create the user guide in the html and pdf formats. This is not done by default. If you would like to have the documentation in pdf, the texi2dvi tool needs to be installed along with the texinfo package. If it is not included in the texinfo package, try installing the texinfo-tex package.
An important note about Java support
Gprofng has the ability to profile Java applications. However, since gprofng is part of binutils, and binutils has no dependency on Java, a normal build of binutils will include no Java support in gprofng. This is the situation in the version of binutils and gprofng included in Linux distributions.
However, since in this case you are building gprofng for you own use, from the latest upstream sources, we recommend to enable Java support by installing Java on your system prior to starting the build process. If you are sure that Java profiling support will not be needed, it is not necessary to install Java prior to building binutils.
To verify whether the gprofng that you built includes support for Java applications, you should look in the build/gprofng/config.log file which is generated after the make step below. If you see this warning:
WARNING:  Cannot find the JDK include directory.
     gprofng will be build without support for profiling Java applications.
     Use --with-jdk=PATH to specify directory for the installed JDK
It means that Java is not installed and therefore gprofng has no ability to profile Java programs.
To install the necessary Java, you need to install the following RPM in Oracle Linux, Fedora or Red Hat Enterprise Linux based distros:
- java-17-openjdk-devel
Important: While above we list Java version 17, any version of Java 8 or higher will work here.
If you are using other operating systems, like Debian and its derivatives, where Java is packaged differently, you might need to install slightly different Java packages.
Note that, while Java is not required to build and run gprofng (unless you want to profile Java applications), it is required to build and run its GUI, as indicated in the section below.
Before you begin
- 1. Set paths correctly
-
By default, the tools that are used to configure and build binutils are installed in the /usr/bin directory. Make sure that you have that location in your executable search path. For example, like this (the full value of PATH will vary depending on how your environment is set up):
$ echo $PATH
  /usr/local/bin:/usr/local/sbin:/usr/bin
Using the following command you can verify if the gcc compiler is found. You get the following output if gcc is in your path, otherwise you will get an error saying it was not found:$ which gcc /usr/bin/gcc
If you don’t have that location in your environment, you can add it like this:$ export PATH=/usr/bin:$PATH
- 2. Verify prerequisites
-
To build GNU binutils from the sources in its main repository, it is important to configure the system with the most recent compilers, libraries, and operating system. In addition, depending on your Linux distribution, you might need to install the following:
- git-core: the Git program used to obtain the sources
- git-core-doc: if you want to have the Git documentation handy
- texinfo: to build the documentation in info format
- texinfo-tex: to build the PDF documentation
- aclocal: to build the GUI
- automake: to build the GUI
- java: to build the GUI and (if desired) to get Java support in gprofng
The list of prerequisites may change depending on your operating system, and over time the upstream binutils sources and the GUI sources could change to require extra or different packages. The list above is a snapshot of the recommended packages as of mid 2024 for Oracle Linux, Red Hat Enterprise Linux or Fedora distributions. Your system may use different packages. If there are build failures, you may need to search for other packages to install.
Build and install gprofng from the latest source
The gprofng source code is distributed as part of the GNU binutils tools suite. To build gprofng from source, binutils needs to be built.
- 1. Clone the sources
-
Clone the upstream binutils repository. This is the command to clone from the master branch at sourceware.org:
$ cd <path-to-your-home-dir>                       # Start in your home directory
$ git clone http://sourceware.org/git/binutils-gdb.git   # Get the sources (will create binutils-gdb directory)
This will create the directory binutils-gdb which contains all the upstream code. - 2. Configure
-
The configure tool that comes with binutils supports many options. They are listed with the configure --help command.
We recommend that you install the built binaries in a location different from the default one (the /usr/local/bin directory). To achieve this, during the configure step, use the option to select the location for the installation: --prefix=<absolute-path-to-installation-directory>. If you do not change the installation location from the default, the binutils and gprofng you build will overwrite the default binaries, which is not appropriate and could create problems later on. In addition, make sure to adjust the search path to have this location included first. Otherwise, you will still use the default version.
Keep in mind that the binutils-gdb code repository also includes gdb and other tools, so unless you want to build those too (which might require additional dependencies to be installed) you will find it more convenient to restrict which part of the repository to build. We advise to disable the following subdirectories from being built: gdb, sim, gdbserver.
After this explanation, let’s see what the full commands for configuring are (assuming you build in your home directory under a directory called gprofng-build and install in a directory at the same level called gprofng-install):
$ pwd                                     # In your home directory
  <path-to-your-home-dir>
$ mkdir gprofng-build                     # Create build directory
$ mkdir gprofng-install                   # Create install directory
$ ls
  binutils-gdb gprofng-build gprofng-install
$ cd gprofng-build                        # In the build directory
$ ../binutils-gdb/configure \             # Invoke the configure script
     --prefix=<path-to-your-home-dir>/gprofng-install \
     --disable-gdb --disable-sim --disable-gdbserver
Note that the gprofng-build directory is not under the source directory but it is outside of it. Building inside the source tree is not supported by binutils. This is because it could create confusion in case of multiple make and make clean and also in case additional builds for different target hardware are desired from the same sources.
- 3. Build and install
-
In this step, while still in the gprofng-build directory, binutils (including gprofng) is built and installed:
$ make
$ make install
- 4. Build the gprofng user guide in HTML and PDF formats
-
While the info and man files are generated when building binutils, the make file also supports the creation of the user guide in html and pdf format. These may be easier to view and navigate than the info file.
Below are the steps needed to get the files in the html and pdf formats. As explained earlier, make sure to have the texi2dvi tool installed first.
$ cd <path-to-your-home-dir>/gprofng-build
$ make html              # Generate the html file
$ make install-html      # Install the html file
$ make pdf               # Generate the pdf file
$ make install-pdf       # Install the pdf file
- 5. Verify the installation
-
After these steps you should see the following in your install directory:
$ ls <path-to-your-home-dir>/gprofng-install
  bin  etc  include  lib  share  x86_64-pc-linux-gnu

$ ls <path-to-your-home-dir>/gprofng-install/bin/                    # Verify binaries
  addr2line  c++filt     gp-collect-app   gp-display-text  ld      objcopy  readelf  strip
  ar         elfedit     gp-display-html  gprof            ld.bfd  objdump  size
  as         gp-archive  gp-display-src   gprofng          nm      ranlib   strings

$ ls <path-to-your-home-dir>/gprofng-install/share/man/man1/gprofng* # Verify man pages
  gprofng.1              gprofng-collect-app.1   gprofng-display-src.1
  gprofng-archive.1      gprofng-display-html.1  gprofng-display-text.1

$ ls <path-to-your-home-dir>/gprofng-install/share/info/gprofng*     # Verify info files
  gprofng.info

$ ls <path-to-your-home-dir>/gprofng-install/share/doc/gprofng*      # Verify docs
  gprofng.html gprofng.pdf
The user guide in html and pdf formats will be found in the <path-to-your-home-dir>/gprofng-install/share/doc/ directory - 6. Make it available for use
-
At this point you should make sure that the installation directory is in your search paths for executables, manuals and info. This is achieved as follows for binaries:
$ export PATH=<path-to-your-home-dir>/gprofng-install/bin:$PATH

$ which gprofng                                                       # Verify it can be found
  <path-to-your-home-dir>/gprofng-install/bin/gprofng
For man and info commands to find the newly built man pages and info files, you need to make sure that paths to the installed manual pages and info files locations are known. There are two ways to achieve this. The first one is to set two environment variables, the other is to simply pass the directory where the files are to each invocation of the commands. Either like this, followed by regular man and info invocations:
$ export MANPATH=<path-to-your-home-dir>/gprofng-install/share/man:$MANPATH
$ export INFOPATH=<path-to-your-home-dir>/gprofng-install/share/info/:$INFOPATH
$ info gprofng
  # Output here
$ man gprofng
  # Output here
Or by invoking the following, without setting the path environment variables:
$ info -d <path-to-your-home-dir>/gprofng-install/share/info/ gprofng
$ man -l <path-to-your-home-dir>/gprofng-install/share/man/man1/gprofng.1
To start using gprofng, please check the on-line user guide and tutorial that is available as an info file:
$ info gprofng
Build and install gprofng GUI from the latest source
The gprofng GUI is a portable Java application that utilizes the Swing GUI framework.
Important: Since the gprofng GUI relies on Java, Java 8 or later must be installed on the system where the GUI is to be built and installed.
To build the latest gprofng GUI, the gprofng-gui git repo needs to be cloned from the development source. The steps are very similar to those for binutils, but one additional step is needed.
The autoreconf command needs to be executed as the first step. This is needed in order to generate the necessary files to be used by the configure step. Autoreconf will need to be executed in the source directory, rather than in the build directory (the reason is that generated files are not stored in the source repository, per FSF guidelines).
These are the steps required to build and install the gprofng GUI:
- 1. Clone the sources, build and install the GUI
-
$ cd <path-to-your-home-dir>                            # Start in your home directory
$ git clone https://git.savannah.gnu.org/git/gprofng-gui.git  # Get the sources (will create gprofng-gui directory)
$ cd gprofng-gui                                              # Navigate to the source directory
$ autoreconf -i -f                                            # Execute autoreconf
$ cd ..                                                       # Back to your home dir
$ mkdir gprofng-gui-build                                     # Create directory for the build
$ mkdir gprofng-gui-install                                   # Create directory for installed files
$ cd gprofng-gui-build/                                       # Navigate to the build directory
$ ../gprofng-gui/configure --prefix=<path-to-your-home-dir>/gprofng-gui-install  # Configure
$ make                                                        # Do the build
$ make install                                                # Install binaries, etc
Just as with binutils, it is best to keep the source directory, the build directory and the install directory separate (as in the commands above). Similarly to binutils, we recommend that, since you are building your own copy, you do not overwrite any standard installation. To this purpose, the --prefix option on the configure tool is used to change the location of the installation (the default would be to install the GUI components in the /usr/local directory).
Important: The GUI does not need to be installed in the same location where binutils is installed, however the gprofng GUI requires gprofng to be installed on the system where applications will be profiled.
- 2. Build the gprofng GUI user guide in HTML and PDF formats
-
Just as with gprofng in binutils, the GUI documentation is not generated in the html and pdf formats by default. The steps required to generate the user guide in these other formats are very similar to what is needed for the gprofng documentation. Just as with gprofng, for the pdf, texi2dvi needs to be installed.
Below are the necessary commands:
$ cd <path-to-your-home-dir>/gprofng-gui-build  # Navigate to build directory
$ make html                                     # Generate the html file
$ make install-html                             # Install the html file
$ make pdf                                      # Generate the html file
$ make install-pdf                              # Install the html file
- 3. Verify the installation
-
After the GUI is built and installed, you should verify that you have the following directory structure in your installation location:
$ ls <path-to-your-home-dir>/gprofng-gui-install
  bin share

$ ls <path-to-your-home-dir>/gprofng-gui-install/bin             # Verify binaries
  gp-display-gui

$ ls <path-to-your-home-dir>/gprofng-gui-install/share/info      # Verify info files
  dir  gprofng-gui.info

$ ls <path-to-your-home-dir>/gprofng-gui-install/share/man/man1   # Verify man pages
  gprofng-display-gui.1

$ ls <path-to-your-home-dir>/gprofng-gui-install/share/doc/gprofng-gui  # Verify docs
  gprofng-gui.html  gprofng-gui.pdf
- 4. Make it available for use
-
At this point you should adjust the PATH, MANPATH, and INFOPATH environment variables to include the location of the GUI. Like this:
$ export PATH=<path-to-your-home-dir>/gprofng-gui-install/bin:$PATH

$ which gp-diplay-gui                                        # Verify the executable can be found
     <path-to-your-home-dir>/gprofng-gui-install/bin/gp-display-gui
Similarly to the gprofng case for the manual and info pages to be found you have the two options:$ export MANPATH=<path-to-your-home-dir>/gprofng-gui-install/share/man:$MANPATH $ export INFOPATH=<path-to-your-home-dir>/gprofng-gui-install/share/info/:$INFOPATH $ info gprofng-gui # Output here $ man gp-display-gui # Output here
Or by invoking the following, without setting the path environment variables:
$ info -d <path-to-your-home-dir>/gprofng-gui-install/share/info/ gprofng-gui
  # Output here
$ man -l <path-to-your-home-dir>/gprofng-gui-install/share/man/man1/gp-display-gui.1
  # Output here
Getting started with the gprofng GUI
To start using the gprofng GUI, please check the user guide that is available in info format. It has been generated as part of the installation and may be viewed using the info command:
$ info gp-gui-ug
$ man gp-display-gui
Once gprofng, the add-on GUI, and Java have been installed, the search paths have been adjusted or set, the gprofng command that invokes the GUI can be used:
$ gprofng display gui
This is only one of several gprofng commands. There are many useful options for each command. For information on all the commands and options, please see the Where to learn more about gprofng section below. In future blogs we will explain how to use the gprofng GUI and its capabilities in more detail.
Analysis of remote applications
Increasingly, the applications that users and developers want to profile are on a remote system, like a cloud instance. The question is how run the GUI in this kind of a scenario.
One simple alternative is to run the GUI on the remote system, and then connect to the system using a remote desktop connection like VNC viewer.
In addition to this, work is underway to add a remote analysis capability directly into the GUI, thereby allowing the GUI to run on any Java client e.g., a laptop or desktop running Linux or another popular operating system. Users of the GUI on the Java client could then connect from within the GUI to remote hosts running gprofng.
Staying current with the GUI open source project will ensure you have full access to new features such as remote analysis, as soon as they are released.
Open Source community development
Both gprofng and its add-on GUI are GNU open source community projects.
If you are interested to read up on the discussions around the development of gprofng, or actively participate in the development community around these profiling tools, some good starting points are listed below. As we continue to develop these tools, we encourage you to send your feedback.
The GNU binutils mailing list archive which is a record of developer collaboration. As you can see, there are quite some activities around gprofng and we would like to thank the binutils community for their feedback, discussions and contributions. There is also a gprofng GUI summary that is worth reading.
Any issues encountered while using gprofng, or suggestions for improvement, can be filed in the Sourceware Bugzilla. The developers of gprofng can be reached on the binutils mailing list.
The gprofng GUI project is hosted on savannah.gnu.org under the GPLv3+ license. To report any issues found during installation or usage of the GUI, or to request any additional functionality please report a bug or send a message to the GUI mailing list.
Where to learn more about gprofng
For those interested to learn more about gprofng, or to see how other developers have used gprofng to gain insights into the runtime behavior of their application, the following blogs, videos and documents may be of interest.
Blogs
- An overview of gprofng
- Learn to profile and analyze application performance with gprofng
- Java Profiling
- Latest updates and development
- A case study for a Java application
Recorded presentations
- NHR PerfLab Seminar: gprofng – The Next-Generation GNU Profiling Tool
- gprofng: The next generation GNU profiling Tool – GNU Tools Cauldron 2022
- gprofng: The Next Generation GNU Profiling Tool for Linux
- BID23 – gprofng: The Next Generation GNU Profiling Tool