Introduction
In real-world systems, storage rarely performs as predictably as in laboratory conditions, latency often appears unexpectedly. Even a few extra milliseconds can lead to slower database queries, web timeouts, or degraded user experiences. Such conditions typically arise from busy networks, shared storage, or high system load, making it difficult for developers and operators to anticipate and troubleshoot performance bottlenecks.
dm-delay bridges that gap. As a Linux Device Mapper target, it lets you inject configurable delays into I/O operations, providing a practical way to simulate slow or congested storage. This makes it easier to study how systems respond under adverse conditions without relying on unpredictable real-world failures.
How It Works
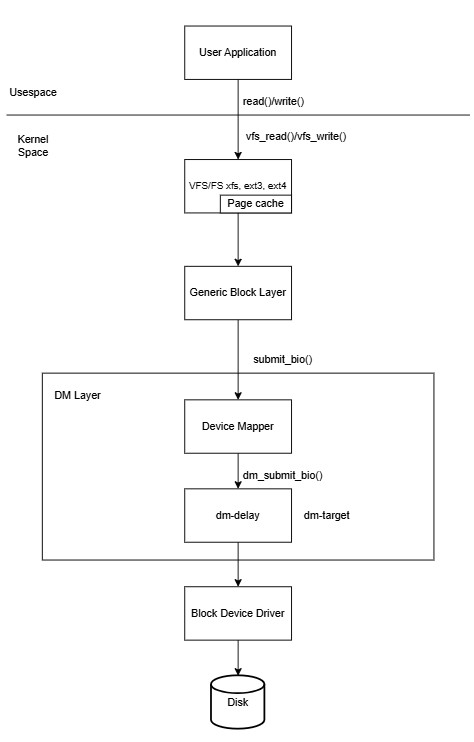
The dm-delay target intercepts every read and write request sent to its virtual block device. Before passing the request to the underlying physical device, it introduces a specified delay in milliseconds.
One of its key features is its ability to configure different delays for read and write operations. This is particularly useful for simulating real-world scenarios where read and write latencies often differ due to hardware or network characteristics.
Behind the scenes
Under the hood, dm-delay is implemented as a kernel module in the Linux device-mapper framework. When an I/O request arrives at the delayed device, instead of being immediately dispatched to the underlying block device, it is enqueued and scheduled for later execution. This scheduling is done using delayed workqueues inside the kernel.
Here’s what happens step by step:
I/O Interception: When a read or write request targets the delay type device, the dm-delay module captures it before it reaches physical storage.
Timer Assignment: Based on the configuration (delay_ms for reads, and optionally a different delay for writes), the request is wrapped in a structure with a timer attached.
Delayed Workqueue: The request is pushed into a kernel workqueue with the specified delay. Only after the timer expires is the request re-queued for processing. The delay is calculated by:
expires = jiffies + msecs_to_jiffies(c->delay);Here c->delay is the configured delay, it can differ for reads and writes.
Forwarding to Backing Device: Once the delay has elapsed, the request is handed over to the actual backing device (e.g., /dev/loop0 in our example). At this point, the I/O behaves normally.
This design is efficient because:
- The delays are enforced without busy-waiting, so no CPU cycles are wasted.
- Multiple requests can be tracked independently, allowing precise per-request delay injection.
- Read and write paths can be configured separately, simulating asymmetric workloads such as network-based storage.
By abstracting the delays at the block layer, dm-delay can transparently emulate slow disks without requiring application changes.
Setup a dm-delay device
Let’s walk through creating a virtual device that simulates a slow disk with a 250ms read delay and a 250ms write delay.
Step 1: Prerequisites
Make sure the dm-delay kernel module is loaded. Most modern kernels load Device Mapper targets on demand, but you can load it manually to be sure.
$ sudo modprobe dm-delayStep 2: Prepare a backing device
For a safe test, we’ll create a 50G file and use it as a loopback device. This will be our “fast” physical storage.
$ dd if=/dev/zero of=fast_storage.img bs=1M count=51200
$ sudo losetup /dev/loop0 fast_storage.img
Step 3: Create the dm-delay Device
Now, we’ll create a virtual device named slow-dev. It will use /dev/loop0 for both reads and writes but apply different delays to each.
dmsetup table format
0 <sectors> delay <read_device> <offset> <delay_ms> [<write_device> <write_offset> <write_delay_ms>]where:
<sectors>: The size of the virtual device in 512-byte sectors.delay: Target type.<read_device>: The path to the underlying block device for handling IO.<offset>: The starting sector on the read device.<delay_ms>: The delay in milliseconds to apply to every read request.<write_device> <write_offset> <write_delay_ms>: (Optional) If provided, write operations are sent to<write_device>and delayed by<write_delay_ms>.
If omitted, writes are sent to the same device as reads and use the same<delay_ms>.
A 50G device has (50 x 1024 x 1024 x 1024)/512 = 104857600 sectors.
$ sudo dmsetup create slow-dev --table "0 104857600 delay /dev/loop0 0 250 /dev/loop0 0 250"Verify the device creation:
$ dmsetup  table
slow-dev: 0 104857600 delay 8:0 0 250 8:0 0 250
$ ls -l /dev/mapper/slow-dev
/dev/mapper/slow-devStep 4: Observe the Latency
Let’s test its read/write performance. We’ll use the fio utility to measure the impact of our added delay.
Note: To avoid caching effects, we will perform direct reads and writes to the device.
Run fio on the delay device:
Read operation on delay type dm device
randreadlatency-test-job: (g=0): rw=randread, bs=(R) 4096B-4096B, (W) 4096B-4096B, (T) 4096B-4096B, ioengine=libaio, iodepth=1
fio-3.35
Starting 1 process
Jobs: 1 (f=1): [r(1)][100.0%][r=16KiB/s][r=4 IOPS][eta 00m:00s]
randreadlatency-test-job: (groupid=0, jobs=1): err= 0: pid=3621759: Thu Sep 25 09:09:24 2025
  read: IOPS=3, BW=12.8KiB/s (13.1kB/s)(388KiB/30214msec)
    slat (usec): min=51323, max=66321, avg=58829.28, stdev=2586.76
    clat (msec): min=245, max=257, avg=252.64, stdev= 2.43
     lat (msec): min=303, max=319, avg=311.47, stdev= 2.54		#Average read latency on delay device.
    clat percentiles (msec):
     |  1.00th=[  247],  5.00th=[  249], 10.00th=[  251], 20.00th=[  251],
     | 30.00th=[  253], 40.00th=[  253], 50.00th=[  253], 60.00th=[  253],
     | 70.00th=[  255], 80.00th=[  255], 90.00th=[  255], 95.00th=[  257],
     | 99.00th=[  257], 99.50th=[  257], 99.90th=[  257], 99.95th=[  257],
     | 99.99th=[  257]
   bw (  KiB/s): min=    8, max=   16, per=93.45%, avg=12.72, stdev= 3.90, samples=60
   iops        : min=    2, max=    4, avg= 3.13, stdev= 0.96, samples=60
  lat (msec)   : 250=13.40%, 500=86.60%
  cpu          : usr=2.35%, sys=12.74%, ctx=196, majf=0, minf=8
  IO depths    : 1=100.0%, 2=0.0%, 4=0.0%, 8=0.0%, 16=0.0%, 32=0.0%, >=64=0.0%
     submit    : 0=0.0%, 4=100.0%, 8=0.0%, 16=0.0%, 32=0.0%, 64=0.0%, >=64=0.0%
     complete  : 0=0.0%, 4=100.0%, 8=0.0%, 16=0.0%, 32=0.0%, 64=0.0%, >=64=0.0%
     issued rwts: total=97,0,0,0 short=0,0,0,0 dropped=0,0,0,0
     latency   : target=0, window=0, percentile=100.00%, depth=1

Run status group 0 (all jobs):
   READ: bw=12.8KiB/s (13.1kB/s), 12.8KiB/s-12.8KiB/s (13.1kB/s-13.1kB/s), io=388KiB (397kB), run=30214-30214msec
Read operation on linear type dm device
randreadlatency-test-job: (g=0): rw=randread, bs=(R) 4096B-4096B, (W) 4096B-4096B, (T) 4096B-4096B, ioengine=libaio, iodepth=1
fio-3.35
Starting 1 process
Jobs: 1 (f=1): [r(1)][100.0%][r=170MiB/s][r=43.5k IOPS][eta 00m:00s]
randreadlatency-test-job: (groupid=0, jobs=1): err= 0: pid=3621778: Thu Sep 25 09:11:07 2025
  read: IOPS=43.5k, BW=170MiB/s (178MB/s)(5094MiB/30001msec)
    slat (usec): min=4, max=214, avg= 7.12, stdev= 1.41
    clat (nsec): min=771, max=3825.1k, avg=15142.42, stdev=8192.35
     lat (usec): min=10, max=3831, avg=22.26, stdev= 8.30		#Average read latency on linear device.
    clat percentiles (usec):
     |  1.00th=[   11],  5.00th=[   12], 10.00th=[   14], 20.00th=[   15],
     | 30.00th=[   15], 40.00th=[   15], 50.00th=[   16], 60.00th=[   16],
     | 70.00th=[   16], 80.00th=[   16], 90.00th=[   17], 95.00th=[   18],
     | 99.00th=[   25], 99.50th=[   26], 99.90th=[   32], 99.95th=[   42],
     | 99.99th=[  130]
   bw (  KiB/s): min=171256, max=180536, per=100.00%, avg=173895.19, stdev=1503.72, samples=59
   iops        : min=42814, max=45134, avg=43473.80, stdev=375.93, samples=59
  lat (nsec)   : 1000=0.07%
  lat (usec)   : 2=0.19%, 4=0.01%, 10=0.72%, 20=95.95%, 50=3.03%
  lat (usec)   : 100=0.02%, 250=0.01%, 500=0.01%, 750=0.01%, 1000=0.01%
  lat (msec)   : 2=0.01%, 4=0.01%
  cpu          : usr=20.16%, sys=49.46%, ctx=1304452, majf=0, minf=12
  IO depths    : 1=100.0%, 2=0.0%, 4=0.0%, 8=0.0%, 16=0.0%, 32=0.0%, >=64=0.0%
     submit    : 0=0.0%, 4=100.0%, 8=0.0%, 16=0.0%, 32=0.0%, 64=0.0%, >=64=0.0%
     complete  : 0=0.0%, 4=100.0%, 8=0.0%, 16=0.0%, 32=0.0%, 64=0.0%, >=64=0.0%
     issued rwts: total=1303994,0,0,0 short=0,0,0,0 dropped=0,0,0,0
     latency   : target=0, window=0, percentile=100.00%, depth=1

Run status group 0 (all jobs):
   READ: bw=170MiB/s (178MB/s), 170MiB/s-170MiB/s (178MB/s-178MB/s), io=5094MiB (5341MB), run=30001-30001msec
Write operation on delay type dm device
randwritelatency-test-job: (g=0): rw=randwrite, bs=(R) 4096B-4096B, (W) 4096B-4096B, (T) 4096B-4096B, ioengine=libaio, iodepth=1
fio-3.35
Starting 1 process
Jobs: 1 (f=1): [w(1)][100.0%][w=12KiB/s][w=3 IOPS][eta 00m:00s]
randwritelatency-test-job: (groupid=0, jobs=1): err= 0: pid=3621845: Thu Sep 25 09:15:58 2025
  write: IOPS=2, BW=11.5KiB/s (11.8kB/s)(348KiB/30147msec); 0 zone resets
    slat (msec): min=48, max=408, avg=90.12, stdev=49.75
    clat (msec): min=203, max=350, avg=255.84, stdev=19.20
     lat (msec): min=299, max=611, avg=345.96, stdev=56.05		#Average write latency on delay device.
    clat percentiles (msec):
     |  1.00th=[  203],  5.00th=[  247], 10.00th=[  249], 20.00th=[  249],
     | 30.00th=[  251], 40.00th=[  251], 50.00th=[  253], 60.00th=[  253],
     | 70.00th=[  253], 80.00th=[  255], 90.00th=[  257], 95.00th=[  317],
     | 99.00th=[  351], 99.50th=[  351], 99.90th=[  351], 99.95th=[  351],
     | 99.99th=[  351]
   bw (  KiB/s): min=    6, max=   16, per=95.30%, avg=11.39, stdev= 4.09, samples=57
   iops        : min=    1, max=    4, avg= 2.58, stdev= 1.18, samples=57
  lat (msec)   : 250=26.44%, 500=73.56%
  cpu          : usr=0.00%, sys=14.85%, ctx=177, majf=0, minf=9
  IO depths    : 1=100.0%, 2=0.0%, 4=0.0%, 8=0.0%, 16=0.0%, 32=0.0%, >=64=0.0%
     submit    : 0=0.0%, 4=100.0%, 8=0.0%, 16=0.0%, 32=0.0%, 64=0.0%, >=64=0.0%
     complete  : 0=0.0%, 4=100.0%, 8=0.0%, 16=0.0%, 32=0.0%, 64=0.0%, >=64=0.0%
     issued rwts: total=0,87,0,0 short=0,0,0,0 dropped=0,0,0,0
     latency   : target=0, window=0, percentile=100.00%, depth=1

Run status group 0 (all jobs):
  WRITE: bw=11.5KiB/s (11.8kB/s), 11.5KiB/s-11.5KiB/s (11.8kB/s-11.8kB/s), io=348KiB (356kB), run=30147-30147msec
Write operation on linear type dm device
randwritelatency-test-job: (g=0): rw=randwrite, bs=(R) 4096B-4096B, (W) 4096B-4096B, (T) 4096B-4096B, ioengine=libaio, iodepth=1
fio-3.35
Starting 1 process
Jobs: 1 (f=1): [w(1)][100.0%][w=159MiB/s][w=40.7k IOPS][eta 00m:00s]
randwritelatency-test-job: (groupid=0, jobs=1): err= 0: pid=3621795: Thu Sep 25 09:13:10 2025
  write: IOPS=41.0k, BW=160MiB/s (168MB/s)(4801MiB/30001msec); 0 zone resets
    slat (usec): min=4, max=631, avg= 7.29, stdev= 1.69
    clat (nsec): min=761, max=5181.3k, avg=16335.24, stdev=13133.05
     lat (usec): min=11, max=5192, avg=23.63, stdev=13.27 		#Average write latency on linear device.
    clat percentiles (usec):
     |  1.00th=[   12],  5.00th=[   13], 10.00th=[   15], 20.00th=[   16],
     | 30.00th=[   16], 40.00th=[   16], 50.00th=[   17], 60.00th=[   17],
     | 70.00th=[   17], 80.00th=[   17], 90.00th=[   18], 95.00th=[   19],
     | 99.00th=[   26], 99.50th=[   28], 99.90th=[   34], 99.95th=[   48],
     | 99.99th=[  194]
   bw (  KiB/s): min=160496, max=166472, per=100.00%, avg=163908.61, stdev=1271.78, samples=59
   iops        : min=40124, max=41618, avg=40977.15, stdev=317.94, samples=59
  lat (nsec)   : 1000=0.04%
  lat (usec)   : 2=0.05%, 4=0.01%, 10=0.09%, 20=96.02%, 50=3.76%
  lat (usec)   : 100=0.03%, 250=0.01%, 500=0.01%, 750=0.01%, 1000=0.01%
  lat (msec)   : 2=0.01%, 4=0.01%, 10=0.01%
  cpu          : usr=20.00%, sys=46.60%, ctx=1229678, majf=0, minf=12
  IO depths    : 1=100.0%, 2=0.0%, 4=0.0%, 8=0.0%, 16=0.0%, 32=0.0%, >=64=0.0%
     submit    : 0=0.0%, 4=100.0%, 8=0.0%, 16=0.0%, 32=0.0%, 64=0.0%, >=64=0.0%
     complete  : 0=0.0%, 4=100.0%, 8=0.0%, 16=0.0%, 32=0.0%, 64=0.0%, >=64=0.0%
     issued rwts: total=0,1228984,0,0 short=0,0,0,0 dropped=0,0,0,0
     latency   : target=0, window=0, percentile=100.00%, depth=1

Run status group 0 (all jobs):
  WRITE: bw=160MiB/s (168MB/s), 160MiB/s-160MiB/s (168MB/s-168MB/s), io=4801MiB (5034MB), run=30001-30001msec
The following table summarizes the fio results, highlighting the performance differences between delay and linear devices:
| Device type | Operation | Average Delay | Bandwidth | IOPS |
|---|---|---|---|---|
| delay | read | 311.47msec | 13.1kB/s | 3 |
| linear | read | 22.26usec | 170MB/s | 43.5K |
| delay | write | 345.96msec | 11.8kB/s | 2 |
| linear | write | 23.63usec | 168MB/s | 41K |
The fio test results demonstrate the clear impact of dm-delay on I/O performance. On the delay-mapped device, average read latency increased from ~22 µs (linear device) to ~311 ms, and average write latency jumped from ~24 µs to ~346 ms. Correspondingly, IOPS dropped from tens of thousands (~43k for reads, ~41k for writes) to just 2–3, with bandwidth reduced from hundreds of MB/s to only a few KB/s.
Step 5: Cleanup
When you’re finished, remove the virtual device and loopback setup.
$ sudo dmsetup remove slow-dev
$ sudo losetup -d /dev/loop0
Induce IO timeout
Slow target causing IO timeout
In an iSCSI setup, on the target side, create a delayed device using dmsetup and configure a high delay (e.g., 30 seconds) to simulate a slow target that causes I/O timeout on initiator side.
$ dmsetup reload slow-dev --table "0 104857600 delay /dev/sdb 0 30000 /dev/sdb 0 30000"
$ dmsetup resume slow-dev
Verify the configuration:
$ dmsetup table
slow-dev: 0 104857600 delay 8:16 0 30000 8:16 0 30000
Use targetcli to export /dev/mapper/slow-dev as a LUN to the initiator.
On the initiator side, discover and log in to the iSCSI target. First, run a discovery against the target’s IP:
$ iscsiadm -m discovery -t sendtargets -p <target-ip>Then log in:
$ iscsiadm -m node -T <target-IQN> -p <target-ip> -lAfter login, the exported LUN will appear as a new block device (e.g., /dev/sdd) on the initiator.
On the initiator side, ensure the iSCSI timeout is equal to or lower than the injected delay.
$ cat /sys/block/sdd/device/timeout
30
if it’s higher, set it to the appropriate value:
$ echo 30 > /sys/block/sdd/device/timeout💡Tip: While setting up and formatting the device, use a small delay (e.g., 1 ms). Once the initiator is ready for I/O, increase the delay to 30 s.
Mount the LUN and run a test with fio:
$ mkfs.xfs /dev/sdd
$ mount /dev/sdd /mnt
$ fio --filename=/mnt/file.out --direct=1 --rw=randread --bs=4k --ioengine=libaio --iodepth=1 --numjobs=1 --time_based --group_reporting --name=randreadlatency-test-job --runtime=120 --size=1M
randreadlatency-test-job: (g=0): rw=randread, bs=(R) 4096B-4096B, (W) 4096B-4096B, (T) 4096B-4096B, ioengine=libaio, iodepth=1
fio-3.35
Starting 1 process
fio: io_u error on file /mnt/file.out: Input/output error: read offset=1024000, buflen=4096
fio: pid=444281, err=5/file:io_u.c:1889, func=io_u error, error=Input/output error
randreadlatency-test-job: (groupid=0, jobs=1): err= 5 (file:io_u.c:1889, func=io_u error, error=Input/output error): pid=444281: Thu Oct 23 07:12:02 2025
cpu : usr=0.00%, sys=0.00%, ctx=1, majf=0, minf=18
IO depths : 1=100.0%, 2=0.0%, 4=0.0%, 8=0.0%, 16=0.0%, 32=0.0%, >=64=0.0%
submit : 0=0.0%, 4=100.0%, 8=0.0%, 16=0.0%, 32=0.0%, 64=0.0%, >=64=0.0%
complete : 0=50.0%, 4=50.0%, 8=0.0%, 16=0.0%, 32=0.0%, 64=0.0%, >=64=0.0%
issued rwts: total=1,0,0,0 short=0,0,0,0 dropped=0,0,0,0
latency : target=0, window=0, percentile=100.00%, depth=1
Run status group 0 (all jobs):
Disk stats (read/write):
sdd: ios=5/0, merge=0/0, ticks=30186/0, in_queue=30186, util=16.53%This indicates that the I/O did not complete leading to a kernel-level I/O error.
Snippet from kernel logs:
Oct 23 07:09:30 shmsingh-init kernel: session2: iscsi_eh_cmd_timed_out scsi cmd 000000004fdf6c1d timedout
Oct 23 07:09:30 shmsingh-init kernel: session2: iscsi_eh_cmd_timed_out return shutdown or nh
Oct 23 07:09:30 shmsingh-init kernel: sd 3:0:0:0: [sdd] tag#110 abort scheduled
Oct 23 07:09:30 shmsingh-init kernel: sd 3:0:0:0: [sdd] tag#110 aborting command
Oct 23 07:09:30 shmsingh-init kernel: session2: iscsi_eh_abort aborting sc 000000004fdf6c1d
Oct 23 07:09:30 shmsingh-init kernel: session2: iscsi_eh_abort aborting [sc 000000004fdf6c1d itt 0x57]
Oct 23 07:09:30 shmsingh-init kernel: session2: iscsi_exec_task_mgmt_fn tmf set timeout
Oct 23 07:09:30 shmsingh-init kernel: session2: iscsi_eh_abort abort success [sc 000000004fdf6c1d itt 0x57]
Oct 23 07:09:30 shmsingh-init kernel: sd 3:0:0:0: [sdd] tag#110 retry aborted command
Oct 23 07:10:00 shmsingh-init kernel: session2: iscsi_eh_cmd_timed_out scsi cmd 000000004fdf6c1d timedout
Oct 23 07:10:00 shmsingh-init kernel: session2: iscsi_eh_cmd_timed_out return shutdown or nh
Oct 23 07:10:00 shmsingh-init kernel: sd 3:0:0:0: [sdd] tag#85 previous abort failed
Oct 23 07:10:00 shmsingh-init kernel: scsi host3: scsi_eh_3: waking up 0/1/1
Oct 23 07:10:00 shmsingh-init kernel: scsi host3: scsi_eh_prt_fail_stats: cmds failed: 0, cancel: 1
Oct 23 07:10:00 shmsingh-init kernel: scsi host3: Total of 1 commands on 1 devices require eh work
Oct 23 07:10:00 shmsingh-init kernel: sd 3:0:0:0: scsi_eh_3: Sending BDR
Oct 23 07:10:00 shmsingh-init kernel: session2: iscsi_eh_device_reset LU Reset [sc 000000004fdf6c1d lun 0]
Oct 23 07:10:00 shmsingh-init kernel: session2: iscsi_exec_task_mgmt_fn tmf set timeout
Oct 23 07:10:00 shmsingh-init kernel: session2: iscsi_eh_device_reset dev reset result = SUCCESS
Oct 23 07:10:00 shmsingh-init kernel: sd 3:0:0:0: [sdd] tag#85 scsi_eh_done result: 2
Oct 23 07:10:00 shmsingh-init kernel: sd 3:0:0:0: [sdd] tag#85 scsi_send_eh_cmnd timeleft: 9998
Oct 23 07:10:00 shmsingh-init kernel: sd 3:0:0:0: Power-on or device reset occurred
Oct 23 07:10:00 shmsingh-init kernel: sd 3:0:0:0: [sdd] tag#85 scsi_send_eh_cmnd: scsi_eh_completed_normally 2001
Oct 23 07:10:00 shmsingh-init kernel: sd 3:0:0:0: [sdd] tag#85 scsi_eh_tur return: 2001
Use Cases
Simulating latency is critical for building robust software. Here are some key use cases for dm-delay:
- Application Timeout Testing: Discover how your application behaves when database transactions or file I/O operations take longer than expected. Does it hang, crash, or handle the delay gracefully?
- Performance Comparison: Quantify how your application’s performance degrades as storage latency increases. This helps you define minimum hardware requirements and service-level objectives (SLOs).
- UI/UX Analysis: See how a user-facing application feels when underlying storage is slow. Does the user interface remain responsive, or does it freeze while waiting for I/O?
- Filesystem and Database Tuning: Test how different I/O schedulers, filesystem mount options, or database fsync policies perform under high-latency conditions.
- Validating I/O Monitoring: Ensure your monitoring and alerting systems correctly trigger when I/O latency crosses a predefined threshold.
Conclusion
dm-delay is a Linux Device Mapper target that injects configurable per-I/O delays, making it easy to reproduce slow storage conditions on otherwise fast hardware. With a simple dmsetup table, you can set different read and write delays to mimic real-world scenarios such as congested network storage or overloaded disks. This blog walks through creating a delayed virtual block device backed by a loop file, comparing performance with fio, and comparing results to a baseline device. It’s a practical, repeatable way to test timeouts, tune filesystems and databases, and validate monitoring under controlled latency. This makes dm-delay a valuable tool for developers, testers, and SREs who want to validate system resilience under controlled storage latency.