DTrace is a Linux tracing tool for troubleshooting systematic problems in real time. It enables administrators to examine the behavior of user programs and the operating system, understand how the system works, track down performance problems, and locate the causes of abnormal behavior.
If you missed the introductory video, DTrace Training Module 1 – Getting Started, or want a refresher on the history and main features of DTrace, you can find the video on the DTrace Learning Track.
DTrace Training Module 2 – Diving Deeper
The DTrace Module 2 – Going Further video explains and demonstrates practical DTrace implementation, covering DTrace variables, functions, and aggregations. The video’s examples demonstrate how these DTrace concepts and functions can be used to develop your DTrace programs.
This video is available above and on the Oracle Linux Training Station website.
Module 2 – Going Further with DTrace
This second video in the DTrace training track covers the following:
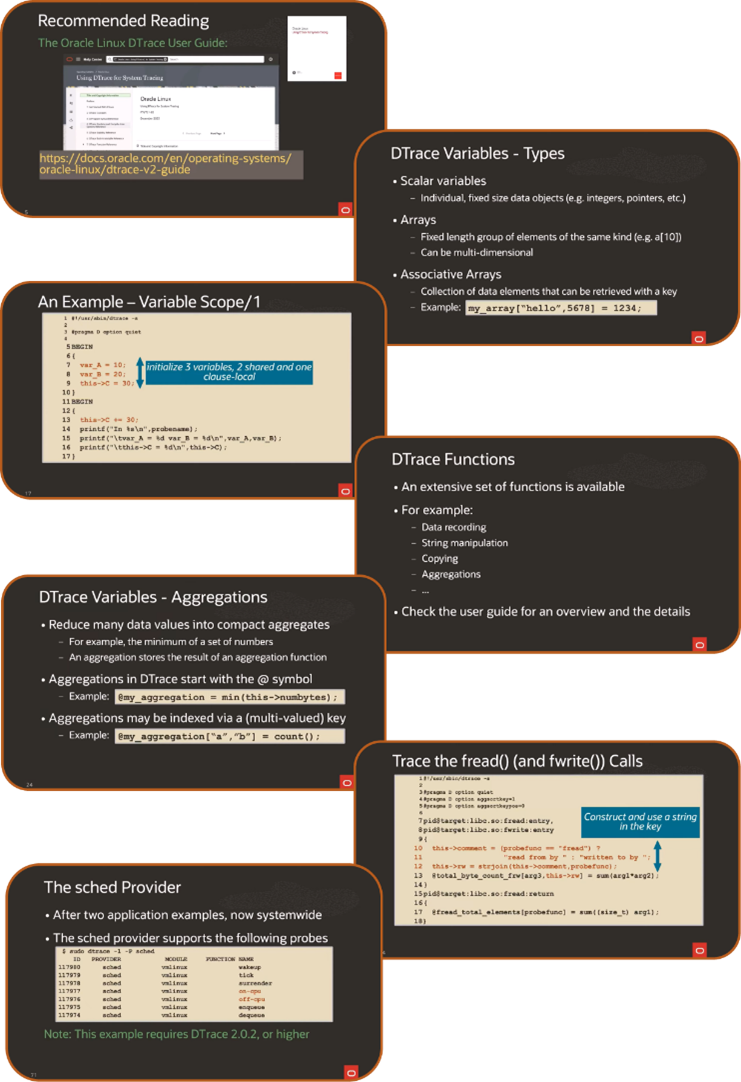
- The purpose of DTrace
- DTrace User Guide
- DTrace command options
- Pragmas
- Variables
- Variable types
- Scopes
- Global Variables
- Clause-local Variables
- Variable Scope Example
- Built-In Variables
- DTrace Functions
- Aggregations
- PID Provider
- Trace I/O Calls Example
- Tracing malloc/free Example
- The Scheduler Example
More Learning Opportunities
If you have not viewed the first video of the DTrace training track or want to keep up with the latest training, please check the DTrace learning track for more.
Resources
Learn more about DTrace and Oracle Linux by visiting the following resources.