Introduction
This article is intended to help Oracle Linux users get a basic understanding of Performance Co-Pilot (PCP) and it’s commands and architecture. PCP will be replacing the legacy tool OSWatcher as Oracle’s recommended tool for diagnosing and tuning Oracle Linux systems.
History
The key to troubleshooting and solving an issue is availability of necessary data that shows historical statistics of the host on which the issue occurred and the ability to interpret that data. There are many tools and frameworks that record and/or display this data.
Previously, Oracle Linux recommended OSWatcher to gather diagnostic data. OSWatcher is a set of wrapper scripts that run well known Linux commands periodically and collect data in text format. OSWatcher is simple to use and it is easy to analyze the data it collects. But we want a more advanced diagnostic tool that is more configurable and extensible, allows features like conditional data collection and one which stored data in a binary machine-readable format.
What is PCP?
PCP is a framework that is used to monitor system performance. It provides a collection of services, processes and utilities that facilitate collection, interrogation, retrieval and reporting of diagnostic data in the host. PCP supports both live and retrospective performance data analysis. It is easily extensible and flexible. It supports a distributed architecture if the user wants to separate monitoring from collection. PCP provides tools which help pinpoint the spikes/aberrations in system performance data. It can be readily integrated with graphical analysis tools like Grafana which further reduces the time required to view large amount of data. PCP also provides a rule based language, which we can use to define rules related to data. Using these rules we can perform user-defined actions.
Features
Collection
Performance metrics are divided into logical groups and each group is called a domain. For example, “filesystem” is a separate domain that has performance metrics such as total reads/writes to a disk, so is “process” – that has all the data related to a process like pid, ppid, wchan, process state etc. There is a larger group of metrics known as kernel or linux domain – it has metrics related to I/O statistics, cpu utilization, load average etc. There is a separate process for each domain, which is called a “Performance Metric Domain Agent or PMDA”. PMDAs are a set of daemons that are responsible to collect a particular set of Performance Metrics. Examples of PMDAs are:
- Kernel : pmdalinux – Operating System Kernel Performance Metric Domain Agent.
- Proc : collects information related to all processes, cgroup subsytem, process accounting related data.
- Infiniband : Collects Infiniband statistics. By default, it monitors the local HCAs but can also be configured to monitor remote GUIDs such as IB switches.
- Oracle : Collects metrics and statistics related to Oracle Database.
PMDAs make sure that all performance metrics in their domain are up to date. It is the PMDA that responds to queries from applications. It is possible to write new PMDAs using PMAPI.
Analysis
As mentioned earlier, PCP allows both live and retrospective analysis. There is a single API for accessing the performance data. Data is collected in a raw binary format and can be read only using PCP utilities. Almost all utilities that can be used to access live data can be used equally well with archives. There are many utilities that can be used to analyze the data and each comes with a set of unique features.
Distributed Architecture support
PCP supports a distributed architecture, in the sense that any monitoring tool can be executed remotely. It’s client-server architecture allows multiple clients to monitor the same host, or a single client to monitor multiple hosts (example, in a cluster, for centralized monitoring).
- This makes it easy for the administrator to monitor multiple hosts together.
- It saves space and processor cycles on hosts where data is not getting periodically queried and archived.
The data transfer between monitor and collector (the real system under test) is endian safe. So, the monitor host can be of any architecture and/or operating system. The PMDAs however, should be running on the system for which the metrics are being collected (there are exceptions to this as well, there are some PMDAs that do run remotely to collect data from a remote system).
Coverage of information
PCP collects about 2500+ metrics with its default installation. It collects everything that is exported by /proc and /sys. In addition to this, there are over 100 additional plugins available for KVM environments, container runtimes, Oracle databases etc., which when installed, bring their own set of metrics.
Tools
PCP provides a group of commands and tools for measuring system performance. Each tool is described completely by its own man page. Some tools are compatible with legacy tools like mpstat, pidstat, vmstat, iostat etc., while some are used to convert the raw PCP data into text, .csv or .json format for further analysis.
Concepts
Now that we have discussed the features of PCP in detail, lets look into some concepts that are useful for understanding the architecture of PCP.
Performance Metrics Collector Daemon (PMCD)
The pmcd process (the Performance Metrics Collector Daemon) is responsible for gathering performance metrics relating to the systems on which it is run. In simple terms, PMCD is like a router that routes the reqeusts from consumer applications to the corresponding PMDA and routes back the response from PMDA back to the requesting application.
In order to collect any performance related data on a host, there must be a PMCD running on it.
Performance Metrics API (PMAPI)
The PMAPI is a set of functions and data structure definitions that allow client applications to access performance data from one or more Performance Metric Collection Daemons (PMCDs) or from PCP archive logs. The PCP utilities are all written based on the PMAPI.
Performance Metric Namespace (PMNS)
Each metric is referred to by its name in the user application and is associated with an ID (PMID), underlying layers use the PMID to access the metric. PMID consists of three fields : domain, cluster and item, all three are numbers. Each metric belonging to a single PMDA will have the same domain number. Cluster number corresponds to a sub-component of domain (e.g, memory, io, networking, which are different clusters associated with linux/kernel domain). Item number is different for different metrics within a cluster. The above three fields create a unique PMID for every performance metric.
Metadata:
Metadata is used to describe the metric’s semantic (counter, instantaneous, discrete), data type (integer, float etc.) and unit (time, count, space dimensions, Kb, Mb etc). It also has helptext information related to the metric. Generic monitoring tools can use this meta-data to do appropriate scaling, formatting and rate conversion of metric data, which mostly eliminates the need for custom monitoring applications.
Performance Metric Instances:
When performance metric values are returned to a requesting application, there may be more than one value instance for a particular metric; for example, independent counts for each CPU, process, disk, or local filesystem. Internal instance identifiers correspond one to one with external (human-readable) descriptions of the members of an instance domain.
For example
# pminfo -f filesys.free

filesys.free
    inst [0 or "/dev/mapper/ocivolume-root"] value 28349944
    inst [1 or "/dev/mapper/ocivolume-oled"] value 10353928
    inst [2 or "/dev/sda2"] value 752244
    inst [3 or "/dev/sda1"] value 97022
As can be seen above, filesys.free is a performance metric that has 4 values which are associated with 4 instances having instance identifiers 0,1,2,3 and external identifiers:
/dev/mapper/ocivolume-root
/dev/mapper/ocivolume-oled
/dev/sda2
/dev/sda1
Each performance metric is associated with an instance domain, while each instance domain can be associated with more than one performance metric.
pmlogger:
pmlogger creates the archive logs of performance metric values that may be played back by other Performance Co-Pilot tools. These logs form the basis of retrospective analysis of performance metrics. One of the key features of pmlogger is its configurability. Users can configure the frequency of collection of values for each individual metric (or a logical group of metrics). The pmlogger config file is under the directory /var/lib/pcp/config/pmlogger. Users can also configure the log retention duration by making changes to /etc/sysconfig/pmlogger_timers.
Architecture
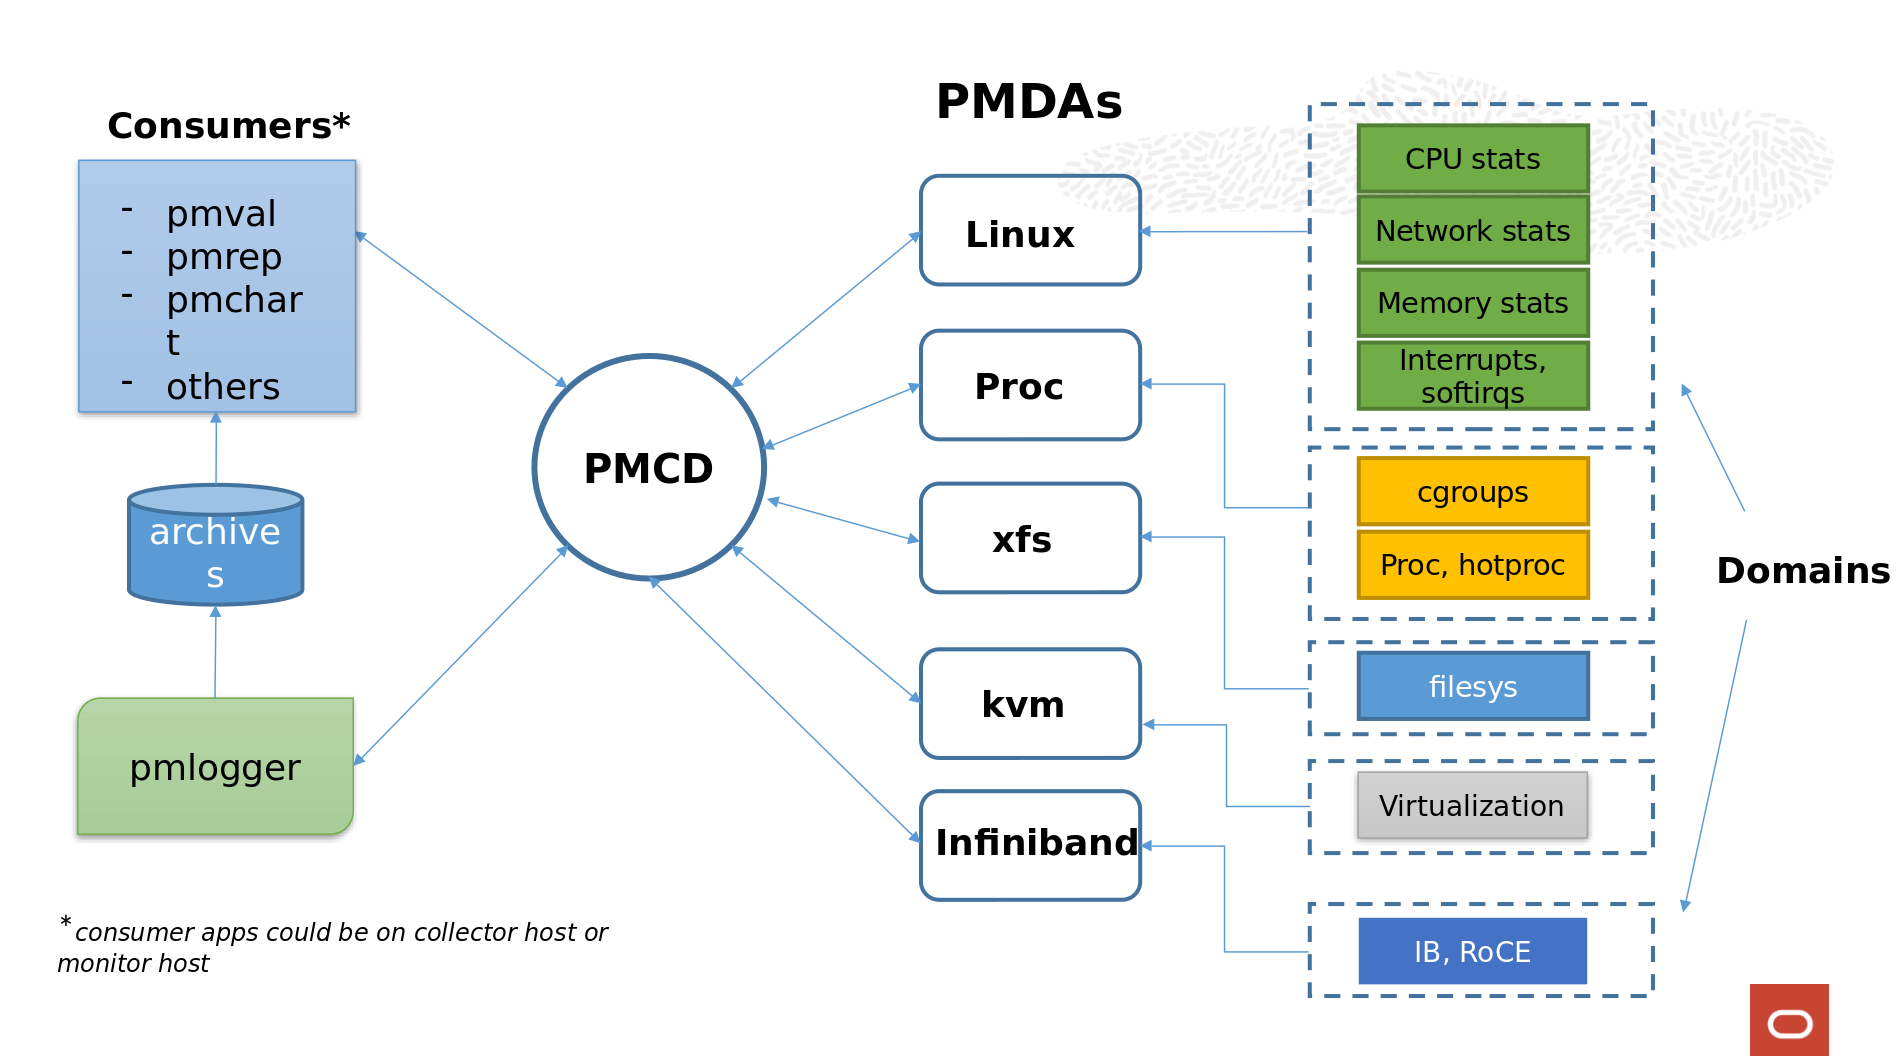
PCP consists of several monitoring and collecting tools. Monitoring tools such as pmval and pminfo report on metrics, but have minimal interaction with target systems. PMDAs extract values of metrics from target systems, but do not provide user interfaces.
As mentioned earlier, systems supporting PCP services are broadly classified into two categories:
- Collector: Hosts that have the PMCD and one or more PMDAs running to collect and export performance metrics
- Monitor: Hosts that import performance metrics from one or more collector hosts to be consumed by tools to monitor, manage, or record the performance of the collector hosts
Each PCP enabled host can operate as a collector, or a monitor, or both.
The PCP architecture can be broadly divided into two halves or layers.
- Above the PMAPI.
- Below the PMAPI.
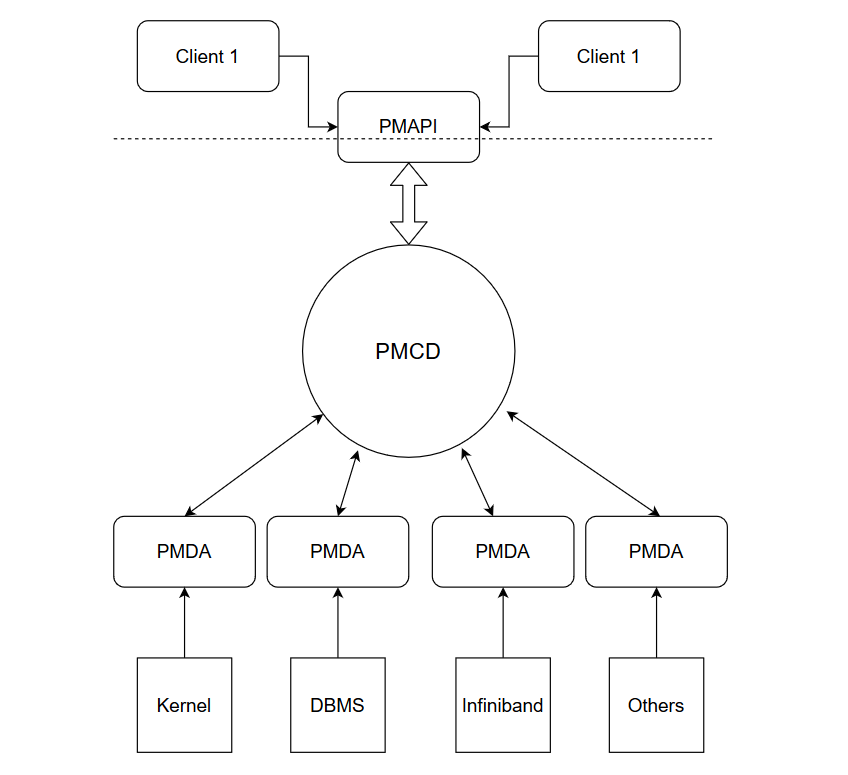
As can be seen from the above figure, the monitor applications or clients access the PMCD using PMAPIs. PMCD routes the requests from different clients to the correspoding PMDAs. The PMDAs, in turn gather the performance metrics from underlying subsystems, noted as kernel, DBMS, Infiniband etc.
Installation
To install the default non-config version of PCP, run
# yum install pcp-zeroconf
pcp-zeroconf, as the name suggests, does not require users to do any configuration. It sets parameters like collection frequency, log retention policy etc to default values.
We at Oracle have tailored the collection frequency, log retention to our need and have added some meaningful pmrep aliases and have created a new rpm. To install the Oracle conf rpm of PCP, run
# yum install pcp-oracle-conf
What do customers have to share?
The logs generated and archived by pmlogger are stored under /var/log/pcp/pmlogger/<hostname> directory. There will primarily be three types of files in this directory:
# ls
20220413.0.xz 20220413.index 20220413.meta.xz
Customers must tar up all the files covering the duration/date of issue (each log file will cover around 24 hours duration) from this location with Oracle to help troubleshoot the issues they are facing. PCP has the ability to trigger some additional debug data collection. This is done with the help of Performance Monitor Inference Engine (PMIE), we will discuss this later in the article. If PMIE has triggered some additional data collection, it is critical to share that data as well.
Important tools and commands
“Data is like garbage. You’d better know what you are going to do with it, before you collect it. – Mark Twain”.
PCP gives us a lot of data, and it also gives us the necessary tools to retrieve, interrogate and report the data. These tools convert the data into human readable format and sometimes gives the user some features which are beyond just readability.
Let’s look into the commands that are useful.
pmdumplog
Check timezone and time period of archive file.
# pmdumplog -L 20220125.0.xz
Log Label (Log Format Version 2)
Performance metrics from host
    commencing Tue Jan 25 06:26:41.834975 2022
    ending     Tue Jan 25 16:10:06.482287 2022
Archive timezone: GMT
PID for pmlogger: 30096
pminfo
Display information about performance metrics.
pminfo -t : Displays all enabled performance metrics on a host with a short description. There are 2K+ probes available.
pminfo -t -a <archive>: Displays enabled performance metrics in an archive log obtained on a host with a short description.
pminfo -dfmtT <performance metric> : Displays detailed information about the specified metric like semantic, type, unit and instances etc.
pmval
Arbitrary performance metrics value dumper.
pmval prints current or archived values for the nominated performance metric. The metric of interest is named in the argument.
pmval -t <interval> <metricname>: Display the value of performance metric after every specified interval.
pmval -s <number of samples> <metricname> : Display only specified number of samples of value of the performance metric.
-a option can be used to specify an archive file to read data from.
pmval cannot display more than one metric at once.
pmrep
Performance metrics reporter.
Similar to pmval, but pmrep can display more than one metric at a time. With pmrep we have additional options of giving a scale for values of performance metrics, printing timestamps, collectively displaying multiple performance metrics, etc.
# pmrep -t 1h kernel.all.load kernel.cpu.util.sys -a 20220125.0.xz
  k.a.load  k.a.load  k.a.load  k.c.u.sys
  1 minute  5 minute  15 minut
     6.530     6.040     5.370        N/A
     0.000     0.000     0.770      7.690
     6.250     6.130     4.470      5.124
     0.020     0.310     1.910     10.149
Add timestamps using the -p option:
# pmrep -t 1h kernel.all.load kernel.cpu.util.sys -a 20220125.0.xz -p
  k.a.load  k.a.load  k.a.load  k.c.u.sys
  1 minute  5 minute  15 minut

07:26:41     6.530     6.040     5.370        N/A
08:26:41     0.000     0.000     0.770      7.690
09:26:41     6.250     6.130     4.470      5.124
10:26:41     0.020     0.310     1.910     10.149
User can also convert the output into a csv format using pmrep.
# pmrep -t 1h kernel.all.load kernel.cpu.util.sys -a 20220125.0.xz **-o csv**
Time,"kernel.all.load-1 minute","kernel.all.load-5 minute","kernel.all.load-15 minute","kernel.cpu.util.sys"
2022-01-25 06:26:41,,,,
2022-01-25 07:26:41,6.530,6.040,5.370,
2022-01-25 08:26:41,0.000,0.000,0.770,7.690
2022-01-25 09:26:41,6.250,6.130,4.470,5.124
2022-01-25 10:26:41,0.020,0.310,1.910,10.149
2022-01-25 11:26:41,0.000,0.000,0.030,0.380
Users can also create their own aliases to indicate a set of performance metrics and use them with the pmrep command to analyze the data: Below code-block shows the examples of aliases available, obtained by pressing tab after “pmrep :”
# pmrep :<tab>
buddyinfo          meminfo-6            netstat-udplite                pidstat              sar                  sar-n-TCP-ETCP       top-pid
collectl-dm-sD     meminfo-7            netstat-udplite6               proc-children        sar-b                sar-q                top-sys
collectl-sc        mpstat               network-interface-settings     proc-cpu             sar-B                sar-r                top-test
collectl-sd        mpstat-I-SUM         network-interface-stats-in     proc-cpu-ext         sar-B-old-kernel     sar-S                udp-activity
collectl-sD        mpstat-P-ALL         network-interface-stats-out    proc-essential       sar-d-dev            sar-u-ALL            vmstat
collectl-sm        netstat-icmp6-in     network-interface-stats-total  proc-info            sar-d-dm             sar-u-ALL-P-ALL      vmstat-a
collectl-sn        netstat-icmp6-out    numa-hint-faults               proc-info-ext        sar-F                sar-w                vmstat-w
iostat-dktx        netstat-icmp-rx      numa-per-node-cpu              proc-io              sar-H                sar-W                zoneinfo-1
iostat_v10-dktx    netstat-icmp-tx      numa-pgmigrate-per-node        proc-io-ext          sar-I-SUM            sar-y                zoneinfo-2
meminfo-1          netstat-ip6-in       numastat-1                     proc-mem             sar-n-DEV            slabinfo             zoneinfo-3
meminfo-2          netstat-ip6-out      numastat-2                     proc-mem-ext         sar-n-EDEV           sockstat
meminfo-3          netstat-ip-gen       numastat-3                     proc-net             sar-n-NFSDv4         tcp-activity
meminfo-4          netstat-ip-rx        numastat-4                     proc-os-stats        sar-n-NFSv4          top-mem
meminfo-5          netstat-ip-tx        numastat-n                     ps                   sar-n-SOCK
For example, an alias tcp-activity shows the metrics incoming/outgoing, retransmitted and incoming error segments:
# pmrep :tcp-activity -a 20211025.0.xz -s 3
  insegs outsegs retranssegs inerrs
  count/ count/s     count/s count/
00:10:41   1.00    1.00        0.00   0.00
00:10:42   1.00    1.00        0.00   0.00
00:10:43   1.00    1.00        0.00   0.00
pmrep aliases can be added to the configuration file /etc/pcp/pmrep/pmrep.conf As a matter of fact, the pcp tools compatible with legacy tools vmstat, iostat etc are some versions of pmrep aliases.
pmdumptext
This tool dumps performance metrics in text format, it is very similar to pmrep, but does not have the capability to convert data into csv format or provide aliases. It is provided by rpm pcp-gui.
# pmdumptext -Xlimu -t 10m -S @13:00 -T @14:00 'kernel.all.load[1]' 'mem.util.used' 'disk.partitions.write' -a 20220203.0.xz
[ 1] 20220203.0.xz/kernel.all.load["1 minute"]
[ 2] 20220203.0.xz/mem.util.used
[ 3] 20220203.0.xz/disk.partitions.write["sda1"]
[ 4] 20220203.0.xz/disk.partitions.write["sda2"]
[ 5] 20220203.0.xz/disk.partitions.write["sda3"]

             Column       1       2       3       4       5
             Source    host    host    host    host    host
             Metric    load    used   write   write   write
               Inst  1 minu     n/a    sda1    sda2    sda3
              Units    none       b     c/s     c/s     c/s
Thu Feb  3 13:00:00    0.03   0.57G       ?       ?       ?
Thu Feb  3 13:10:00    0.00   0.58G    0.00    0.00    1.20
Thu Feb  3 13:20:00    0.00   0.59G    0.00    0.00    0.94
pmlogsummary
Calculate average values of performance metrics in an archive between 1 PM / 2 PM using table like formatting including the time of minimum/maximum value and the actual minimum/maximum value
# pmlogsummary -HlfiImM -S @13:00 -T @14:00 20220125.0.xz kernel.all.load
Log Label (Log Format Version 2)
Performance metrics from host
  commencing Tue Jan 25 13:00:00.000 2022
  ending     Tue Jan 25 14:00:00.000 2022
metric                         time_average  minimum  minimum_time  maximum  maximum_time  units
kernel.all.load ["1 minute"]   0.027         0.000    13:00:01.869  0.880    13:25:56.867  none
kernel.all.load ["5 minute"]   0.022         0.000    13:00:01.869  0.180    13:25:56.867  none
kernel.all.load ["15 minute"]  0.008         0.000    13:00:01.869  0.060    13:25:56.867  none
pmstat
Dump past system metrics in a sar/vmstat like fashion averaged over 1h (60 minute) interval in an archive between 7 AM and 9 AM
# pmstat -t 1h -S @07:00 -T @09:00  -a 20220125.0.xz
@ Tue Jan 25 07:00:00 2022
 loadavg                      memory      swap        io    system         cpu
   1 min   swpd   free   buff  cache   pi   po   bi   bo   in   cs  us  sy  id
    0.07 355616 431144      0 103476 1258 1250  13K  10K  759  696   6  86   8
    0.00 347936 364476      0 151508    0    0   37   66   99  157   0   3  97
    0.86 339484 473360      0  63920 1160 1153  12K 9359  693  652   5  78  17
pmdiff
pmdiff compares the average values for every metric in either one or two sets of archives, in a given time window, for changes that are likely to be of interest when searching for performance regressions.
# pmdiff --skip-excluded --skip-missing -S @17:10 -T @18:10 -B @19:10 -E @20:10 20220126.00.10.0.xz | less
Directory: /var/log/pcp/pmlogger/ca-dev124.us.oracle.com

Ratio Threshold: >= 2.00 or <= 0.500
20220126.00.10.0.xz 20220126.00.10.0.xz   Ratio  Metric-Instance
  @17:10-@18:10   @19:10-@20:10
  0.000      498322        |+|   *proc.io.read_bytes [851]
  0.000     5154813        |+|   *proc.io.read_bytes [966]
  0.000         787.2      |+|   *proc.io.write_bytes [851]
  0.000       10228        |+|   *proc.io.write_bytes [966]
  0.000          85.14     |+|   *proc.psinfo.minflt [851]
  0.000         304.6      |+|   *proc.psinfo.minflt [966]
  0.000           1.402    |+|   disk.all.read_rawactive
By default pmdiff compares the changes in values with a threshold ratio of >=2.00 or <=0.500, which means it displays the metrics that have at least increased by double or reduced by half. This threashold can be changed using the -q option.
Users can search for interesting performance metrics from pmdiff to see how much have they changed between the two time periods (or two archives, if specified likewise) using a simple grep command.
# pmdiff --skip-excluded --skip-missing -S @17:10 -T @18:10 -B @19:10 -E @20:10 20220126.00.10.0.xz | grep -E "kernel.all.load"
  0.012           6.341   >100   kernel.all.load ["1 minute"]
  0.001           6.215   >100   kernel.all.load ["15 minute"]
  0.006           6.343   >100   kernel.all.load ["5 minute"]
Performance Metric Inference Engine (PMIE)
One of the most interesting and important features of PCP is the PMIE. PCP provides a rule based language that can perform user defined actions if rule predictions are found to be true. This evaluation of rules is done by PMIE. It accepts a set of arithmetic, logical and/or rule expressions at specified frequencies and can execute user defined actions in response to the specified conditions. The actions could be as simple as logging a message in syslog or pop up alarms to launch a program.
User can trigger additional debug data collection using a PMIE rule.
# cat perf_rule
// 1 cpu.load_average
delta = 10 second;
    ruleset
        kernel.all.load #'1 minute' > 2 * hinv.ncpu ->
            print "extreme load average %v" &
                shell 5 minutes "perf record -F99 -o /tmp/perf_record.data sleep 10"
    else kernel.all.load #'1 minute' > 1 * hinv.ncpu ->
            print "moderate load average %v"
    unknown ->
            print "load average unavailable"
    otherwise ->
            print "load average OK"
    ;

# pmie -c perf_rule
Mon Feb  7 11:58:33 2022: load average OK
Mon Feb  7 11:58:43 2022: load average OK
Mon Feb  7 11:58:53 2022: moderate load average 2.3
Mon Feb  7 11:59:03 2022: extreme load average 6.3

*runs perf record in background for 10 seconds and saves file /tmp/perf_record.data*
As can be seen above, after detecting high load average for 10 seconds, perf record was triggered to gather additional debug information. Without PCP, this data collection would have required a reproducible environment, which is not always possible to have.
It is recommended to run PMIE rules as a root user. However, a non-root user can run PMIE rules too, but cannot execute actions that only the root user can execute.
Conclusion
This blog provides an introduction to PCP, along with information about its architecture and usage on Oracle Linux. With its extensibility and flexibility, PCP becomes the ideal tool for performance data collection.