The new DTrace training video, DTrace Training Module 4 – Multithreading Part 2, expands the DTrace training series with additional insights for working with multithreaded applications and continues from DTrace Training Module 3 – Multithreading Part 1.

DTrace is a comprehensive dynamic tracing tool for real-time diagnostics and performance analysis of operating systems and applications. It enables you to examine the behavior of user programs and the OS to understand how the system works, track down performance problems, and identify the causes of aberrant behavior.
DTrace and Multithreading Part 2
This latest training video provides a comprehensive look at DTrace examples using multithreading. You will learn how to:
- Use the sched and pid providers
- Determine the CPU IDs used by the threads
- Record and count the function calls made by each thread in an application
- Identify other ways to analyze multithreaded program behaviors
Access the training video here:
DTrace Training Module 4 – Multithreading Part 2
Comprehensive Oracle Linux DTrace Training Playlist
To improve your access to these learning resources, we’ve created a dedicated YouTube playlist with all Oracle Linux DTrace training videos. This playlist makes it easy to navigate the series, revisit important concepts, or catch up on any topics you might have missed.
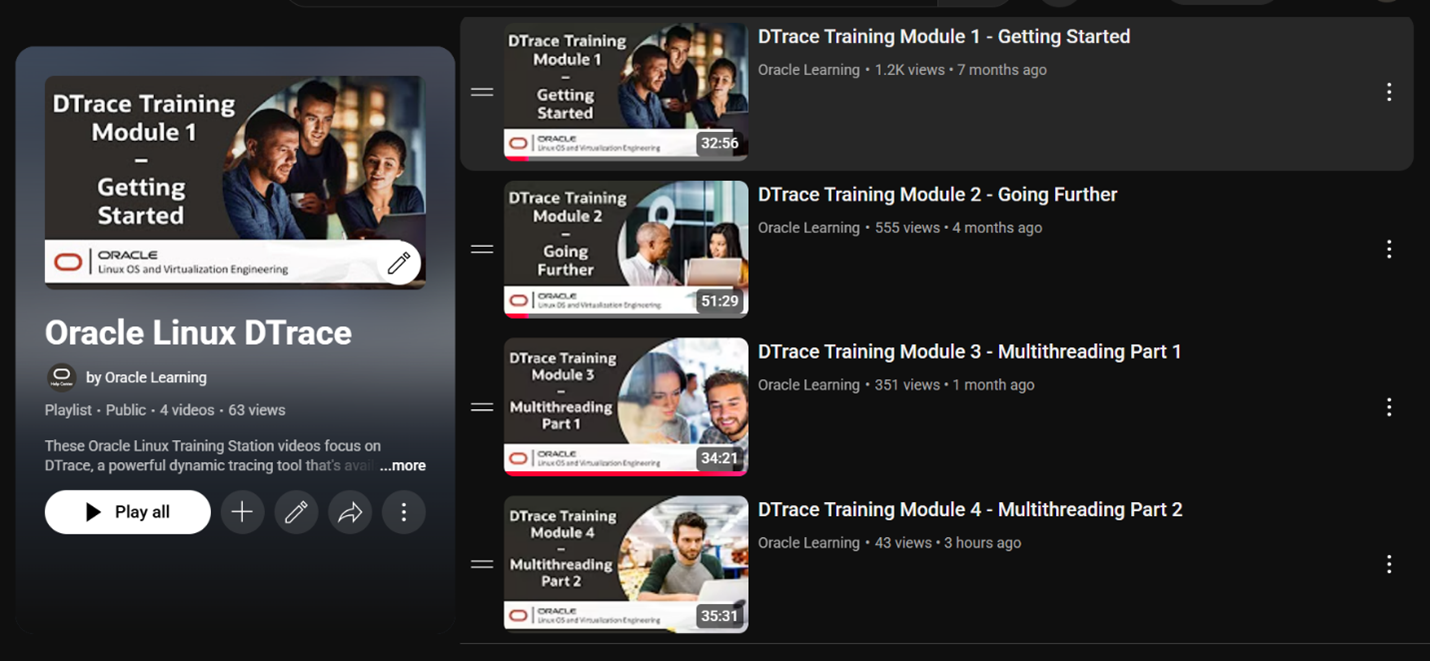
View the Oracle Linux DTrace training playlist here:
Oracle Linux DTrace Training Playlist
Stay tuned for additional videos as we continue to explore DTrace fundamentals and practical applications of DTrace programs.
Resources
Learn more about DTrace and Oracle Linux by visiting the following resources.