As part of our ongoing RAB blog series, this post focuses on the design-time debugging capabilities for adapters built using the Rapid Adapter Builder (RAB).
In today’s dynamic development landscape, the ability to quickly identify and resolve issues is crucial for maintaining productivity and efficiency. With this in mind, design-time debugging has been introduced as a self-service feature, enabling RAB developers to address their debugging needs independently. This feature allows developers to examine the behavior of their adapter configurations before deployment, catching potential issues early and ensuring more reliable integrations.
In this blog, we provide a step-by-step guide to leverage this powerful debugging capability.
What is Design-Time Debugging?
Design-time debugging is a process that allows developers to troubleshoot and fix issues in their code (ADD) during the design phase.
In the context of RAB adapters, this feature helps RAB developers to identify issues caused by JQ expressions and provides insights into the data on which the expressions are applied.
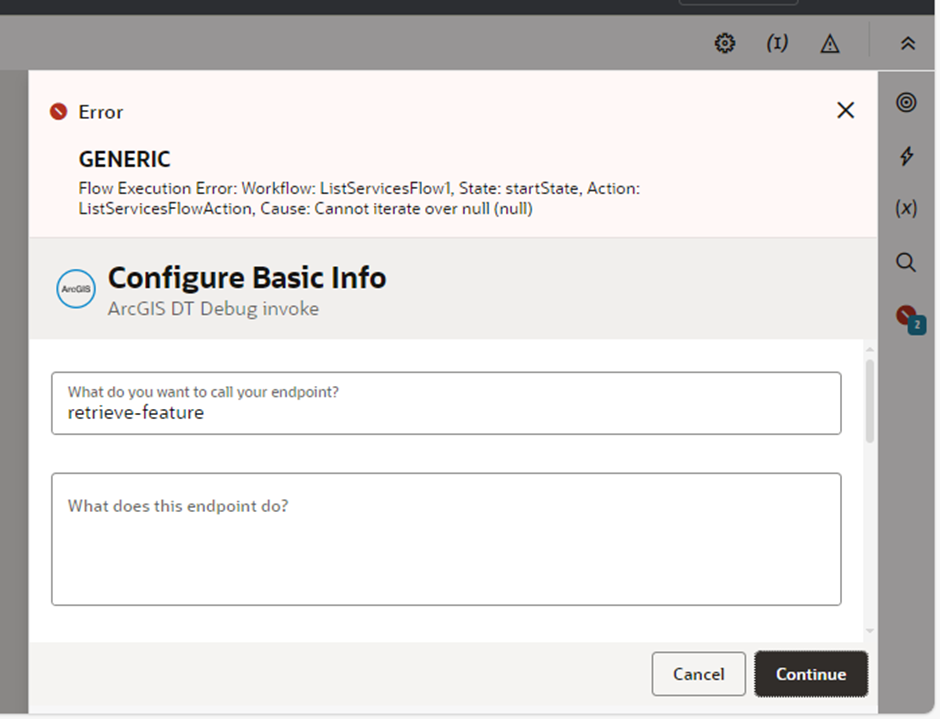
Assume you receive the following error while configuring the Adapter Endpoint Configuration Wizard for the adapter that you have developed.
Example Error: Cannot iterate over null (null)
How to Debug: Setting Up Design-Time Debugging
You can find the root cause of the above issue by performing design time debugging. Let’s understand how to debug.
Prerequisites
Before you begin debugging, follow these steps:
-
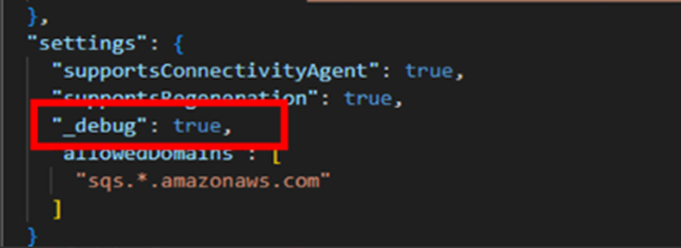
Go to the settings section of your ADD and add the
_debugflag. Set this flag totrue. This is the same flag used for runtime debugging, providing continuity across both development and production environments.
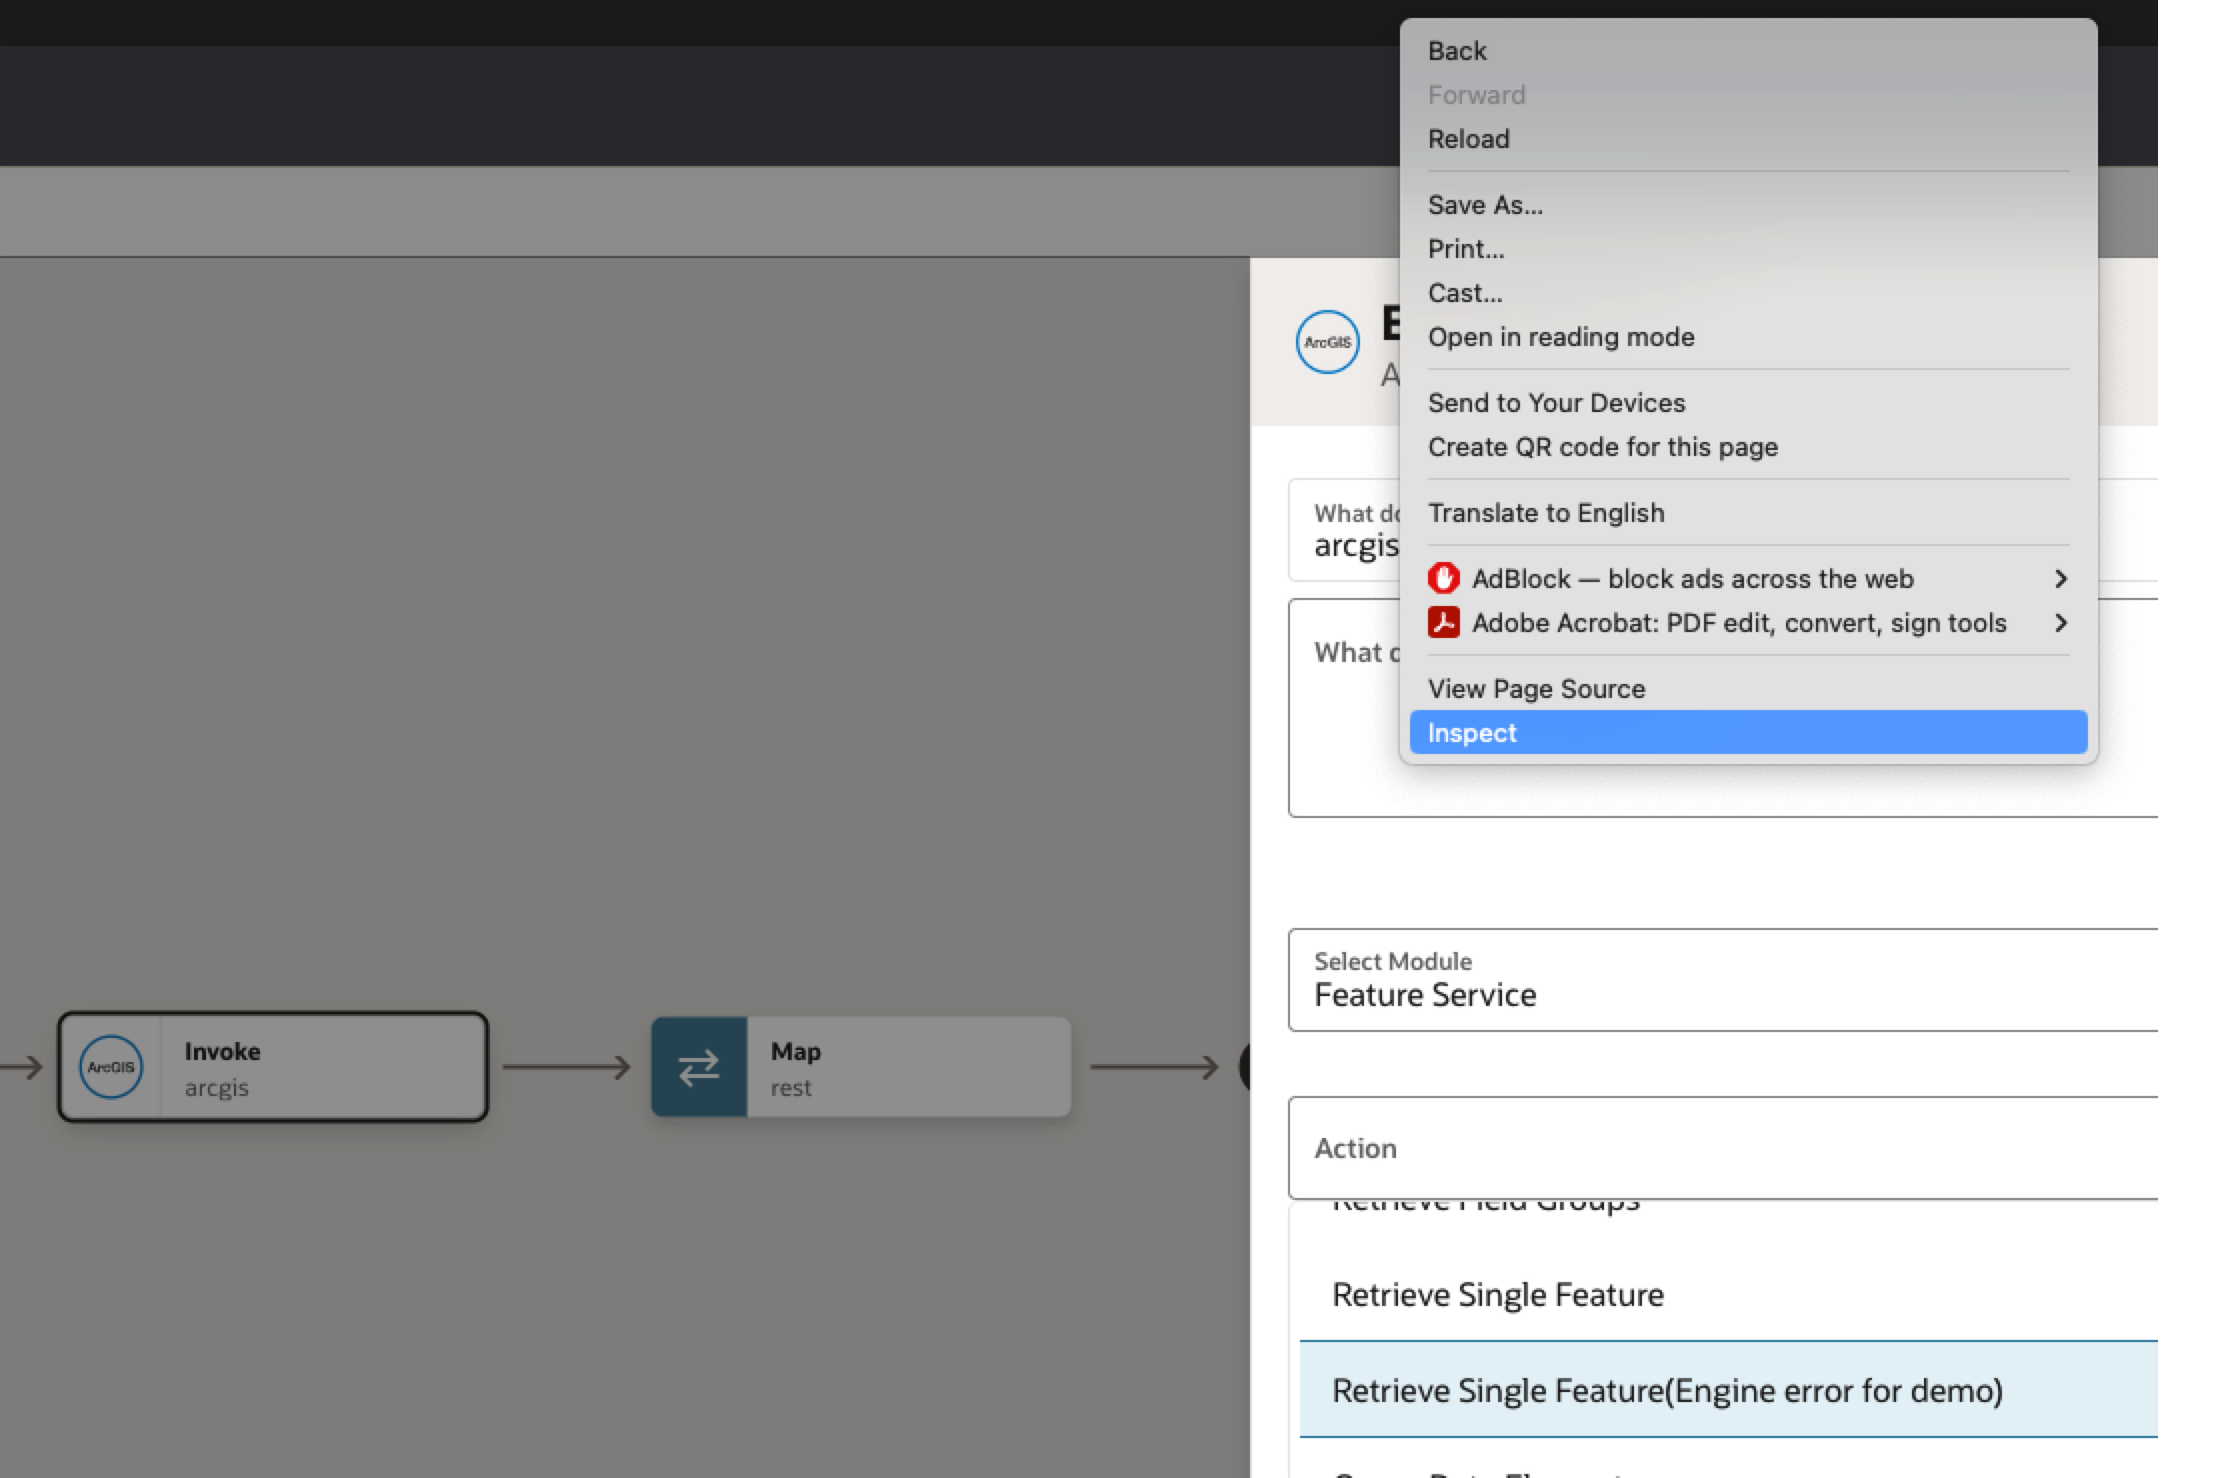
- After registering the adapter and configuring the Adapter Endpoint Configuration Wizard, open the developer tools in your browser by right-clicking, selecting the Inspect button, and navigating to the Network tab. When an error occurs in the wizard, you can view the logs for the accessed page in the Preview section.
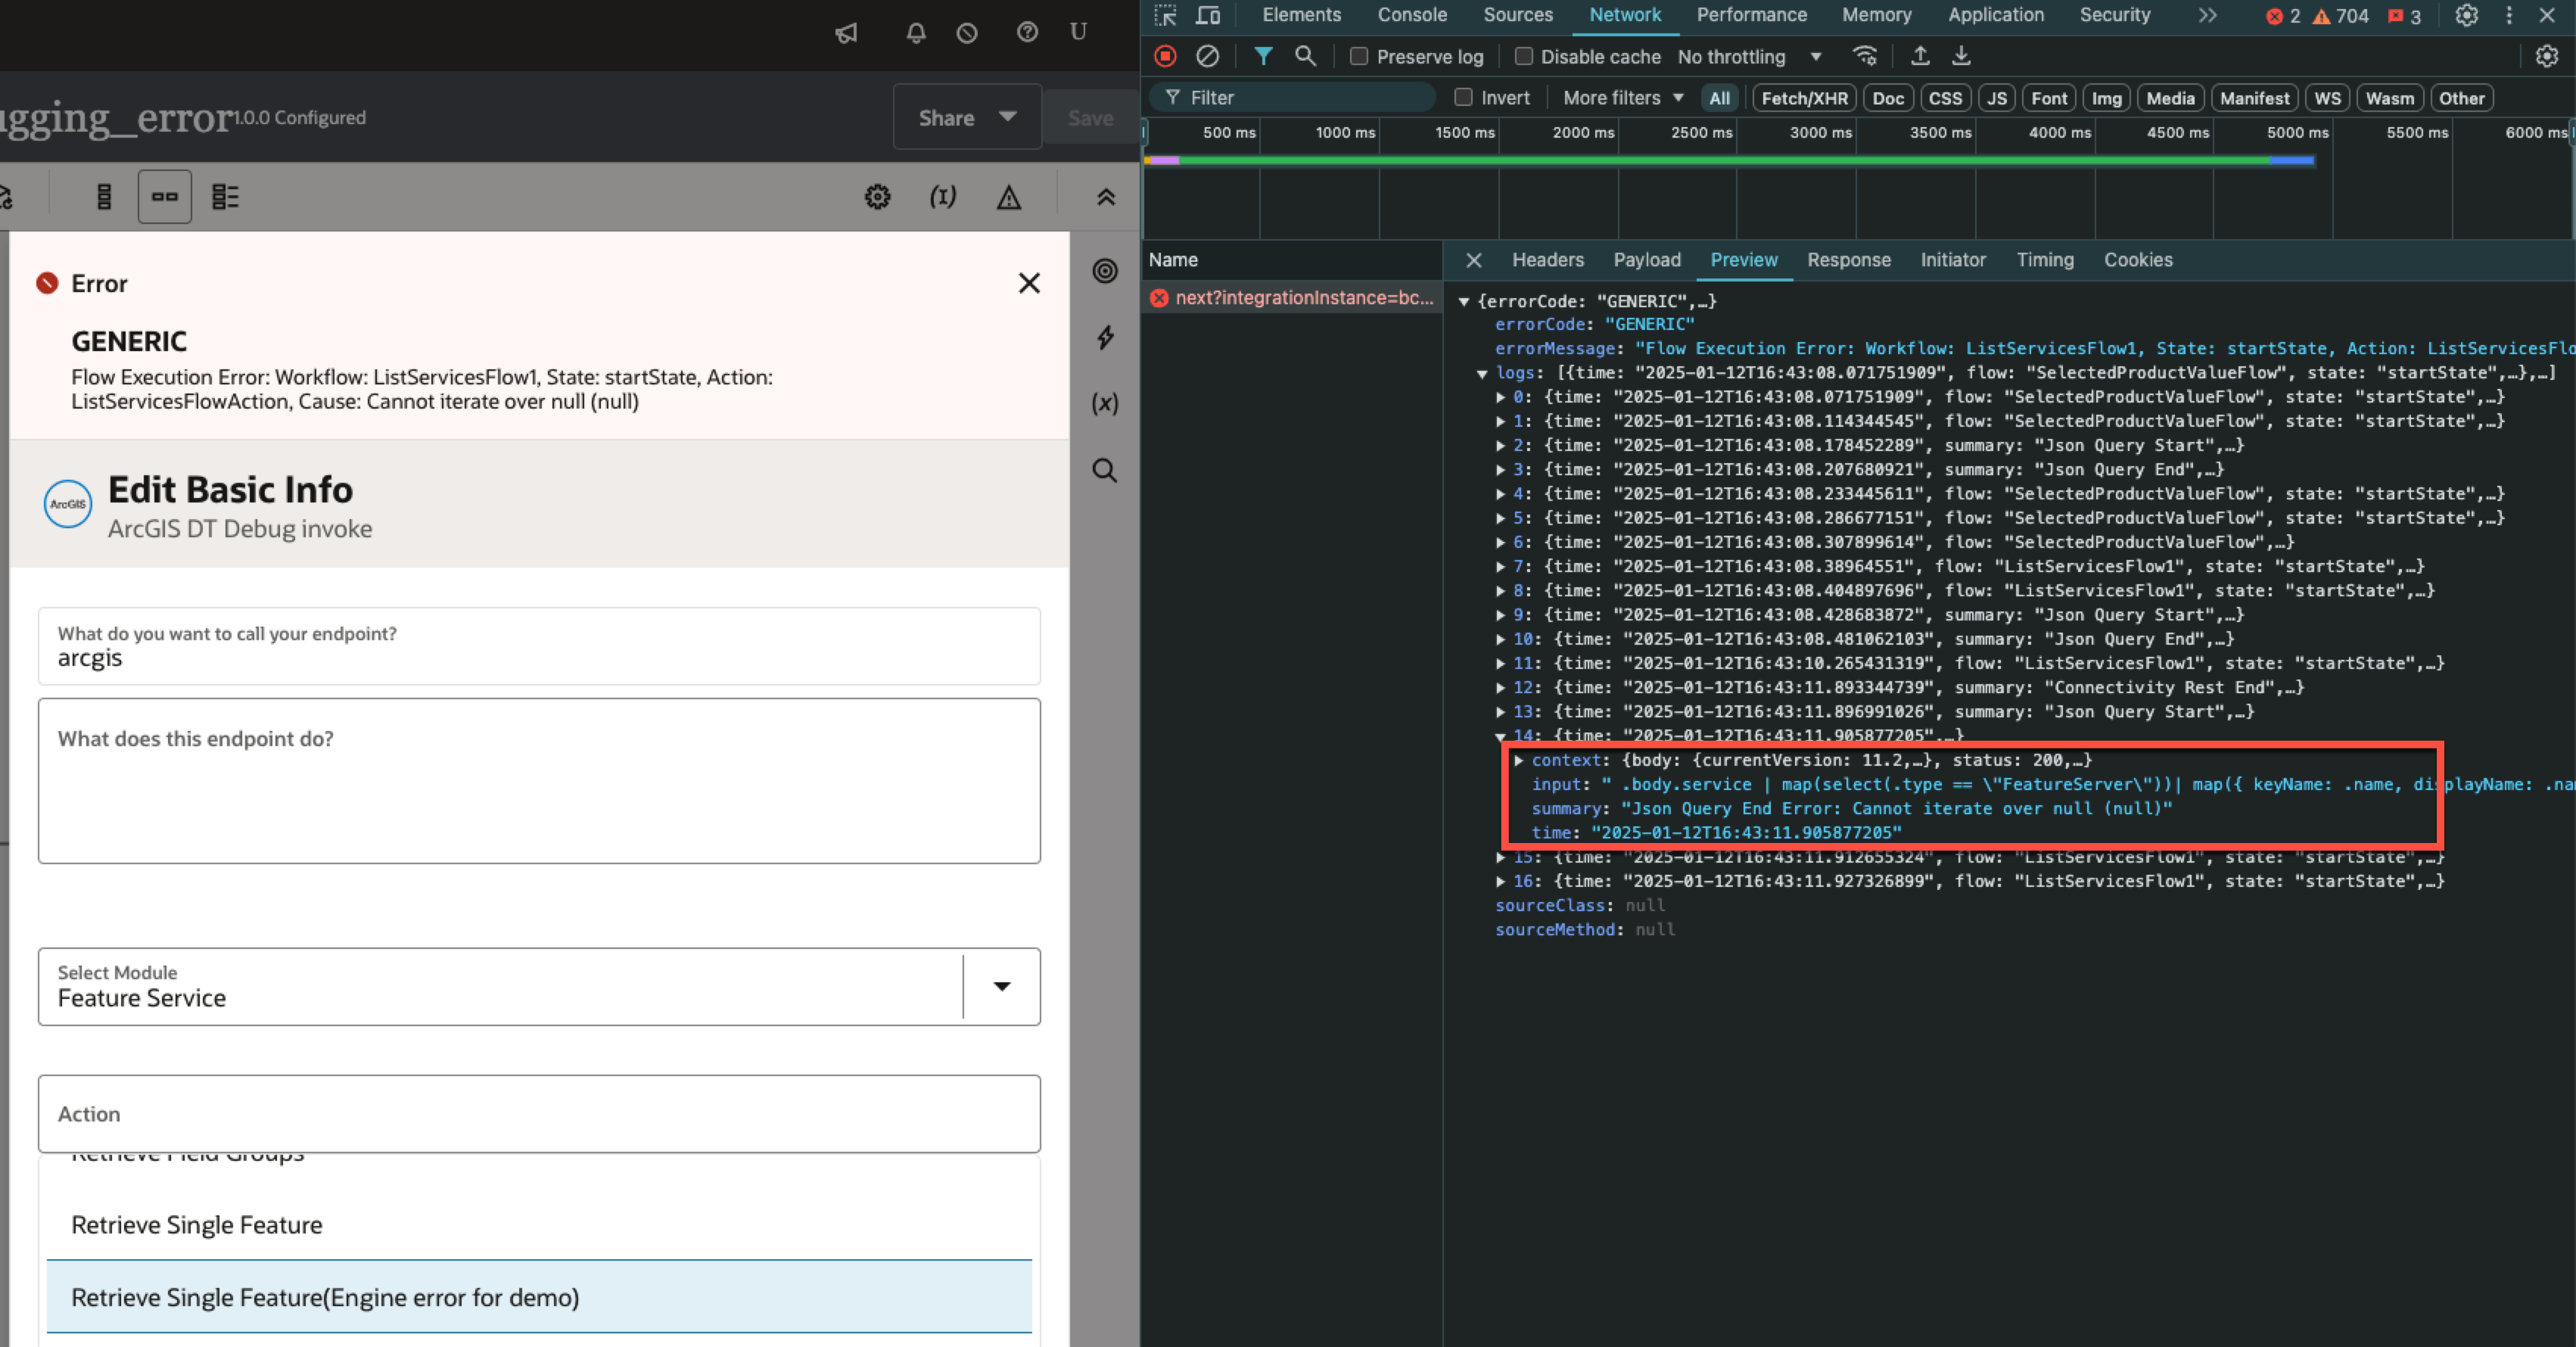
- Navigate to the section where the error is displayed, as highlighted in the screenshot. The issue lies in the JQ expression specified during adapter development using ADD. Let’s explore how to resolve the issue in the JQ expression.
- Copy the JQ expression from the logs below, along with the input being sent for execution.
How to Resolve the JQ Expression Error
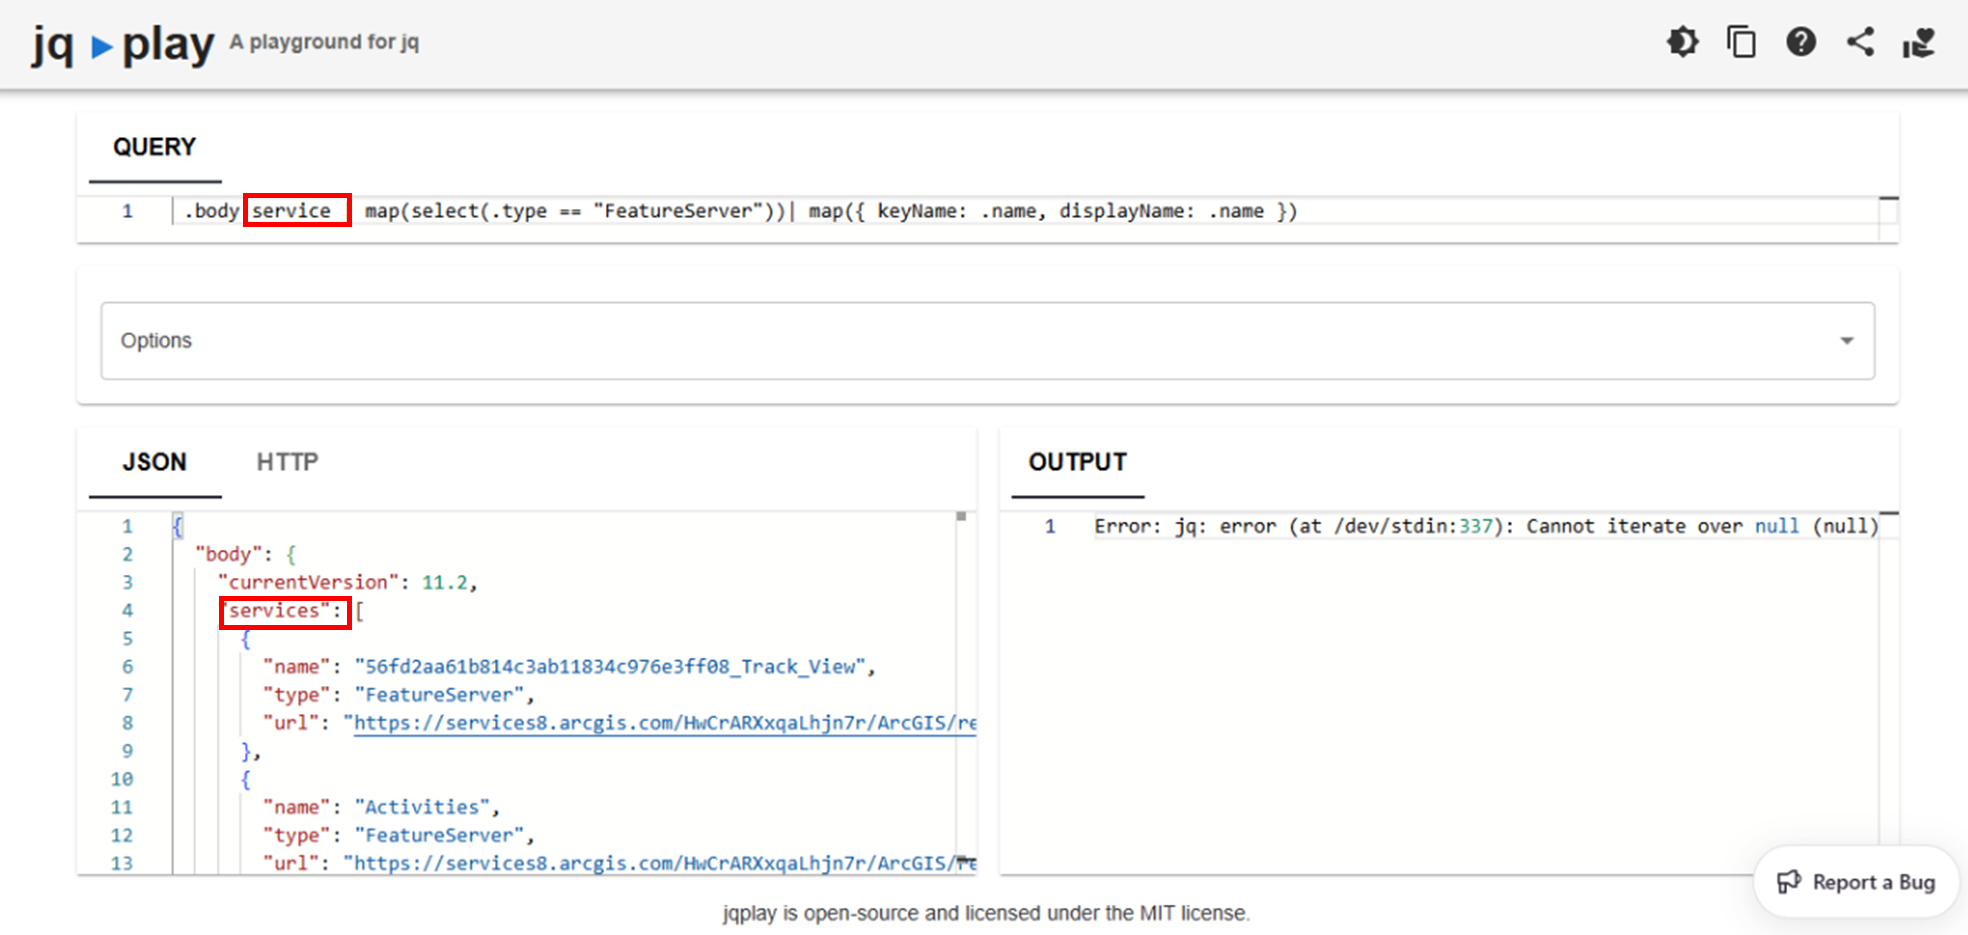
To debug the issue, use the JQ Playground. Enter the query, along with the input data you extracted from the above screen. Adjust the query to address the error, correct the JQ expression, and then update it in your ADD before re-registering your adapter.
For instance, in this example, the JSON query expression is attempting to access a key named service, while the actual key in the data is services.
To fix this, update the JSON query expression to reference services instead of service.
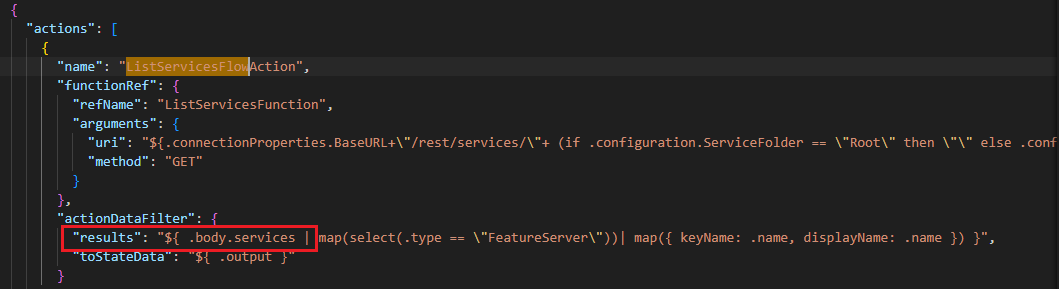
- Implement the necessary correction in the ADD.
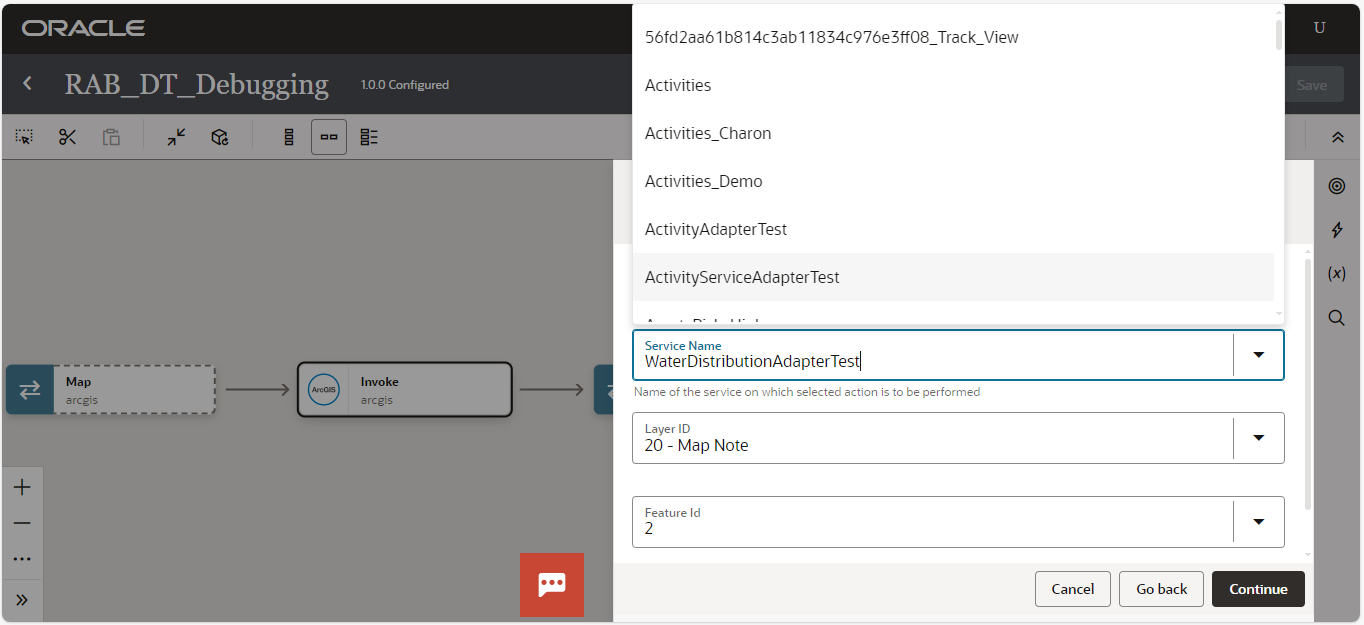
- Reconfigure the integration wizard pages to ensure that the data displays correctly, with all service names and values available as expected.
Conclusion
The design-time debugging feature for RAB adapters is an invaluable feature for validating data flows and ensuring seamless integrations. By enabling the _debug flag and leveraging developer tools, developers gain real-time visibility into their configurations, significantly reducing debugging time and minimizing errors. This capability to troubleshoot JQ expressions during the configuration phase enhances the precision and efficiency of adapter development.
Incorporate design-time debugging into your adapter development process to identify issues early and streamline your workflow.