In today’s dynamic world, IT infrastructure advancements that enhance the performance and security of an organization’s IT departments, are taking place constantly. Stakeholders need to be aware of the activities happening within their IT environments. For example, by keeping tabs on the system usage and similar statistics using various monitoring tools, and setting up various alerts when systems get overloaded, like the Central Processing Units (CPU)s becoming overutilized.
However, there are certain use cases people may not be aware of until specifically looking for them, such as the number of login attempts made to the system. This information is usually recorded in logs, which means it would be necessary to manually log into each server and search the logs, or use consolidated log-management tools. To add to the challenge, it would be difficult to extract the frequency at regular intervals, requiring dedicated scripts created and maintained for each host.
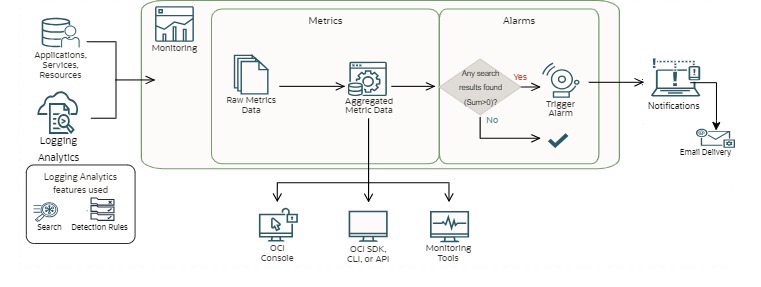
Oracle Cloud Infrastructure (OCI) Observability & Management capabilities can provide a solution to create alerts from the collected logs, by leveraging the Logging Analytics search query customization to filter relevant log entries from a large chunk of log data. There is even the option to extract specific content from log entries to be flagged in alert emails. With minimal configuration, you can convert the log query output into the metrics sent to the monitoring service and create OCI alarms to trigger emails whenever Logging Analytics finds the logs with your required alert use case.
In one of my Lift projects, I created several security alerts from database audit log data to monitor:
a) Unauthorized privilege operation by a set of restricted users
b) Unauthorized table or user deletion
c) List of restricted users trying to access/modify any sensitive content
The solution is designed to regularly scan a large amount of log data that keeps being ingested from log sources and trigger alerts for any security use case configured in this solution.
In this blog, I will explain how to configure this alerting solution for unauthorized access with a root user at a Linux host.
Before You Begin
Before you configure OCI Logging Analytics and alerting, please ensure the following:
- You have access to OCI-Identity-Domain with authorization to update dynamic groups & policies.
- You have OCI Logging Analytics configured to ingest log data from desired sources.
- You have read the Oracle documentation to create log search queries. Refer to Search Query Documentation.
- You have an appropriate notification channel configured with an email address where the alert emails will be sent.
- You have configured the Logging Analytics service to ingest logs from respective log sources. In this example, We have set up log ingestion from Linux host OS logs.
Configuration Steps
1) Configure Search Query to extract required information from audit logs:
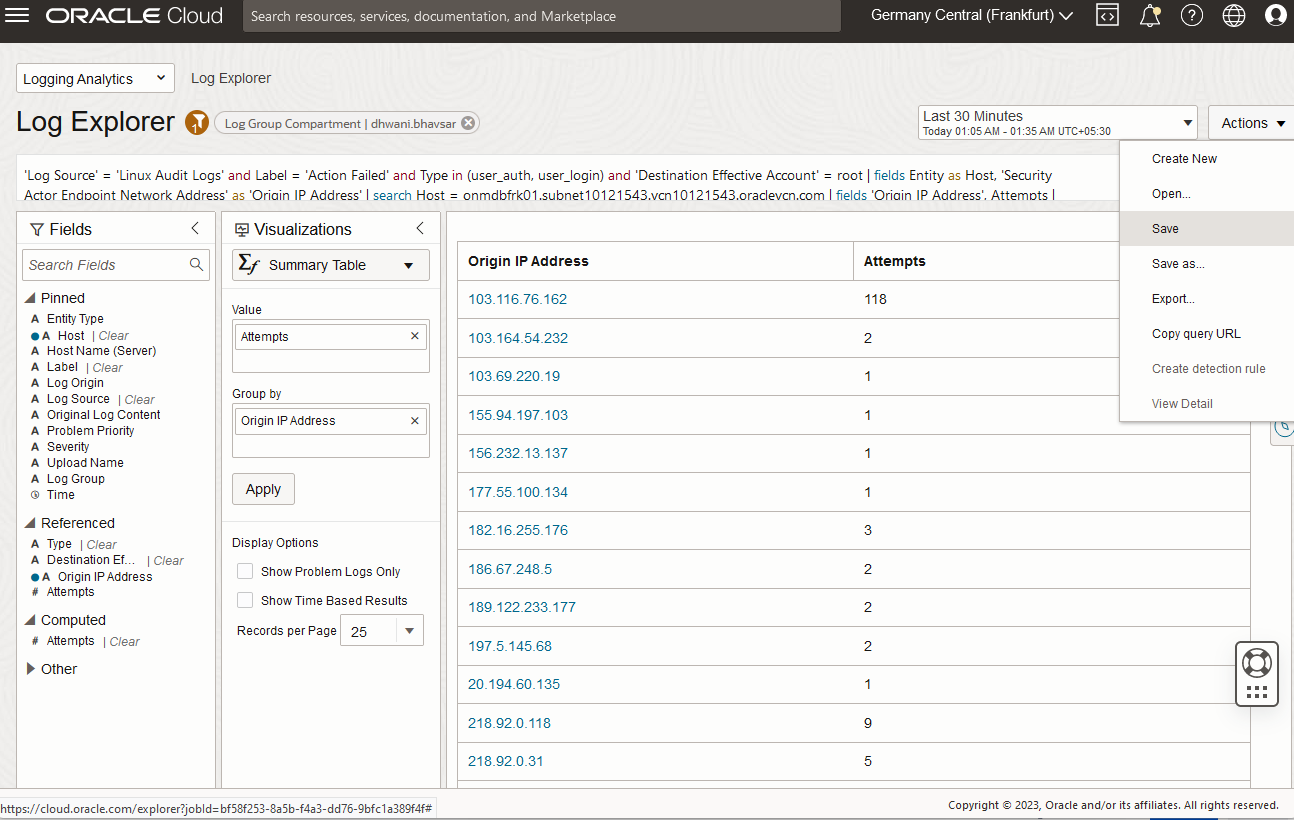
- Navigate to Logging Analytics from Main Menu => Observability & Management => Logging Analytics => Log Explorer.
- Ensure that the right compartment is selected.
- Create your search query by typing a query in the search bar or selecting from fields & visualization sections in Logging Analytics UI.
- Set the duration to the last 10 minutes to search recent logs ingested in the last 10 minutes.
Sample query: ‘Log Source’ = ‘Linux Audit Logs’ and Label = ‘Action Failed’ and Type in (user_auth, user_login) and ‘Destination Effective Account’ = root | fields Entity as Host, ‘Security Actor Endpoint Network Address’ as ‘Origin IP Address’ | search Host = <HOST NAME> | fields ‘Origin IP Address’, Attempts | stats count as Attempts by ‘Origin IP Address’ | where Attempts > 0
- Save the query by clicking “Save” from the “Action” menu from the top right area in Log Explorer UI. Provide the appropriate Search Name and description in the Save Search page.

2) Schedule search query using the Detection Rule:
- Navigate to Observability & Management => Logging Analytics => Administration => Detection Rules => “Create rule” to create a detection rule.
- Ensure you select the saved search created in the above section.
- Select “Monitoring” target service and desired metric namespace and metric name.
- Specify the Interval (Note: You can have a minimum interval of 5 Minutes and a maximum of 21 Days).
- Add the following Dynamic group and policies in OCI Identity & Security services to allow Logging Analytics to generate metrics in OCI Monitoring.
Dynamic Group:
ALL {resource.type=’loganalyticsscheduledtask’, resource.compartment.id='<COMPARTMENT OCID>’
Policy:
-
-
- allow group <group_name> to use loganalytics-scheduled-task in tenancy
- allow dynamic-group <dynamic_group_name> to use metrics in tenancy
- allow dynamic-group <dynamic_group_name> to read management-saved-search in tenancy
- allow dynamic-group <dynamic_group_name> to {LOG_ANALYTICS_QUERY_VIEW} in tenancy
- allow dynamic-group <dynamic_group_name> to {LOG_ANALYTICS_QUERYJOB_WORK_REQUEST_READ} in tenancy
- allow dynamic-group <dynamic_group_name> to READ loganalytics-log-group in tenancy
- allow dynamic-group <dynamic_group_name> to read compartments in tenancy
-
- Wait for the Last Run Status to be reported as Success before proceeding further.
The Logging Analytics will execute the query at specified intervals and post metrics in the OCI monitoring service.
Note: You can keep the detection interval value less than the search duration to avoid any log entry missing due to delayed ingestion.
- If the Last Run Status is in Failed status, validate your search query and update it.
- Once the Last run status becomes a success, create alarms by clicking on the “Create Alarm” button from the Detection Rule page.


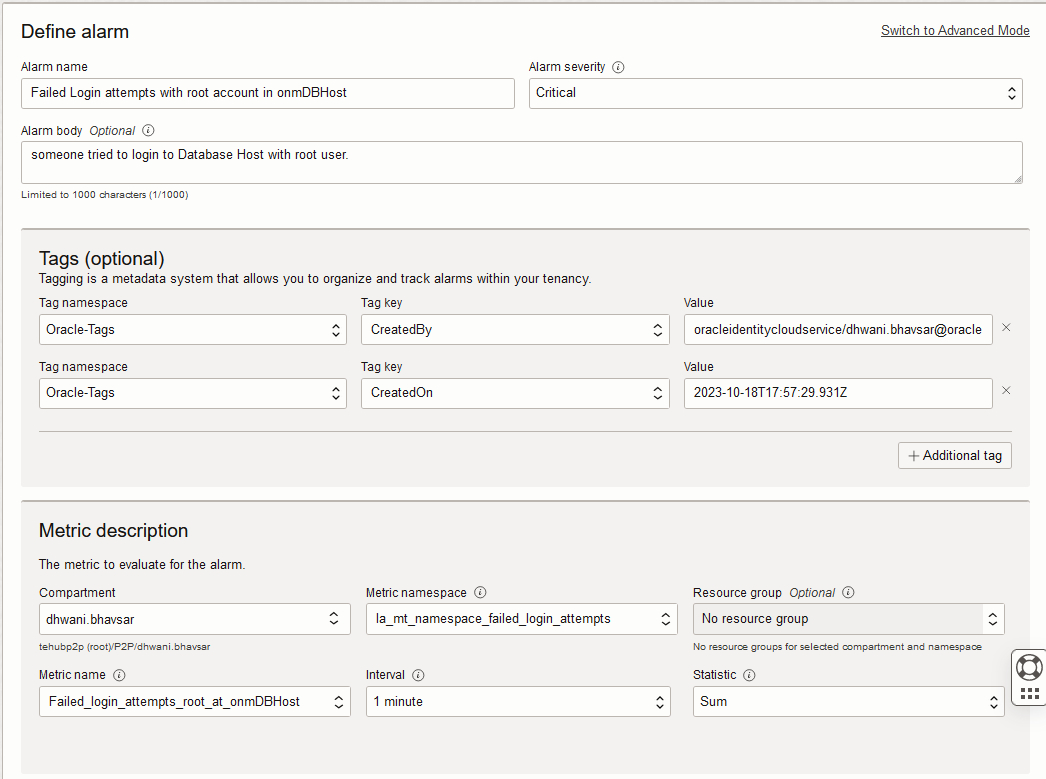
3) Define Alarm and Notification.
- Provide the Alarm Name, Alarm Body, and compartment. Metric details would be pre-filled in the Define Alarm form as it captures the same from the Detection Rule details.
- Select Alarm Severity with regards to the affected system. (i.e. Critical, Error, Warning, Info).
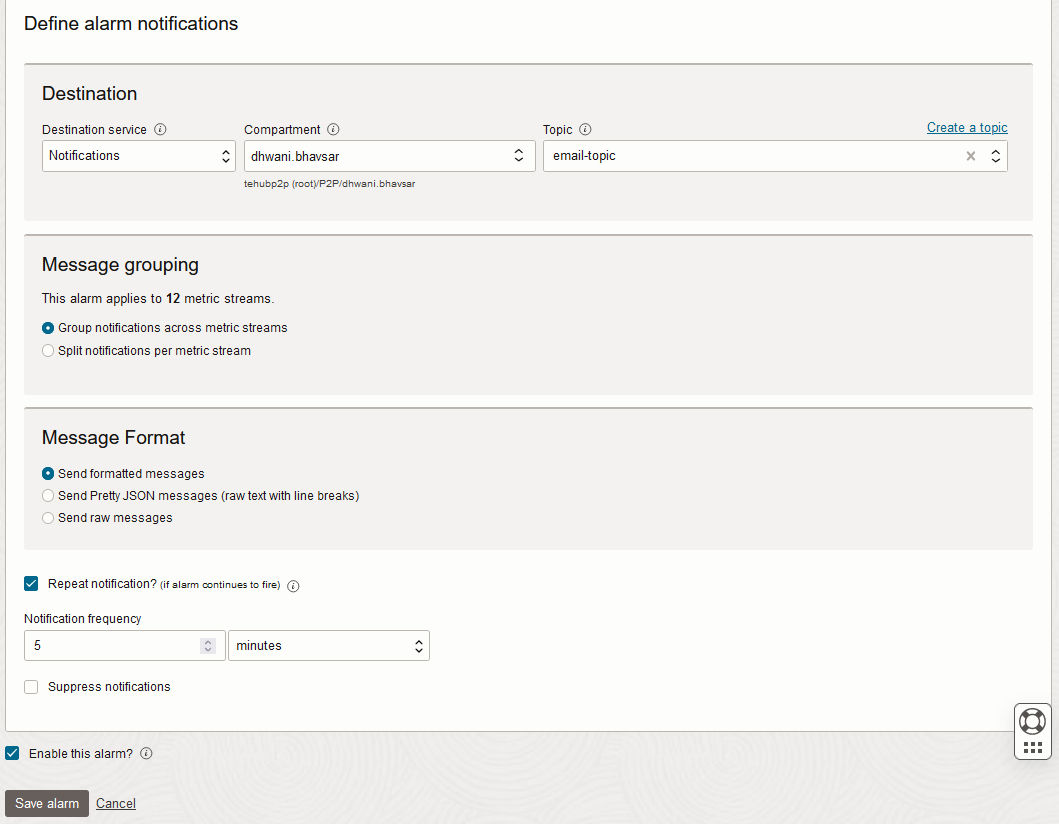
- Select Notification as Destination and the topic you created to send the emails from the OCI Notification service.
- Update the metric Interval (data aggregation window)and metric statistic.
- Select metric dimensions for the alert.
- Set the Trigger rule as per your requirement, here I have configured an alarm to trigger even if I receive one matching log entry.
- Select Notification Destination Service and the topic you created to receive the emails from OCI. I have selected “Notification” as the destination and “email-topic” as the Topic (which I already created earlier).
- Enable Repeat Notification to handle alarm in firing state and set the “Notification Frequency” to resend notification at the specific interval. This is required when the alarm triggers for a longer duration.

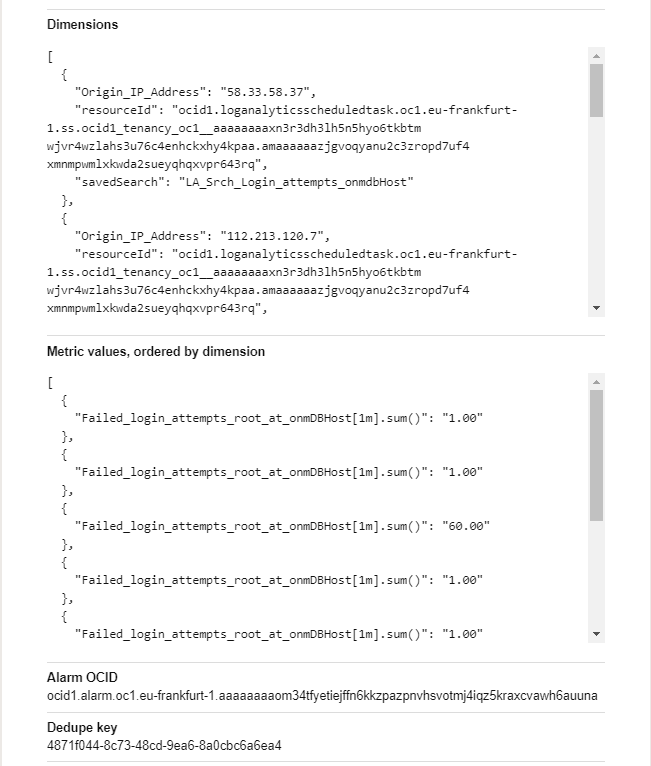
4) Sample Email notification.
The Alarm goes from OK to Firing state once it is triggered and sends an email to the destination email address specified in OCI Topic.
You will receive the email with the alarm summary, severity, timestamp, and number of metrics breaching the threshold with additional information from the search query and alarm configuration.
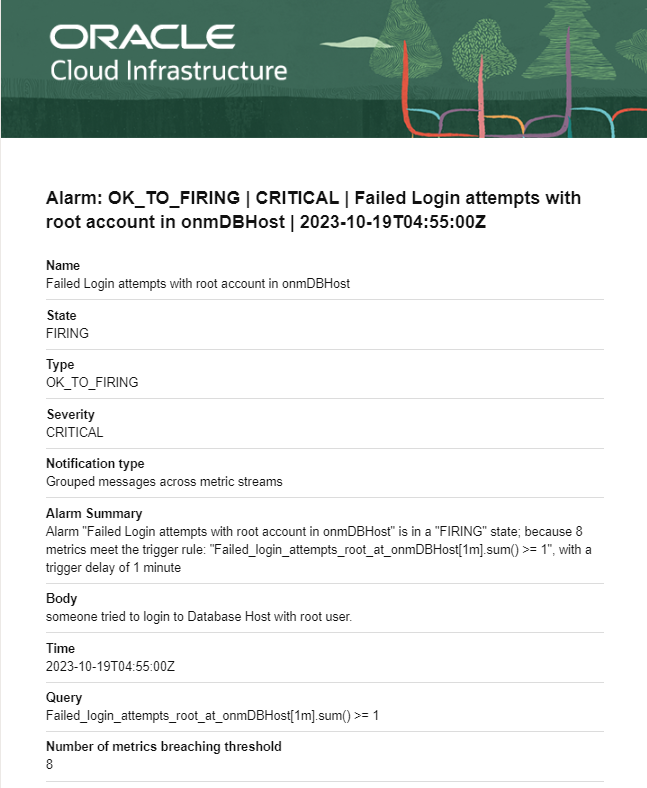
After the alarm stops triggering, you will receive one more email with the Body Alarm: FIRING_TO_OK which indicates that the alarm is not triggering now and will trigger again once it matches the trigger condition in the future.
Monitor, analyze, and manage multi-cloud applications and infrastructure environments with full-stack visibility, prebuilt analytics, and automation using Oracle Cloud Observability and Management Platform. For Observability and Management services and products refer to Observability and Management Services.
This article has showcased the specific use case of receiving proactive alerts as soon as an event occurs, helping admins to save a considerable amount of time and effort to quickly obtain the necessary information to fix issues or begin a further investigation. You can use this blog as a reference to create your own custom solutions, which are based on various kind of logs collected in Logging Analytics, to get prompt alerts. You can also create various kinds of dashboards with the logs collected in Logging Analytics services. For example, you could create a dashboard with the same search query used for the alerts.
For more information, please refer to the Oracle Cloud Infrastructure Log Logging Analytics documentation, which provides additional details around what I have discussed and more.
Learn more about:
