Building an AI agent is an important milestone but delivering consistent, reliable performance in real-world scenarios is what truly matters. As agents begin interacting with users and supporting business processes, teams need clear visibility into how they perform. Are responses fast and accurate? Are there delays or inconsistencies across sessions? Understanding these behaviors is critical to improving outcomes.
This is where Oracle Fusion AI Agent Studio’s Monitoring and Evaluation framework plays a key role
Agent Studio includes built-in capabilities that act as a health and performance dashboard for your agents. These tools enable you to:
- Monitor agent activity in real time
- Track key performance metrics
- Run structured evaluations to measure quality and reliability
- Trace agent behavior step by step through detailed session timelines
The monitoring tools provide ongoing visibility into how agents operate, while the evaluation framework helps you systematically assess and refine their performance.
Together, they transform AI agents from opaque systems into solutions that are transparent, measurable, and continuously improving.
In this blog, we’ll explore how the Monitoring Dashboard works, the key metrics available, and how session timelines help you understand exactly what your agent is doing during every interaction.
Before You Start: The One Setup Step You Can’t Skip
Before any data shows up in your monitoring dashboard, you need to run a background process that pulls everything together. Here’s how:
Head to Navigator > Tools > Scheduled Processes, click Schedule New Process, leave the type as Job, then search for and select Aggregate AI Agent Usage and Metrics. Run it.
This process aggregates the metrics displayed in the Monitoring and Evaluation tab, and it can be scheduled to run on a recurring basis. For example, once a day.
Note: Currently the process consolidates data with a one-day backlog.
Getting Into the Dashboard
Once you’re set up, navigate to Navigator > Tools > AI Agent Studio, open the Monitoring and Evaluation tab, and hit the Monitoring sub tab.
What you’ll see first is the big picture a aggregated metrics for all agent runs over a selected time frame, including all types of agent runs, even agents in draft status. This is your starting point for spotting trends. Error rate climbing? Token usage out of control? You’ll see it here.
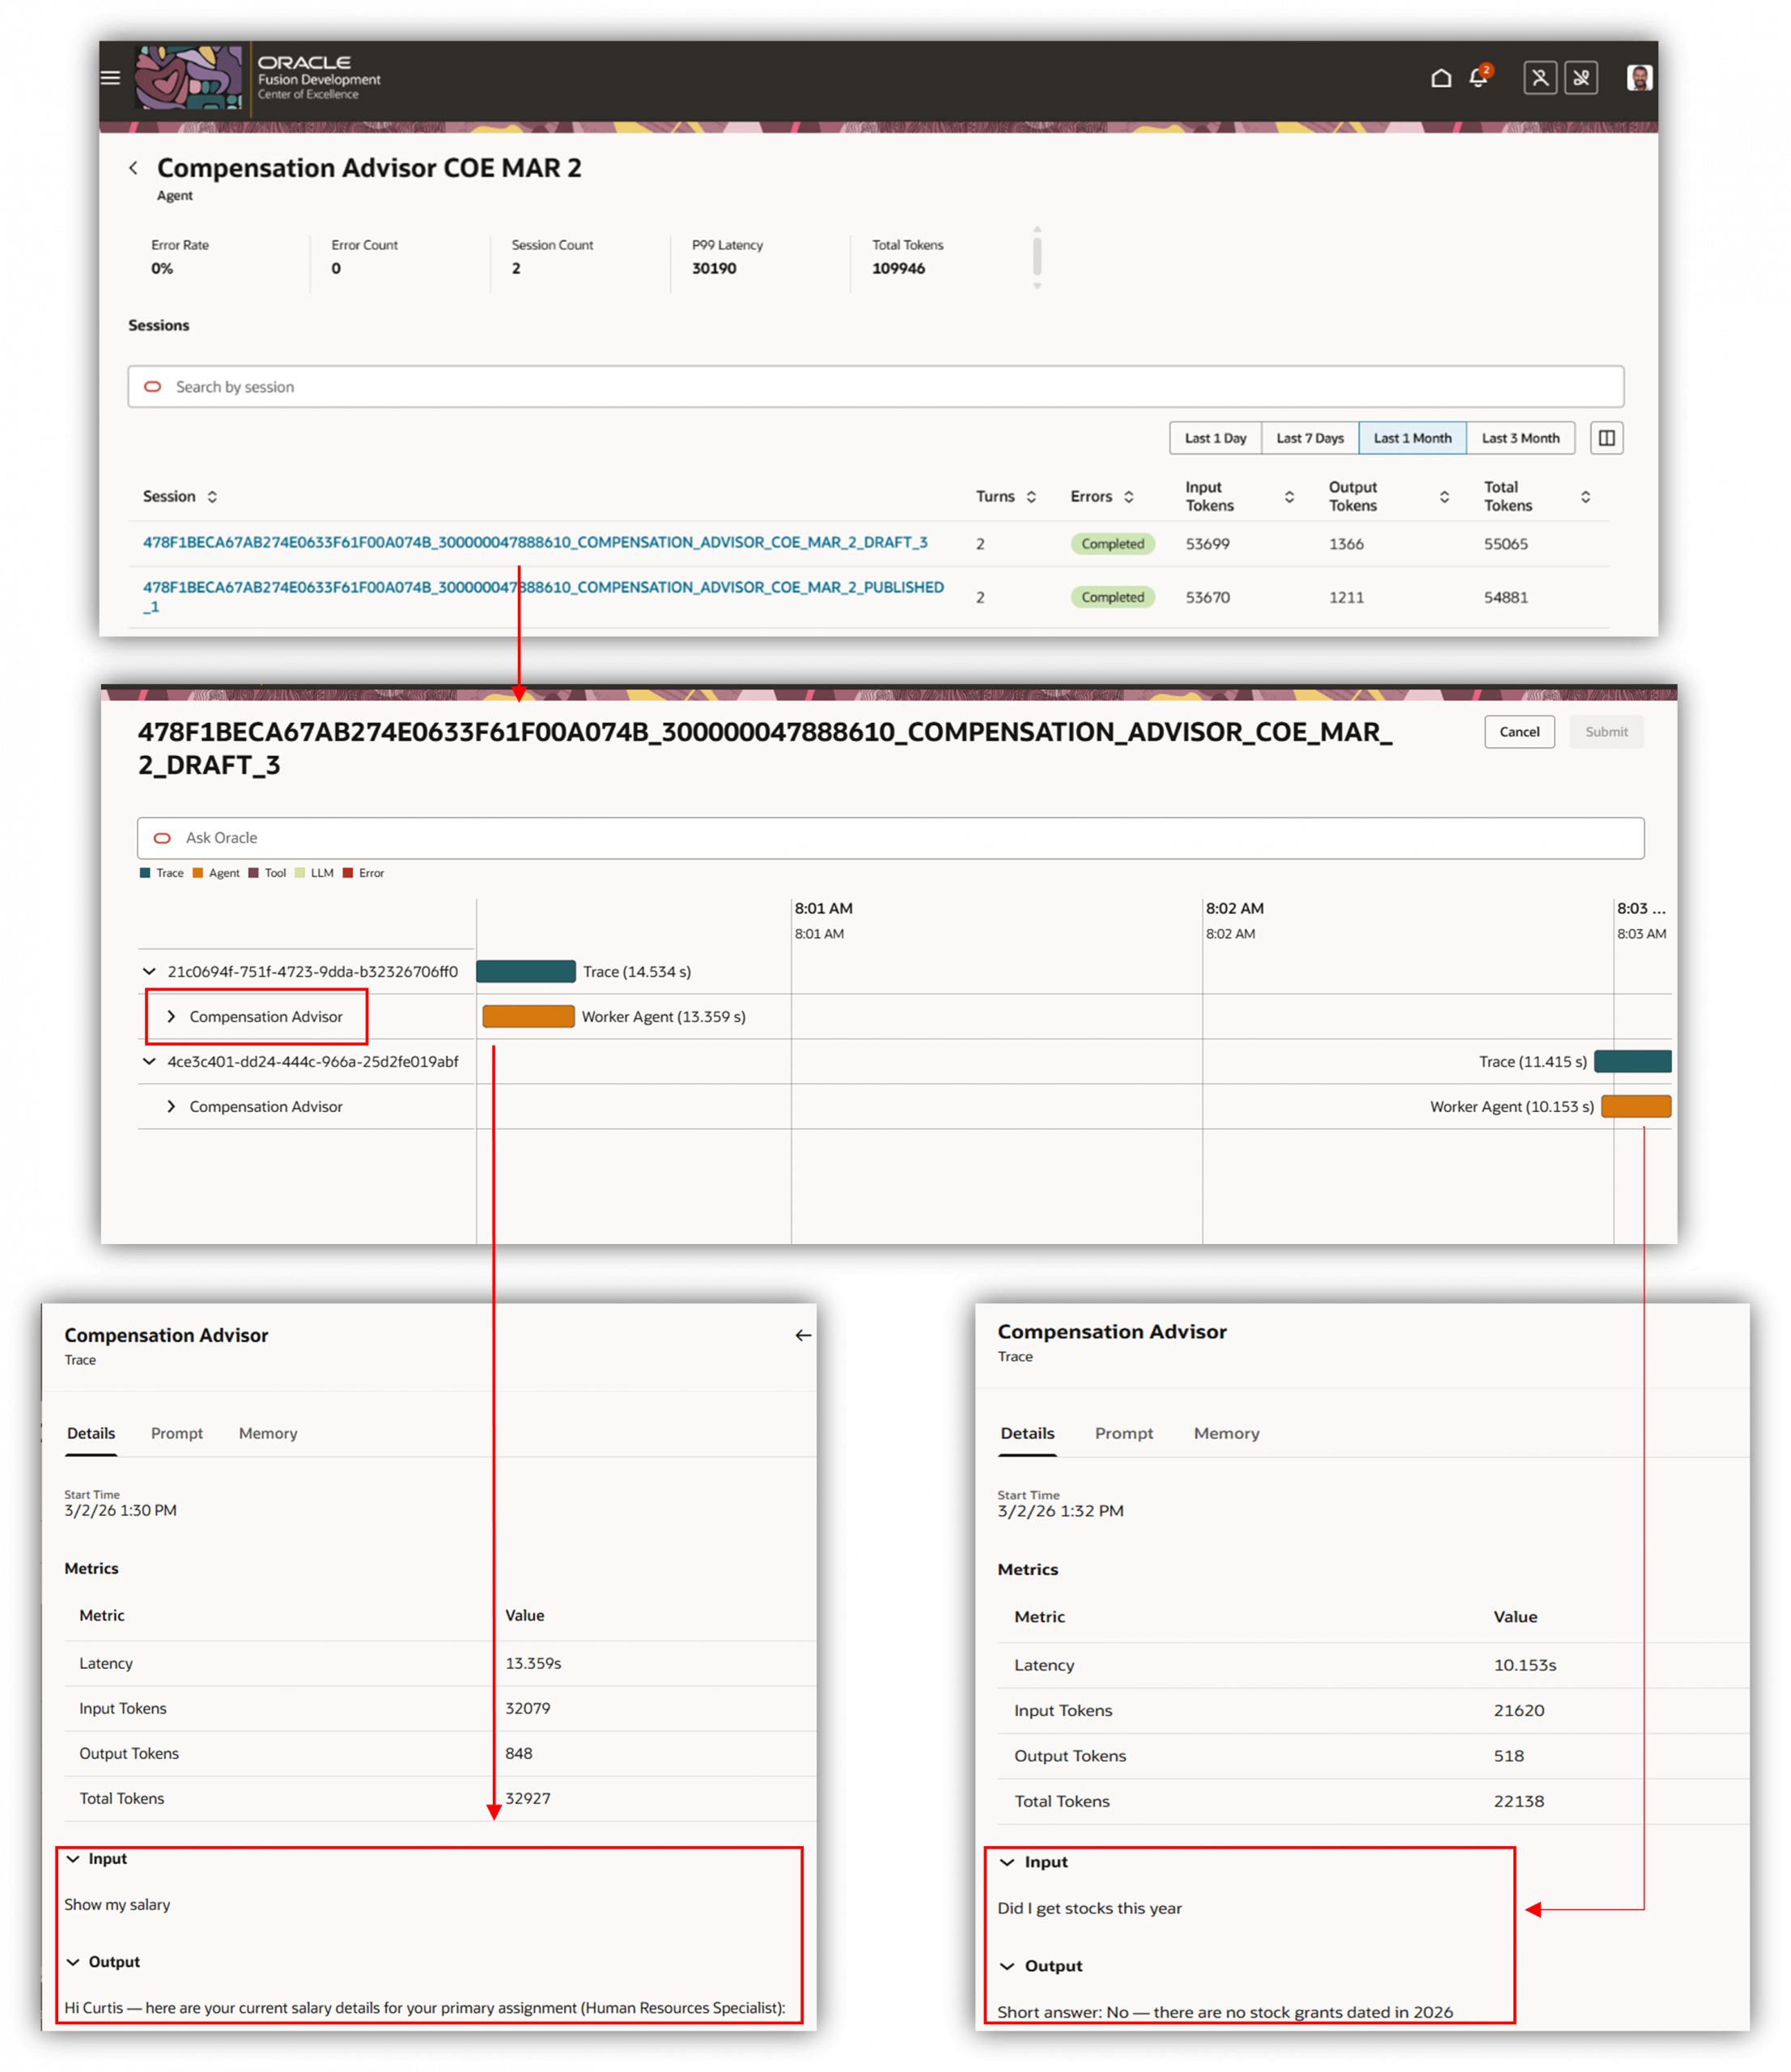
From there, select a specific agent and you drill down to the session level. Each row represents a single session and displays the number of turns, the session completion status, successful or error and the number of tokens used. You can then look into the session level to start figuring out.
The Timeline View:
When you click into an individual session, you get a detailed trace view that provides a step-by-step conversation timeline, shows the tools that were invoked, the duration of each step, and the metrics captured per step. Every decision, every tool call, every hand-off all laid out in sequence. Here’s how to read it without getting lost.
Start at the top. The first few steps provide high level information about the trace/conversation.
The input and output details of the conversation can be seen here.
Watch the tool calls. Every time your agent calls a tool, business object function, or hands off to a sub-agent, it shows up as its own step with its own duration. Click on the line item to view more details about each call. Navigate through the session to review the information.
Errors show up inline. You don’t have to go hunting. If a step failed, it’s flagged right there in the timeline with context about what the agent was trying to do when it went wrong.
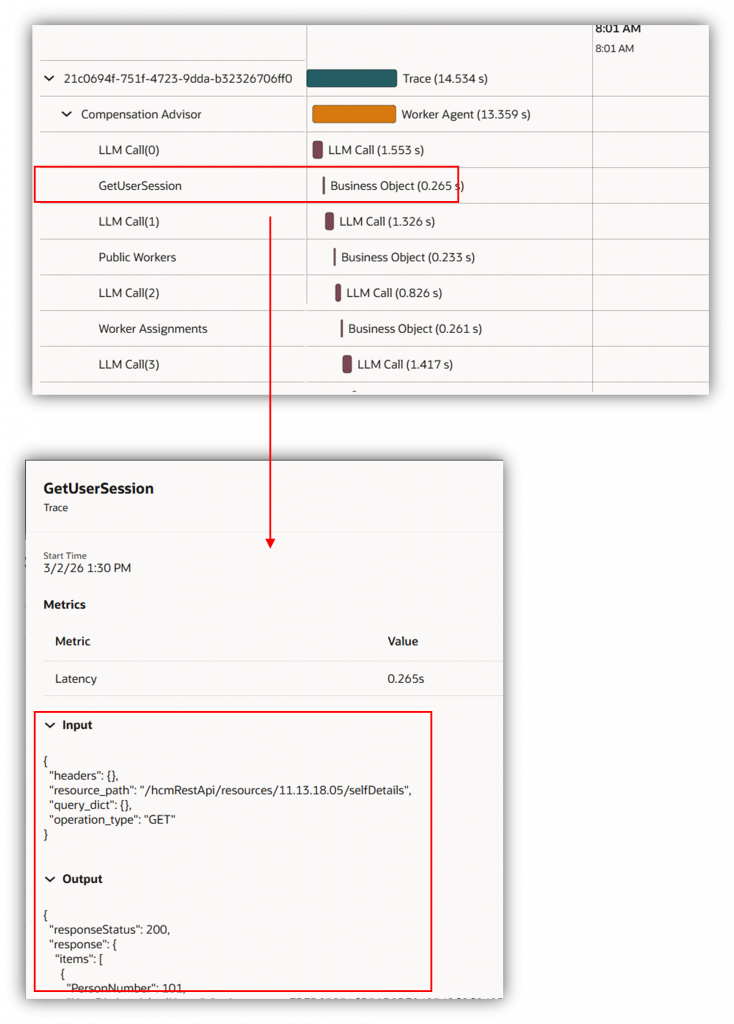
Each line in the first screenshot represents a session and the traces represent the conversation with the agent. On expanding, we can look at the different business object and LLM Calls.
Note: For security reasons the input/output details do not show up when run as an end user from explore mode. It only shows up for runs in debug mode. However other metrics are available for review
Here are the details of the monitoring dashboard metrics
| Metric | Description |
|---|---|
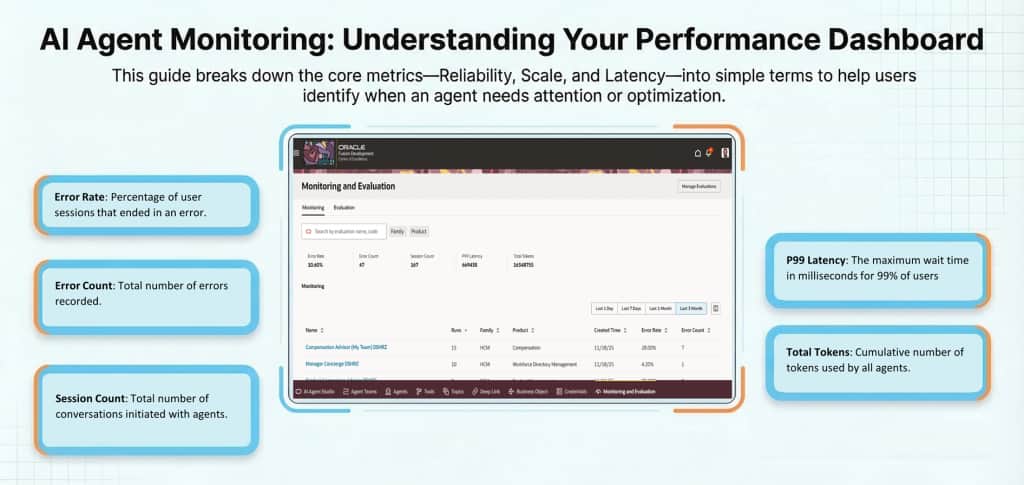
| Error Rate | Out of all the conversations your agent had, what percentage went wrong? If this number is climbing, something needs attention |
| Error Count | The raw number of errors logged. Useful for understanding the actual scale of a problem, not just the percentage |
| Session Count | The number of unique conversational sessions between a user and an AI agent. One session can include multiple messages or evaluation runs |
| P99 Latency | The maximum wait time in milliseconds for 99% of users, revealing any areas where you should review and optimize the prompts or structure of the agent. |
| Total Tokens | Cumulative number of tokens used by all agents. |
| Runs | The number of sessions user had with the agent |
| Turns | The number of conversations in a session |
| Input Token Count | Total tokens sent to the LLM for requests. This includes system prompts, user messages, retrieved or context data, chat history, and tool or function definitions. |
| Output Token Count | Total tokens generated by the LLM for requests sent to it |
Review monitoring details for a specific user session
To review monitoring details for a specific user session, the process is typically indirect and requires help from the user.
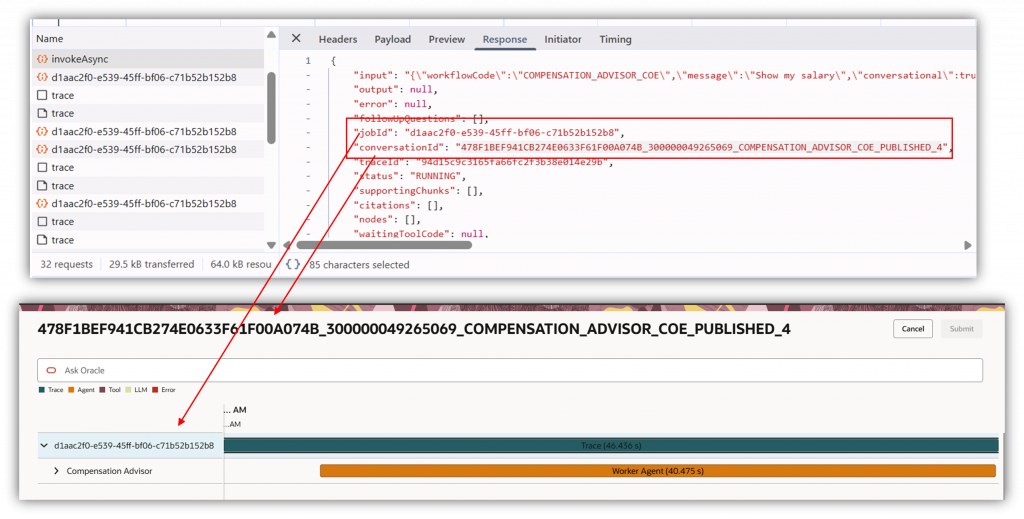
You’ll need the user to capture and share a HAR (HTTP Archive) file from their browser. The HAR file includes the key identifiers needed for troubleshooting—most importantly the Session ID and any available trace information.
Once the admin has the HAR file, they can use the Agent Name, Session ID/trace details to locate the corresponding session for that specific agent and review operational metrics such as timing/latency, token usage, and other performance indicators.
For security and privacy reasons, this level of monitoring is limited to metadata and metrics only. Administrators can validate performance and diagnose issues, but they cannot view the user’s actual inputs or responses/outputs from the session in this workflow.
AI Agent Studio’s Monitoring tools give you the visibility needed to keep your agent performing at its best after deployment. From high-level dashboard metrics to step-by-step execution timelines, diagnosing and resolving issues has never been more straightforward. With the right monitoring habits in place, you can continuously monitor and ensure your agents are running efficiently.