Non-Exadata systems offer dramatically different I/O characteristics compared to Exadata. The primary I/O performance tuning approach on these systems is to simply increase the SGA (System Global Area) size. Exadata offers dramatically better I/O performance including lower latency, higher throughput, and Storage Offload capabilities that simply don’t exist in conventional systems. Migrating databases from legacy systems to Exadata brings an opportunity to right-size the System Global Area, but this is often skipped to expedite the migration process. We always assume the least possible change when moving to Exadata, but customers might optimize their database after moving.
In this article, we will explain how to evaluate SGA memory sizing on legacy systems to determine whether the SGA can be safely downsized (and downsized by how much) without performance tuning when moving to Exadata.
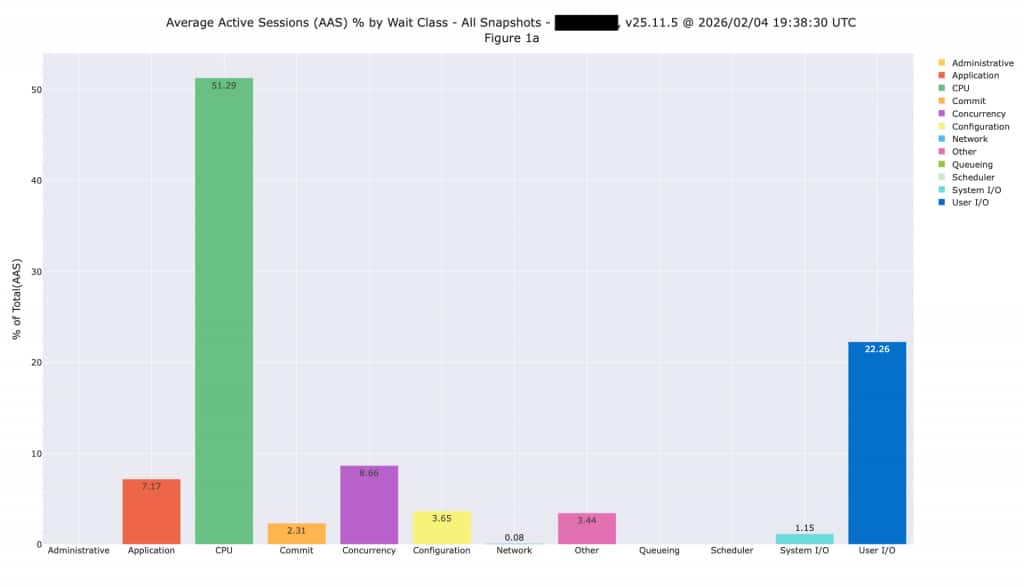
Average Active Sessions
Looking at Average Active Sessions by wait class gives you an overall sense of what’s happening in the database and where time is being spent. We typically see databases spending time on CPU or on I/O, while some databases might be spending time on other activities such as concurrency and application-induced issues. The following plot shows a database spending 51% of time on CPU, and 22% on I/O. It does have some row locking issues, but we can’t address that without application changes or by simply changing the platform.
Evaluating I/O Latency
Non-Exadata systems post 2 critical wait events for READ activity and 2 critical wait events for write activity. The end-user or application is waiting on these read events, so they are always considered critical. Oracle databases do the majority of writing in the background (without end-users or applications waiting) except for the commit-related wait events shown below.
- READ
- db file sequential read
- db file scattered read
- WRITE
- log file parallel write
- log file sync
These wait events can be easily seen using a variety of Oracle performance analysis tools including Oracle Enterprise Manager and Oracle AWR (Automatic Workload Repository) reports. The following is a plot created by querying the underling AWR History views:
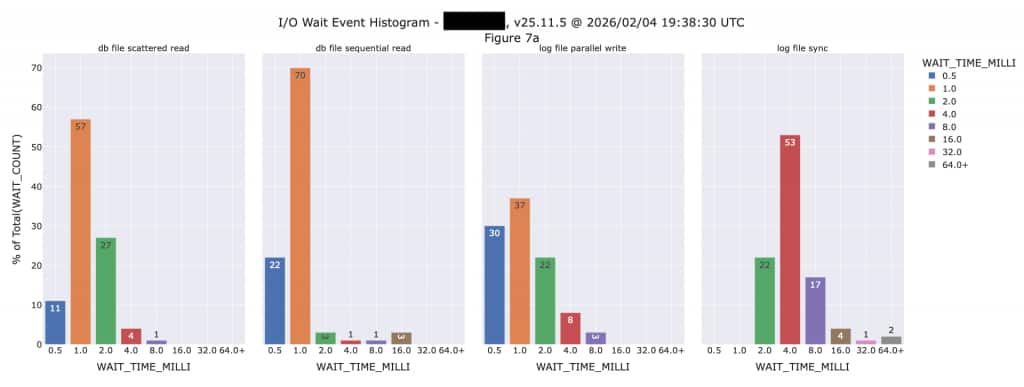
We can see from this histogram that I/O latencies on the existing system are not nearly as fast as we will see when this database is moved to Exadata. The “db file sequential read” event shows 70% of those happening in 1,000 microseconds (µsec) and the majority (53%) of “log file sync” events are taking 4,000 microseconds. All of these critical I/O events will be much faster on Exadata, so we should have some flexibility to reduce the SGA size. The plot above is shown in milliseconds, but with Exadata we are generally talking in terms of microseconds these days. There are 1,000 microseconds in a millisecond, so it’s an entirely different world running databases on Exadata.
Multi-Block Scans vs. Single Block I/O
We often talk about “Transaction Processing” and “Analytic” databases, but the reality is that nearly every database is a mix of these workload types. Transaction Processing databased predominantly do single block I/O, while Analytic databases predominantly do multi-block or Scan I/O. The following is a great example of this behavior. Notice this database does both single block I/O (db file sequential read) as well as multi-block I/O (db file scattered read). However, look at the scale of each at the LEFT of each graph:
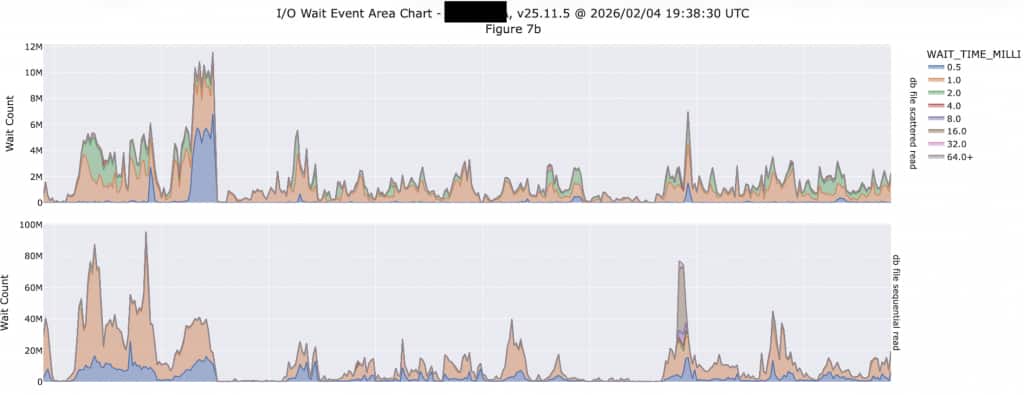
The upper plot shows multi-block I/O (db file scattered read) with 12M (million) on the upper end of the scale, while the lower plot runs up to 100M. This database is doing 8X more single-block I/O than scanning (multi-block I/O) so it is more heavily transactional than analytic. If you look back at the histogram, the latency of these multi-block I/O events are run as high as 4,000 microseconds and higher. Also note these are counts of the number of events during the snapshot interval, so these don’t represent events per second. This database is configured with a 60-minute snapshot interval, so we need to divide by 3,600 to calculate the events per second. Exadata will deliver orders of magnitude more I/O events per second than we are seeing here.
SQL Offload Opportunities
We need to look for Direct Path I/O to determine whether the I/O will clearly offload into Exadata Storage. On systems with a high enough proportion of Direct Path I/O, those events will show in the Top 10 Timed Events report shown below. We normally expect these events represent SQL that will be offloaded once this workload is moved to Exadata. We can’t simply look at multi-block reads because those won’t necessarily translate into offload, while direct path read is a better measure.
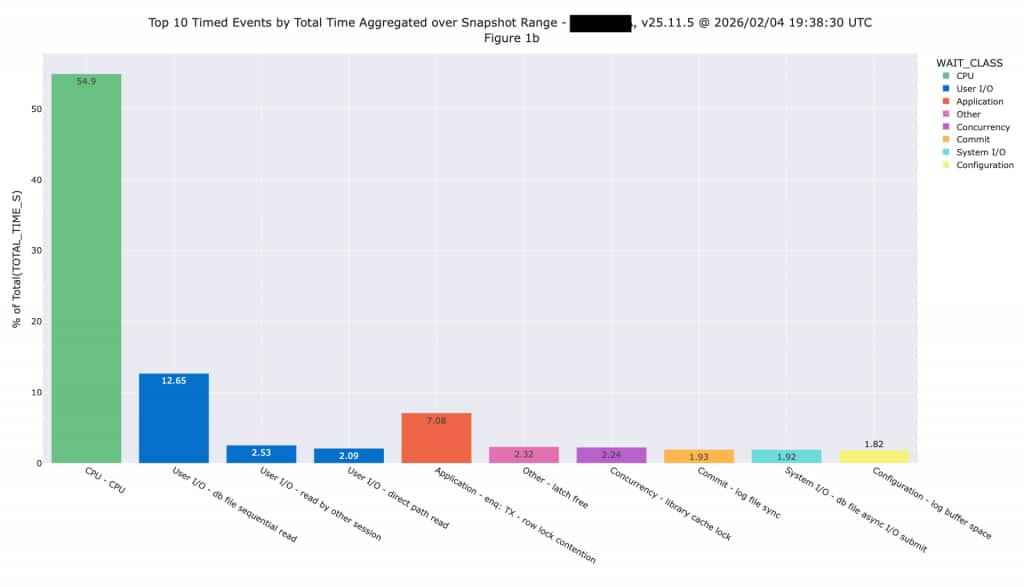
This application is primarily OLTP, so we aren’t expecting large amounts of I/O will be offloaded after moving to Exadata. It’s possible the application team will conduct some performance tuning that will change the workload, but we don’t assume any performance tuning changes during a sizing exercise. One of the fundamental rules of sizing is you don’t want to combine sizing and performance tuning because you can quickly get into an infinite loop effort (tune and size, tune and size, etc.). We need to assume the system is properly tuned, then size to handle the resulting workload.
Using the SGA Target Advisor
The Oracle Database SGA Target Advisor provides information about the performance impact of increasing or decreasing SGA size. The automatic analysis performed by the database shows the expected impact on I/O by increasing or decreasing SGA memory size. We have plotted values from the SGA Target Advisor (available in AWR reports and other tools) so you can more easily see what’s happening. On the existing system, the I/O is expected to increase (shown in red) as the SGA size is reduced or decrease (shown in green) if the SGA was made larger.
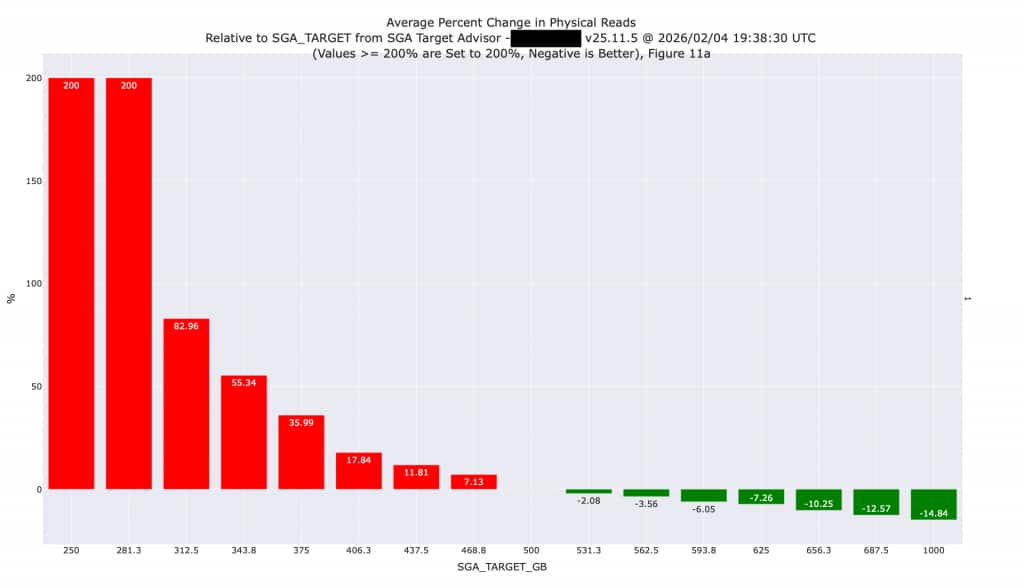
We know the legacy system has inferior I/O performance as outlined in a previous section of this article. In addition, some amount of I/O and SQL processing (approximately 10% in this case) will be performed at the Exadata Storage layer (see the discussion of Direct Path I/O earlier in this article), thereby reducing pressure on the SGA. Because of the superior I/O performance and SQL Offloading on Exadata, we can safely reduce the size of this SGA by 30% (from 500 GB to 350 GB) without huge increases in I/O. Downsizing the SGA will increase I/O by approximately 50%, but those I/Os will be faster moving to Exadata. Additional changes might be possible once this database is moved to Exadata, so it would be advisable to repeat this analysis once the database is moved.
During this exercise, it’s important to analyze the AWR snapshot interval that shows the highest amount of activity because these statistics are cumulative since the last instance restart. The snapshot interval with the highest activity will normally be the LAST available interval, but it could be an earlier interval if the database was restarted.
High Season Metrics
It is absolutely critical to consider the dates represented in the AWR History. For example, when a business and database is highly seasonal, it’s critical to perform this analysis on metrics that were generated during high season. The default (and minimum) AWR history retention is 8 days, so querying the active database simply gives you the most recent 8 days of activity. That might be adequate for diagnosing a current performance issue but might not be the ideal time to perform sizing. You might need to look at a prior period of AWR History to ensure the peak season is captured. You might also want to consider increasing the AWR history retention to approximately 33 days to ensure the history always includes an entire month of metrics.
One great example of a “high season” is any seasonal retail business. Sizing is NEVER done during the retail peak season. The entire staff is often too busy ensuring that systems are running smoothly and typically don’t have time to spend on sizing and capacity planning. The staff won’t even look at sizing systems for the next peak season until well after the peak retail season has passed. In those cases, the last 8 days of metrics certainly don’t cover the peak season, which might have happened months ago.
Conclusion
Any properly sized Exadata system will deliver superior I/O performance compared the legacy system shown in this analysis. The Oracle System Global Area (SGA) can often be reduced during migration due to the superior I/O performance of Exadata. We recommend performing analysis before reducing SGA size as outlined in this article.